React Performance Engineering
Most React apps are slow for the same three reasons: too many re-renders, too much in the DOM at once, and work that blocks the main…
React Performance Engineering
Most React apps are slow for the same three reasons: too many re-renders, too much in the DOM at once, and work that blocks the main thread. This article addresses all three without theory overload.
Part 1: How React Decides What to Update
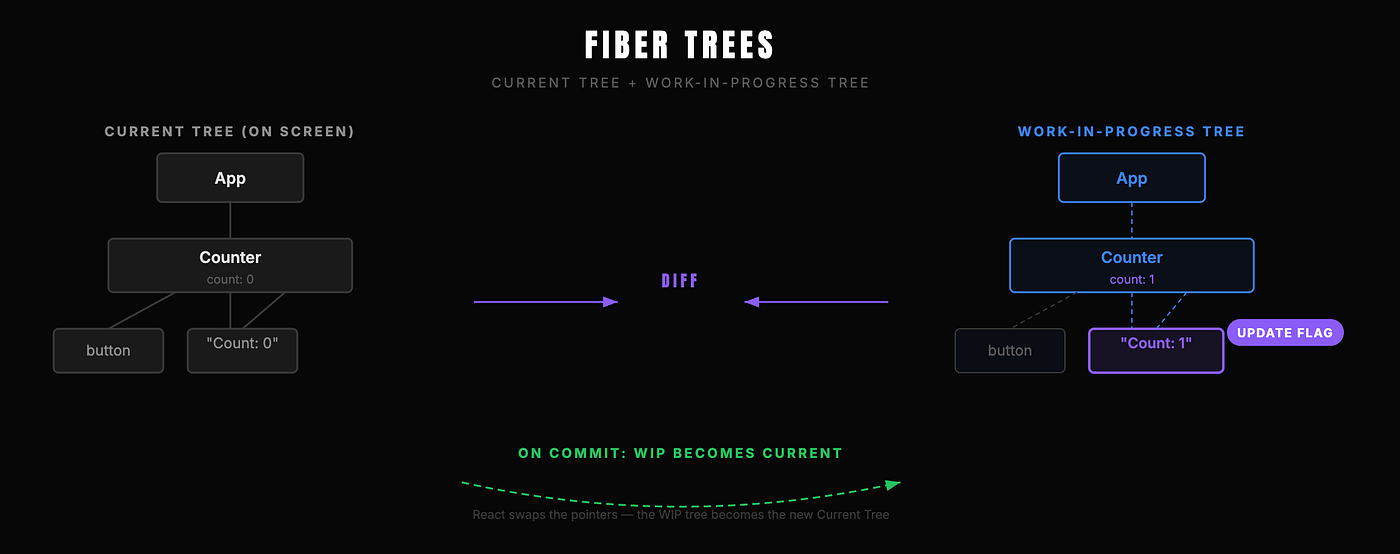
Every state change triggers a cycle: React calls your component function (the render phase), compares the output to what is already on screen (reconciliation), then writes the minimal set of changes to the real DOM (the commit phase).
The render phase is pure and interruptible. React uses an internal engine called Fiber to break this work into small units so it can pause, reprioritize, or restart without freezing the browser. The commit phase is the opposite, it runs synchronously and cannot be interrupted. Batching multiple state updates before the commit phase is one of the ways React avoids unnecessary DOM writes.
Fiber Trees
Big Word Alert: Reconciliation. This is the full process of comparing the old component tree to the new one and deciding what changed. Diffing is just the comparison step inside reconciliation. The two words mean different things.
Here is what the cycle looks like in plain terms:
- Something triggers a change (setState, new props, context update)
- React calls your component functions to build a new tree
- It diffs the new tree against the current one
- Only the changed nodes get written to the real DOM
- The browser paints the updated pixels

The Render Cycle

Render Cycle Annotated (Interruptible vs Synchronous)
Understanding this cycle tells you exactly where performance problems come from. If your component renders too often, the problem is in step 1 or 2. If rendering is slow, the problem is in step 3. If the DOM update is slow, the problem is in step 4.
Part 2: Controlling Re-renders
By default, when a parent re-renders, every child re-renders too, even if their props did not change. This is the most common performance problem in React applications.
React.memo wraps a component and tells React to skip re-rendering it if the props are shallowly equal to the previous render.
// Without memo - re-renders every time Parent re-renders
function ProductCard({ name, price }) {
  return <div>{name} - {price}</div>
}

// With memo - only re-renders when name or price actually changes
const ProductCard = React.memo(function ProductCard({ name, price }) {
  return <div>{name} - {price}</div>
})
Pros of React.memo:
- Prevents unnecessary child renders in large trees
- Zero change to component logic or JSX
Cons of React.memo:
- Shallow comparison fails for object and array props created inline
- Adds a small overhead per render for the comparison itself
- Gives no benefit if the component always receives new prop references

Re-render Cascade with React.memo
That last point is where most engineers trip up. If you pass an inline function as a prop, React.memo does nothing because the function reference is new on every render.
const Parent = () => {
  // This creates a new function reference on every render
  // React.memo on ProductCard will not help here
    return <ProductCard onClick={() => handleClick()} />
}
The fix is useCallback, which keeps the same function reference between renders as long as its dependencies do not change.
const Parent = () => {
  const handleClick = useCallback(() => {
    doSomething()
    }, []) // stable reference - safe to pass to memoized child
  return <ProductCard onClick={handleClick} />
}
useMemo does the same thing for computed values. Use it when a calculation is genuinely expensive — sorting thousands of records, running a filter across a large array, or deriving complex data structures.
const sortedProducts = useMemo(() => {
  return products.slice().sort((a, b) => a.price - b.price)
}, [products])
AI Aside: A lot of engineers add useMemo and useCallback everywhere as a reflex. This is counterproductive. Both hooks have a cost, they allocate memory for the cached value and run a dependency comparison on every render. For cheap calculations or components that receive new prop values frequently anyway, you are adding overhead without removing any. Profile first. Optimize second.
Part 3: Loading Less JavaScript
The fastest code is the code the browser never downloads. React.lazy and Suspense let you split your bundle so users download only the JavaScript needed for the current route.
import { lazy, Suspense } from 'react'
const Dashboard = lazy(() => import('./Dashboard'))
const Analytics = lazy(() => import('./Analytics'))

function App() {
  return (
    <Suspense fallback={<div>Loading…</div>}>
    <Dashboard />
    </Suspense>
  )
}
When a user visits the homepage, the browser fetches the main bundle. The Dashboard code is only fetched when the user navigates to it. On a slow connection or a large app, this is the difference between a 2-second load and a 6-second load.
Big Word Alert: Code splitting. The technique of dividing one large JavaScript bundle into smaller chunks that load on demand. Routers like React Router make this trivial when combined with React.lazy.
useTransition is a related tool for state updates specifically. It lets you mark an update as non-urgent, which keeps the UI responsive while React processes the heavier work in the background.
const [isPending, startTransition] = useTransition()
const handleSearch = (query) => {
  startTransition(() => {
  setResults(filterProducts(query))
  })
}
Without startTransition, typing in a search box that filters 5,000 items blocks the input field on every keystroke. With startTransition, React keeps the input responsive and processes the filter in idle time.
Part 4: Long Lists
Rendering 5,000 list items creates 5,000 DOM nodes. Most of them are off-screen. The browser holds all of them in memory and lays them all out anyway.
Virtualization fixes this by rendering only the items currently visible in the viewport — typically 10 to 20 nodes instead of thousands. The library react-window makes this straightforward.
import { FixedSizeList } from 'react-window'
function ProductList({ products }) {
  const Row = ({ index, style }) => (
    <div style={style}>
      {products[index].name}
    </div>
    )
    return (
      <FixedSizeList
        height={600}
        width="100%"
        itemCount={products.length}
        itemSize={60}
        >
        {Row}
      </FixedSizeList>
  )
}
Pros of virtualization:
- DOM node count drops from thousands to tens
- Memory usage falls proportionally
- Scroll performance becomes smooth on all devices
Cons of virtualization:
- Absolute positioning inside the list breaks some CSS patterns
- Accessibility requires additional work (landmarks, focus management)
- Variable-height items need the VariableSizeList variant and a size estimator

List Virtualization
Part 5: Profiling Before You Optimize
Performance work done without measurement is guesswork. React DevTools ships with a Profiler that shows exactly which components rendered, how long each took, and why each one re-rendered.
How to use it:
- Open React DevTools in your browser
- Click the Profiler tab
- Click Record
- Interact with the slow part of your app
- Click Stop
The flamegraph shows every component that rendered in that session. Width corresponds to render time — wider bars are slower. Grey bars were skipped by memoization. Click any bar to see “Why did this component render?” which tells you whether the trigger was a state change, a prop change, or a parent re-render.
Start with the widest orange bar. That is your bottleneck. Fix it. Profile again. Repeat.

React DevTools Profiler (Flamegraph)
AI Aside: The Profiler only runs in development mode, and React development builds are slower than production builds. If you profile in production, use the profiling build of React (react-dom/profiling). The patterns you find will be the same, but the numbers will reflect real user conditions.
Further Reading
- React Docs — Render and Commit: react.dev/learn/render-and-commit
- react-window documentation: react-window.now.sh
- useTransition reference: react.dev/reference/react/useTransition
Performance is measured, not assumed. Open the Profiler, find the slowest component, and fix that one thing. Then measure again.
메타데이터
- post_id
- 24977cd13876
- slug
- react-performance-engineering-24977cd13876
- url
- https://medium.com/@myown4500/react-performance-engineering-24977cd13876
- canonical_url
- https://medium.com/@myown4500/react-performance-engineering-24977cd13876
- author_url
- https://medium.com/@myown4500
- status
- ok
- fetched_at
- 2026-07-09 23:43:16