I worked at the ONLY synchrotron in Canada for a week
Last month, I went to the Canadian Light Source in Saskatoon, Saskatchewan with the Junior Science Olympiad of Canada (JSOC). JSOC selects…
I worked at the ONLY synchrotron in Canada for a week
Last month, I went to the Canadian Light Source in Saskatoon, Saskatchewan with the Junior Science Olympiad of Canada (JSOC). JSOC selects people from all over Canada for the International Junior Science Olympiad (IJSO), a global science competition for students with a passion for science. However, this year, Canada is not sending students to the IJSO, so JSOC chaperones Shawn Brooks, Jennifer Pitt-Lainsbury, and María Isabel Niño Soto, organized a special trip to the CLS for 13 selected students from JSOC.
At the CLS, we learned worked on an experiment focusing on how Cherry Belle Radishes were affected by motor oil and battery leachate contaminants. This article will be mainly focusing on what a synchrotron is and the two main sampling techniques we used, X-Ray Fluorescence (XRF) and X-ray Absorption Near Edge Structure (XANES).
What is a Synchrotron?
What do synchrotrons do?
A synchrotron can be used to probe matter and analyze many physical, chemical, geological, and biological processes. Information obtained by scientists from these analyses can be used to help design new medications, build next-generation technology, examine surfaces and materials to make more effective products like motor oils, develop new materials for safer medical implants, help with the clean-up of mining wastes, and find innovative ways to combat climate change to name just a few applications.
— Canadian Light Source
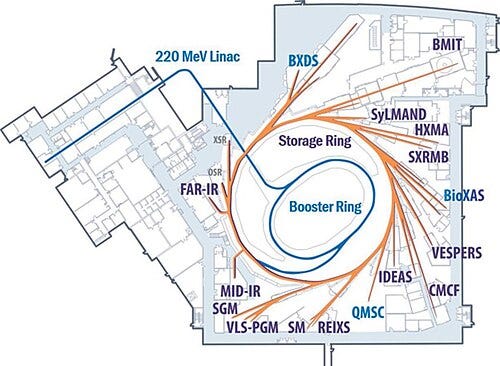
Layout of the synchrotron at CLS, the beamline we used was the IDEAS beamline.
How do they do it?
A synchrotron accelerates electrons around a ring to really close to the speed of light using magnets to guide and bend the electrons and help it turn corners in order to keep it in the ring. Then, as the electrons travel around the ring, it emits energy in the form of highly intense light. The light can differ depending on the research ranging from infrared to X-rays, with many of CLS’s beamlines using X-rays. Using that light, we can get multiple beamlines that can do different things. This concentrated beam of light will be aimed at a sample, depending on the technique and what each beamline is able to achieve, the beamline will collect data on what happens to the sample as the beam of light goes through it. It could be the amount of photons taken in by the sample or energy coming out of the sample as it gets excited by the beam.
What is X-Ray Fluorescence?
XRF doesn’t take too much time, it averages around 2 minutes per scan for a sample.
What does it do?
XRF is a way of sampling material, it shoots photons at the sample, and measures the energy that the atom shoots out through a detector to create a graph of all the elements present that we measured. However, the detector measures all fluorescence surrounding it, so there may be elements from the environment included in the graph of the samples. The two main elements seen are argon (Ar) from the air around the detector and iron (Fe) from the chamber that the laser goes through to get to the sample.

Fig 1: This is an XRF Scan of Kapton Tape, a tape we used to secure the sample in the sample holder. We see Argon present in this graph, it is most likely from the air surrounding the detector so it’s not very important when we analyze the data. Likewise, the iron is not very important as well because it is present in the chamber the laser goes through. Additionally, we see a very high peak on the right side. This is called a scatter peak, it is caused by the scattering of the X-Ray beam and is usually ignored.
How does it work?
When the beam hits an atom at a certain energy level, an electron will be pushed out, and another one will fall down and fill in that hole from a higher energy level. As the electron falls down, it releases a certain amount of energy. The detector measures the energy of the X-rays photons emitted by the atom and forms a graph for us to read.

Fig 2: Picture of an atom. The electron in the inner shell will be kicked out and an electron in a higher energy level will fall down.
How can we read the graph?
We get peaks at different points on the graph. Scientist before have already conducted research so we know the energy peaks of every element. We can use this information to compare to what we have on the graph. This way, we can determine the elements present in the sample. Additionally, we are also able to see the relative amounts of an element in a sample, the higher the peak, the more of an element there is.
What is X-ray Absorption Near Edge Structure?
XANES, compared to XRF takes much more time, it can take around 10–15 minutes per scan.
What does it do?
Knowing the element only is not enough because many elements have different compounds or speciation and it’s important for us to know which speciation the element in the sample is. This is because different species of an element can be either harmful or helpful.
XANES lets you find the speciation of an element. Take chlorine (Cl), as an example. Cl₂ or chlorine gas, is poisonous and in chemical warfare to kill many during WWI. Or HCl, a powerful highly corrosive acid. However, NaCl, otherwise known as table salt, is safe to consume. From chlorine we can see it has both some dangerous speciation as well as some safe speciation.

Three different forms of chlorine, on the left, chlorine gas (Cl₂), in the middle, table salt (NaCl), on the right, hydrochloric acid (HCl)
How does it work?
How XANES works is we start by picking a specific element we want to examine, typically, we choose something interesting amongst our samples while analyzing the XRF scans.
The machine starts to shoot a beam of photons at a certain energy, the energy level in which an element starts to excite. From there, the energy of the beam stays for a period of time (usually in seconds, you’re able to choose) and during that time, the detector counts that amount of fluorescence photons emitted. After each period of time, the energy increases and this process is repeated. This produces a spectrum or graph unique to a compound that shows the amount of energy on the X-axis and the number of photons emitted at each energy. We can compare the spectra from previous experiments to determine the approximate speciation of the element in our experiment.
How do we read XANES spectra?

Fig 3: XANES scan for zinc in used motor oil
This is a scan we made at the synchrotron of used Motor Oil, we compared this spectrum to the XANES spectra of different compounds other scientists made. We looked at the spectrum for ZDDP, also called concentrated zinc dialkyldithiophosphate, a lubricant used in engines to help reduce wears and increase engine life.

Fig 4: conc ZDDP XANES scan shown in green
Comparing both graphs, especially the parts before 9680 eV, we can see some similarities such as the shoulder of the ZDDP spectrum as well as the shoulder on our motor oil sample spectrum. We can conclude from this correlation that there is ZDDP present in the motor oil we found.
Key Takeaways
- Synchrotrons are very useful in analyzing matter. They use information from synchrotrons to create many new innovations.
- Synchrotrons shoot electrons at the speed of light and use the light emitted by the electrons to conduct research.
- XRF is a quick way to find out the elements present and the relative amounts of each element in a sample.
- Speciation is the different compounds an element can be in.
- XANES is a slower way to find the speciation of a specific element in a sample.
In conclusion, there are many cool ways to use a synchrotron and learn about elements in a sample. This article provides just two sampling techniques out of many. Scientists use techniques like these in their everyday life to learn more about the world around us and use this research to help increase our living standards.
About the author
Hi! I’m Jessica, a current student at University of Toronto Schools, interested in the sciences especially about fusion, the environment, and how we can combat climate change. I also love playing sports such as tackle football and volleyball.
Feel free to reach out through my email jess.xr.lee@gmail.com or my linkedin, linkedin.com/in/jessica-lee-817187342
Bibliography
Canadian Light Source. (n.d.). What is a synchrotron? — canadian light source. What is a Synchrotron? https://www.lightsource.ca/public/what-is-a-synchrotron.php
메타데이터
- post_id
- 25833c8d7abf
- slug
- i-worked-at-the-only-synchrotron-in-canada-for-a-week-25833c8d7abf
- url
- https://medium.com/@ljess/i-worked-at-the-only-synchrotron-in-canada-for-a-week-25833c8d7abf
- canonical_url
- https://medium.com/@ljess/i-worked-at-the-only-synchrotron-in-canada-for-a-week-25833c8d7abf
- author_url
- https://medium.com/@ljess
- status
- ok
- fetched_at
- 2026-08-11 19:41:39