Day 12 of Learning Testing: State Transition Testing
Welcome back to Day 12 of my software testing journey! Over the past few days, we’ve covered Black-Box techniques like Equivalence…
Day 12 of Learning Testing: State Transition Testing
Welcome back to Day 12 of my software testing journey! Over the past few days, we’ve covered Black-Box techniques like Equivalence Partitioning and Decision Tables. Today, we are looking at a technique used when a system’s behavior depends on what happened before the current action.
Think about an ATM. If you insert your card, the system asks for a PIN. If you enter the wrong PIN three times, the machine eats your card. The ATM is moving through different states (Waiting -> PIN Entry -> Locked).
To test systems like this, we use State Transition Testing. Let’s break down how it works, the visual models we use, and how to calculate our test coverage!

Diagrams vs. Tables
To figure out how to test a state-based system, we first have to model its behavior. We can do this in two ways:
- State Transition Diagrams
A state transition diagram models the behavior of a system by visually showing its possible states and valid state transitions. Think of it as a map of circles (states) connected by arrows (transitions).
Transitions don’t just happen on their own; they follow a specific syntax: event [guard condition] / action
- Event: What initiates the transition (e.g., clicking “Checkout”).
- Guard Condition: A true/false rule that must be met (e.g.,
[Cart total > $0]). - Action: What the software does as a result (e.g.,
/ Redirect to payment page).
Note: Guard conditions and actions can be omitted from the diagram if they don’t exist or aren’t relevant to the tester.
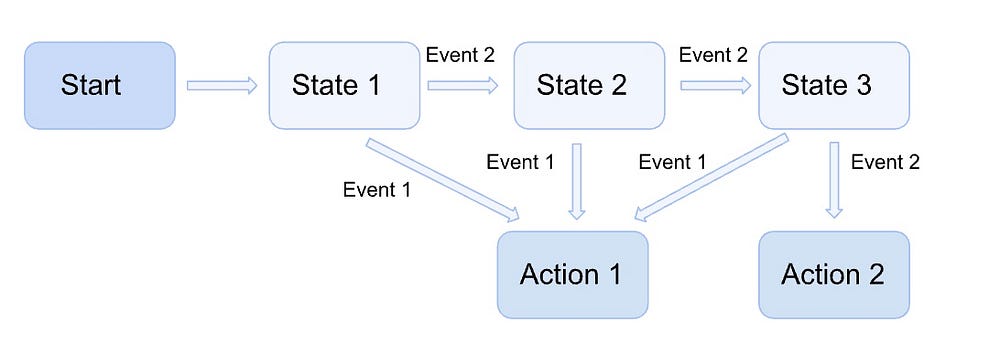
Example for a State Transition Diagram
2. State Tables
A state table is a grid model equivalent to a state transition diagram.
- Rows represent the states.
- Columns represent the events (and guard conditions).
- Cells represent the actual transitions (showing the target state and the resulting action).

Example for a State Transition Table
Why use a table? While a diagram is easy to read, a state table explicitly shows invalid transitions by leaving those specific cells empty!
How to Calculate Coverage
A single test case is just a sequence of events that results in a sequence of state changes. One test case will usually cover several transitions.
But how do we know when we are done testing? The ISTQB syllabus outlines three main coverage criteria:
1. All States Coverage (The Weakest)
- The Goal: Test cases must ensure that all the states are visited.
- The Math: Number of visited states divided by the total number of states.
- This is the weakest coverage because you can usually visit every state without exercising all the different pathways (transitions) between them.
2. Valid Transitions Coverage (The Standard)
- The Goal: Also known as “0-switch coverage”, test cases must exercise all the valid transitions (the arrows). This is the most widely used coverage criterion!
- The Math: Number of exercised valid transitions divided by the total number of valid transitions.
Note: Achieving 100% valid transitions coverage automatically guarantees 100% all states coverage.
3. All Transitions Coverage (The Strongest)
- The Goal: Test cases must exercise all valid transitions AND attempt to execute all invalid transitions.
- The Rule: You must test only one invalid transition per test case. If you try to test multiple errors at once, you risk “fault masking,” where one defect prevents the detection of another.
- The Math: Number of valid and invalid transitions exercised/attempted, divided by the total number of valid and invalid transitions.
- This is a minimum requirement for mission and safety-critical software.
Solving Real ISTQB State Transition Questions!
Let’s put this theory into practice by solving three real ISTQB exam questions.
Scenario 1: The System Lifecycle Diagram

The Goal: What is the minimal number of test cases to achieve valid transitions coverage?
The Solution:
Look at the diagram. We start at INIT and must end at OFF. From INIT, we can either go down the “test” path or the “run” path. The “test” and “error” transitions cannot occur in a single test case because they branch off differently and don’t loop back to each other. Similarly, there are two different “done” transitions that lead to the OFF state, which also cannot be covered in a single run. Because of these diverging paths, we need at least three separate test cases to walk down every arrow.
- TC1: test, done.
- TC2: run, error, done.
- TC3: run, pause, resume, pause, done.
The Answer: Option D (3).
Scenario 2: The Storage System (Guard Conditions)

The Goal: Which test case achieves the highest level of valid transitions coverage?
The Solution:
Let’s trace Option C: Add, Add, Add, Remove, Remove.
Start -> Add (N:=1). We are now in NOT FULL. (Transition 1 covered).
Add again. N<2 is true (N is 1), so we loop back to "NOT FULL". (N becomes 2). (Transition 2 covered).
Add again. N=2 is true, so we move to FULL (N becomes 3). (Transition 3 covered).
Remove. We move back to NOT FULL (N becomes 2). (Transition 4 covered). Remove again. N>0 is true, so we loop on "NOT FULL" (N becomes 1). (Transition 5 covered).
Option C covers 5 out of 5 valid transitions, achieving 100% coverage! (Note: Option B is a trick. After 3 Adds, the system is FULL. You cannot "Add" again from the FULL state, making Option B an infeasible test case).
The Answer: Option C.
Scenario 3: The Hotel Room State Table

The Goal: Assuming all test cases start in the ‘Requesting’ state, which sequence achieves the highest valid transitions coverage?
The Solution:
Let’s trace Option B: Available, ChangeRoom, NotAvailable, Available, Pay.
Start at S1 (Requesting). Event “Available” moves us to S2. (1 transition covered).
At S2 (Confirmed). Event “ChangeRoom” moves us to S1. (2 transitions covered).
At S1. Event “NotAvailable” moves us to S3. (3 transitions covered).
At S3 (Waiting list). Event “Available” moves us to S2. (4 transitions covered).
At S2. Event “Pay” moves us to S4. (5 transitions covered).
Option B covers 5 different transitions out of the 7 total available valid transitions, achieving the highest coverage of all the choices.
The Answer: Option B.
Scenario 4: The Hotel Reservation Diagram (100% Valid Transitions)

The Goal: What is the MINIMAL number of test cases required to achieve 100% valid transitions coverage?
The Solution:
Remember, “100% valid transitions coverage” simply means we need to walk down every single arrow in this diagram at least once.
The trick to finding the minimum number of test cases is to look for “forks in the road” where a state splits into multiple directions. You can only pick one path per test case!
From the REQUESTING state, the path splits in two: you can go to CONFIRMED or WAITING LIST.
From the WAITING LIST state, the path splits again: you can go to CONFIRMED or END.
Because of these diverging paths, the specific transitions of
REQUESTING➡CONFIRMED, WAITING LIST➡CONFIRMED, and WAITING LIST➡END cannot possibly appear in the same test case.
Therefore, we need a minimum of three distinct sequences to hit every arrow:
- TC1: START (Room request) ➡REQUESTING (Available) ➡ CONFIRMED (Pay) ➡ END
- TC2: START (Room request) ➡ REQUESTING (Not available) ➡ WAITING LIST (Available) ➡ CONFIRMED (Pay) ➡ END
- TC3: START (Room request) ➡ REQUESTING (Not available) ➡ WAITING LIST (Cancel) ➡ END
The Answer: Option A (3).
That wraps up Day 12! State Transition Testing is a fantastic way to visually map out user journeys and ensure no pathways are left untested.
Stay tuned for my next article, where we will learn about white box testing!
메타데이터
- post_id
- 25c3f1facb86
- slug
- day-12-of-learning-testing-state-transition-testing-25c3f1facb86
- url
- https://medium.com/@nostochk/day-12-of-learning-testing-state-transition-testing-25c3f1facb86
- canonical_url
- https://medium.com/@nostochk/day-12-of-learning-testing-state-transition-testing-25c3f1facb86
- author_url
- https://medium.com/@nostochk
- status
- ok
- fetched_at
- 2026-06-24 04:09:36





