2026 US EB1/EB2 Green Card Quota Analysis | Quota Calculation for Chinese EB1A/NIW Applicants
I. Background of the 2026 Fiscal Year U.S. Employment-Based Immigration Quota Expansion
2026 US EB1/EB2 Green Card Quota Analysis | Quota Calculation for Chinese EB1A/NIW Applicants
I. Background of the 2026 Fiscal Year U.S. Employment-Based Immigration Quota Expansion
According to the official 2026 Fiscal Year (October 1, 2025 — September 30, 2026) immigration quota guidelines released by the U.S. Department of State, the overall quota for U.S. employment-based immigration has achieved a substantial expansion, hitting a new high in policy relaxation in recent years.
- Basic Quota and Expansion Scale: The statutory basic quota for employment-based immigration is140,000. In FY2026, the quota is expanded to 186,000, with an increase of 46,000 additional slots.
- Source of Expanded Quotas: All newly added slots are unused residual quotas from family-based immigration in FY2025, which are transferred to the employment-based immigration category through the statutory carryover and spillover adjustment mechanisms of U.S. immigration rules.
- Core Impact: Effectively alleviates the long-standing shortage of immigration slots and stagnant priority date progression in recent years.
II. Global Quota Allocation Standards for All U.S. Employment-Based Immigration Categories in FY2026
The 2026 fiscal year adopts a clear and standardized quota allocation scheme for the five major employment-based immigration categories. The three mainstream categories including EB1, EB2 and EB3 enjoy equal quota volume, thoroughly solving the problem of uneven quota distribution in previous years. The detailed global quota breakdown is as follows:
- EB1 (Immigration for Aliens of Extraordinary Ability): Allocated at a fixed statutory ratio of 28.6%, with a global total quota of 53,196.
- EB2 (Immigration for Advanced Degree Professionals): Global total quota of 53,196, consistent with the quota volume of EB1.
- EB3 (Immigration for Skilled/Professional Workers): Global total quota of 53,196, realizing equal quota distribution among the three mainstream categories.
- EB4 (Special Immigrant Immigration): Global total quota of 13,206.
- EB5 (Investor Immigration): Global total quota of 13,206, identical to EB4 quota volume.
Important Note: The above figures refer to the total global quotas. Applicants from individual countries cannot fully access the global quota volume. All national applicants must follow the U.S. immigration’s statutory 7% per-country quota limit rule to calculate exclusive basic national quotas.
III. Accurate Calculation of Country-Specific Quotas for Chinese Mainland Employment-Based Immigration in FY2026
U.S. immigration law clearly stipulates that the annual approved immigration quota for a single country shall not exceed 7% of the global quota corresponding to each immigration category, which serves as the sole calculation criterion for exclusive quotas for Chinese mainland applicants. Based on the global quota data of all categories in FY2026, the basic country-specific quotas for Chinese mainland are listed below:
- Chinese Mainland EB1 Country Quota: 53,196 × 7% ≈ 3,724 slots.
- Chinese Mainland EB2 Country Quota: 53,196 × 7% ≈ 3,724 slots.
- Chinese Mainland EB3 Country Quota: 53,196 × 7% ≈ 3,724 slots.
- Chinese Mainland EB5 Country Quota: 13,206 × 7% ≈ 924 slots.
IV. Sub-Quota Calculation for the Three Subcategories of Chinese Mainland EB1
The EB1 category consists of three subcategories: EB1A, EB1B and EB1C. All subcategories adopt unified quota scheduling without independent separate quotas or adjudication priority differences. Based on the long-term stable approval data released by USCIS, the application structure of Chinese mainland EB1 applicants has maintained a stable proportion with negligible fluctuations. The subcategory quotas are calculated based on the official Chinese mainland EB1 country quota of 3,724 slots.
1. Stable Industry Quota Proportion Standards
- EB1A Aliens of Extraordinary Ability: 60%-65%.
- EB1B Outstanding Professors and Researchers: 10%-15%.
- EB1C Multinational Corporate Executives and Managers: 20%-25%.
2. Sub-Quota Range of EB1 Subcategories in FY2026
- EB1A Quota: Approximately2,234–2,421 slots.
- EB1B Quota: Approximately 372–559 slots.
- EB1C Quota: Approximately 745–931 slots.
Supplementary Explanation: The above data are the minimum basic quotas under the 7% per-country limit, excluding additional adjustable quotas from global quota spillover. Therefore, the actual approved slots of each EB1 subcategory in FY2026 will be slightly higher than the calculated range.
V. Quota Calculation for Regular PERM and NIW under Chinese Mainland EB2 in FY2026
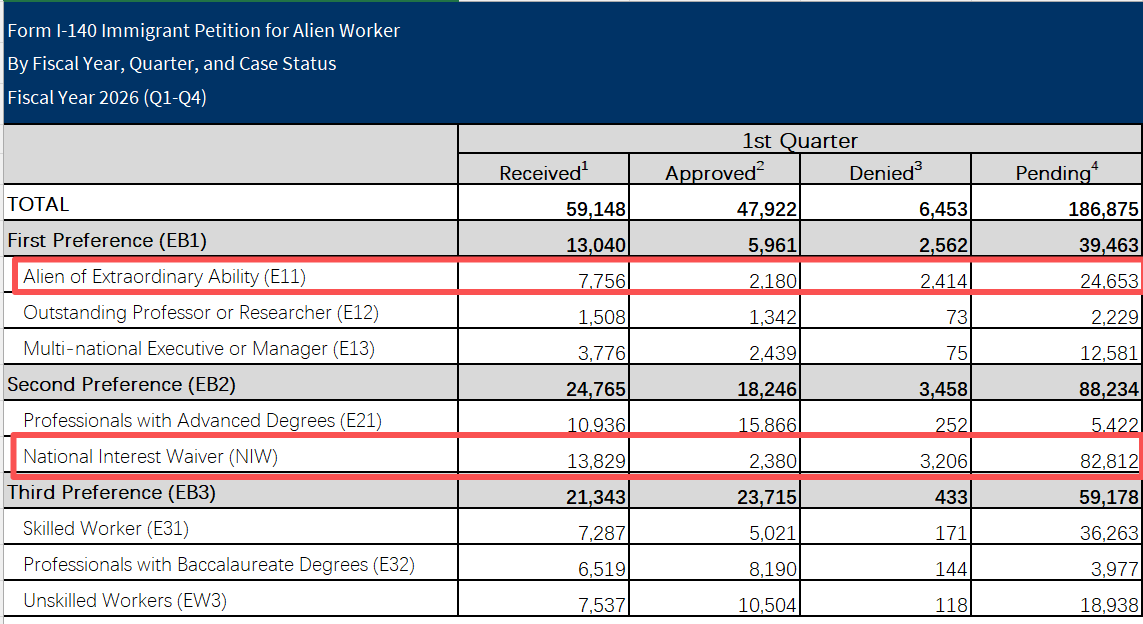
The EB2 advanced degree professional immigration category includes two mainstream application tracks:conventional PERM employer-sponsored EB2 and National Interest Waiver (NIW). The two tracks share the total EB2 country quota without independent separate quotas and enjoy the same adjudication priority. Based on the official approval data of USCIS from FY2022 to FY2025, the internal proportion of Chinese applicant sources for EB2 remains stable, enabling accurate calculation of the sub-quota volume for FY2026.
1. Long-Term Stable Proportion Rules of EB2 Subcategories
Benefiting from the advantages of no employer sponsorship requirement, no labor certification and flexible application procedures, NIW has witnessed a continuous surge in application volume. The long-term stable approval proportion in the industry is as follows: NIW accounts for 45% of total EB2 approvals, and conventional PERM employer-sponsored EB2 accounts for 55%. This proportion is the average value of official statistical data for consecutive years with minor fluctuations, which boasts high reference value.
2. Sub-Quota Calculation for Chinese Mainland EB2 in FY2026
Calculated based on the official annual basic country quota of 3,724 slots for Chinese mainland EB2:
- Conventional PERM Employer-Sponsored EB2 Quota: 3,724 × 55% ≈ 2,048 slots.
- NIW National Interest Waiver Quota: 3,724 × 45% ≈ 1,676 slots.
Supplementary Explanation: The above figures are the basic minimum quotas under the 7% per-country limit, excluding global spillover adjustable quotas. Affected by the idle quota spillover from low-demand countries worldwide, the actual approved slots of conventional EB2 PERM and NIW for Chinese mainland applicants in FY2026 will be slightly higher than the calculated values. Meanwhile, the growing backlog of NIW applications in recent years has made NIW quota competition increasingly fiercer than conventional employer-sponsored EB2 programs.
VI. Calculation of Bearable Principal Applicant Volume for EB1 and EB2 Based on Family Structure
1. Core Statistical Rules of Immigration Quotas
The statistical standard for U.S. green card quotas is clear: principal applicants, spouses and minor dependent children will each occupy an independent quota slot, rather than only counting principal applicants. This rule is the core basis for calculating the actual annual bearable number of applicants.
2. Standard Calculation Model (Mainstream Chinese Family Structure)
The industry universally adopts the standard model of a three-person family (principal applicant + spouse + one minor child), which means a single family occupies 3 quota slots. Based on this model and the subcategory quotas above, the bearable number of principal applicants for each track is calculated as follows:
- Bearable Principal Applicants for EB1A: Approximately 745–807 people.
- Bearable Principal Applicants for EB1B: Approximately 124–186 people.
- Bearable Principal Applicants for EB1C: Approximately 248–310 people.
- Bearable Principal Applicants for Conventional EB2 PERM: Approximately 683 people.
- Bearable Principal Applicants for EB2 NIW: Approximately 559 people.
3. Dynamic Fluctuation Influencing Factors
- If the proportion of single applicants and childless couples rises in the fiscal year, the overall bearable number of applicants will increase.
- If the proportion of multi-child families rises in the fiscal year, the overall bearable number of applicants will decrease correspondingly.
VII. Application Suggestions for the 2026 Fiscal Year EB1 Immigration Window
FY2026 presents a rare golden opportunity for U.S. employment-based immigration, driven by dual advantages of quota expansion and priority date advancement. Professional application recommendations from Law Offices of Brian Jiang are as follows:
- Seize Phased Policy Dividends: The large-scale quota expansion is a temporary carryover policy rather than a long-term fixed rule. In the long run, future fiscal years are likely to revert to the 140,000 basic quota with policy tightening.
- Lock Priority Dates in Advance: Prepare and submit application materials as early as possible to lock the official priority date. The locked priority date will remain valid even if quotas shrink and priority date progression slows down in the future.
- Prioritize the EB1A Application Track: EB1A has no restrictions on employer sponsorship, industry and academic background, with the largest quota volume, making it the optimal choice for Chinese mainland applicants.
For further details and inquiries, please visit the firm’s official website: https://www.usaym.com.cn/
메타데이터
- post_id
- 26e2ce7ab244
- slug
- 2026-us-eb1-eb2-green-card-quota-analysis-quota-calculation-for-chinese-eb1a-niw-applicants-26e2ce7ab244
- url
- https://medium.com/@USA_EB1/2026-us-eb1-eb2-green-card-quota-analysis-quota-calculation-for-chinese-eb1a-niw-applicants-26e2ce7ab244
- canonical_url
- https://medium.com/@USA_EB1/2026-us-eb1-eb2-green-card-quota-analysis-quota-calculation-for-chinese-eb1a-niw-applicants-26e2ce7ab244
- author_url
- https://medium.com/@USA_EB1
- status
- ok
- fetched_at
- 2026-06-10 22:59:55