Technical Analysis Checklist Before Entering Any Trade
Introduction
Technical Analysis Checklist Before Entering Any Trade
Introduction
Every successful trader understands that preparation is often more important than execution. While many market participants spend significant time searching for the next big opportunity, experienced traders focus on developing a repeatable process before risking capital. One of the most effective ways to improve trading consistency is by following a Technical Analysis Checklist Before Entering Any Trade.
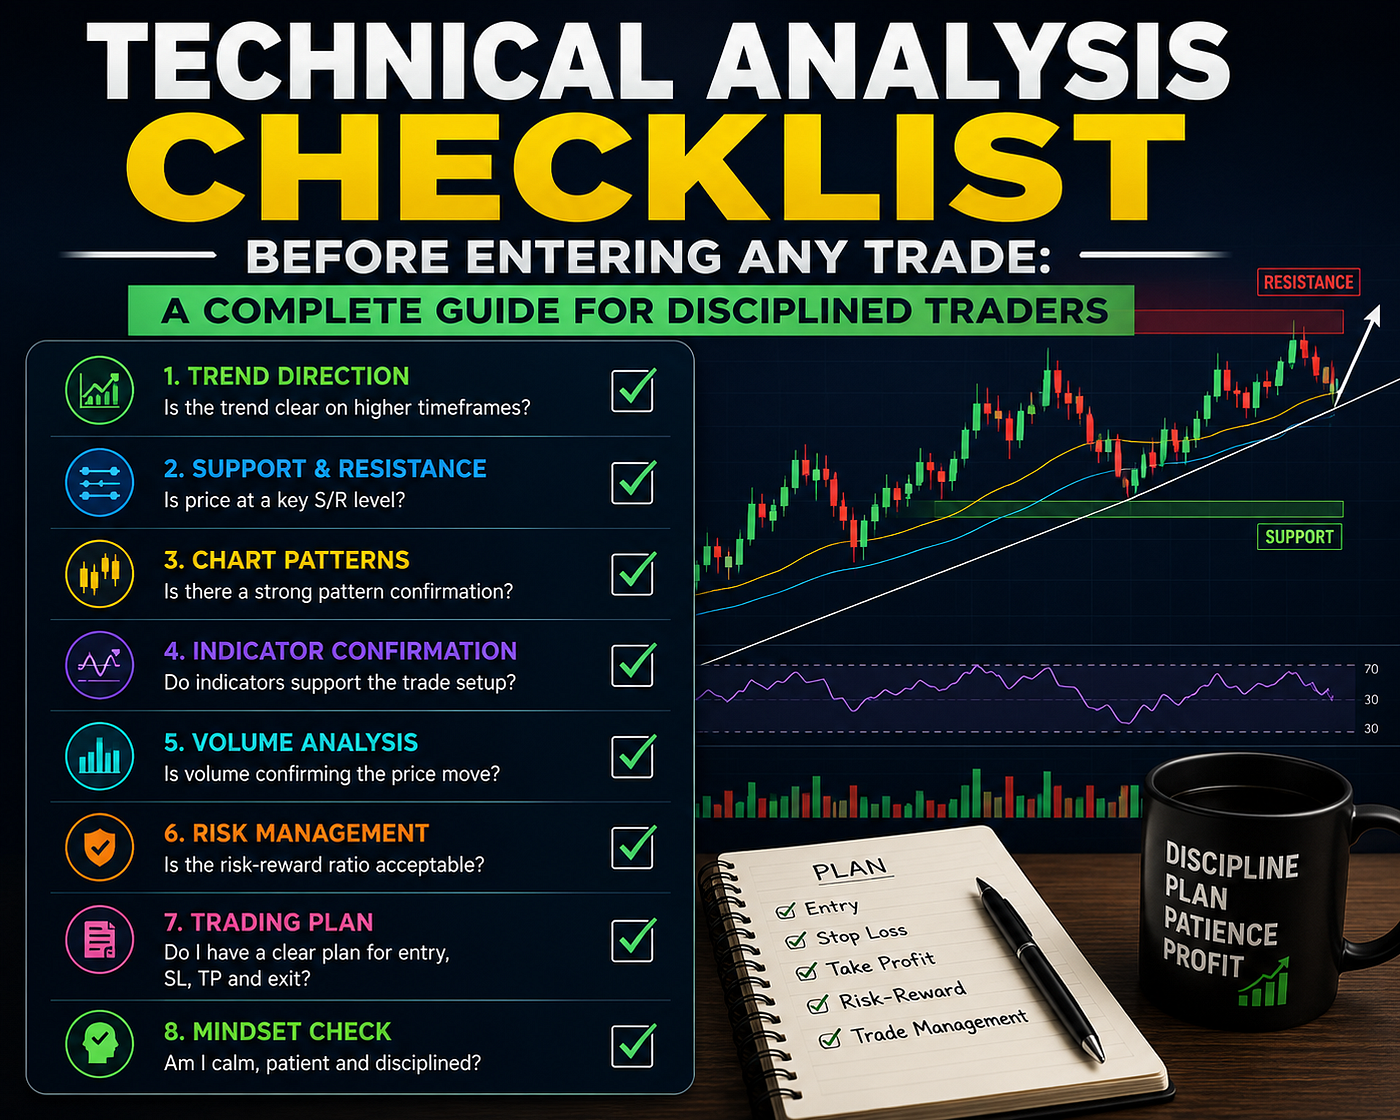
Technical Analysis Checklist Before Entering Any Trade
Financial markets can be unpredictable. Emotions such as fear, greed, excitement, and impatience often influence trading decisions. Without a structured approach, traders may enter positions based on rumors, market noise, or impulsive reactions. A well-defined technical analysis checklist helps eliminate emotional decision-making and ensures that every trade is evaluated using objective criteria.
Whether trading stocks, forex, commodities, cryptocurrencies, or indices, technical analysis provides a framework for identifying trends, assessing momentum, evaluating risk, and finding high-probability opportunities. However, using technical indicators alone is not enough. Traders need a systematic process that combines multiple factors before executing a trade.
This comprehensive guide explores the essential Technical Analysis Checklist Before Entering Any Trade. It explains how professional traders evaluate market conditions, analyze trends, confirm setups, manage risk, and improve decision-making through a disciplined approach.
Why Every Trader Needs a Technical Analysis Checklist
Many trading losses occur because traders enter positions without sufficient preparation.
A checklist creates consistency and helps traders avoid common mistakes.
Benefits of using a technical analysis checklist include:
- Improved discipline
- Reduced emotional trading
- Better risk management
- Higher-quality trade selection
- Greater consistency over time
Professional pilots use pre-flight checklists before takeoff. Surgeons use checklists before operations. Similarly, traders benefit from having a structured process before entering the market.
Understanding the Purpose of Technical Analysis
Technical analysis involves studying price action, volume, chart patterns, and indicators to evaluate future market direction.
The primary goals of technical analysis are:
Identifying Trends
Markets tend to move in trends. Recognizing trend direction is crucial before entering a trade.
Measuring Momentum
Momentum indicators help determine whether buyers or sellers control the market.
Finding Key Levels
Support and resistance zones often influence future price movement.
Managing Risk
Technical analysis helps traders identify logical stop-loss and target locations.
These objectives form the foundation of any effective trading checklist.
Step 1: Evaluate the Overall Market Trend
The first item on every Technical Analysis Checklist Before Entering Any Trade should be market trend analysis.
The broader market often influences individual securities.
Uptrend Characteristics
- Higher highs
- Higher lows
- Price above major moving averages
Downtrend Characteristics
- Lower highs
- Lower lows
- Price below major moving averages
Sideways Markets
Range-bound markets require different trading strategies than trending environments.
Understanding overall market direction helps traders align trades with prevailing momentum.
Step 2: Identify Key Support and Resistance Levels
Support and resistance are among the most important concepts in technical analysis.
Support
Support represents a price zone where buying pressure previously emerged.
Resistance
Resistance represents an area where selling pressure historically appeared.
Before entering a trade, traders should determine:
- Nearby support levels
- Nearby resistance levels
- Potential breakout zones
- Areas of historical price reaction
Ignoring support and resistance can lead to poor entries and unfavorable risk-reward ratios.
Step 3: Confirm Trend Strength with Moving Averages
Moving averages help traders evaluate trend quality.
Popular moving averages include:
- 20-day moving average
- 50-day moving average
- 100-day moving average
- 200-day moving average
A strong bullish setup often includes:
- Price above the 50-day moving average
- Rising moving averages
- Positive alignment between shorter and longer averages
Moving averages provide an objective measure of trend direction.
Step 4: Analyze Volume Activity
Volume confirms price action.
Strong volume often indicates genuine buying or selling interest.
Questions traders should ask include:
- Is volume increasing?
- Does volume confirm the breakout?
- Is institutional participation likely?
A breakout without volume support often has a higher probability of failure.
Volume analysis helps separate high-quality setups from weak signals.
Step 5: Examine Market Structure
Market structure reveals the relationship between buyers and sellers.
Important factors include:
Higher Highs and Higher Lows
Bullish market structure supports long positions.
Lower Highs and Lower Lows
Bearish market structure favors short positions.
Consolidation Zones
Periods of consolidation often precede major market moves.
Market structure provides context for all technical indicators.
Step 6: Check Relative Strength
Relative strength measures how well an asset performs compared to the broader market.
Strong relative strength often indicates institutional accumulation.
When evaluating a trade, consider:
- Is the asset outperforming its sector?
- Is it outperforming the broader market?
- Does momentum support continued strength?
Many market leaders display strong relative strength before significant advances.
Step 7: Look for High-Probability Chart Patterns
Chart patterns help traders identify potential opportunities.
Some of the most reliable patterns include:
Cup and Handle
A bullish continuation pattern that often precedes breakouts.
Ascending Triangle
Indicates increasing buying pressure.
Bull Flag
Represents temporary consolidation within an uptrend.
Double Bottom
Signals a potential reversal from bearish to bullish conditions.
Head and Shoulders
Often indicates a trend reversal.
Chart patterns should complement broader market analysis rather than replace it.
Step 8: Evaluate RSI for Momentum Confirmation
The Relative Strength Index (RSI) measures momentum.
Typical RSI interpretations include:
- Above 70: Overbought
- Below 30: Oversold
However, context matters.
Strong trends can remain overbought or oversold for extended periods.
Before entering a trade, ask:
- Does RSI support the trend?
- Is divergence present?
- Is momentum strengthening or weakening?
RSI adds another layer of confirmation.
Step 9: Confirm with MACD
The Moving Average Convergence Divergence (MACD) indicator helps evaluate momentum and trend strength.
Traders often monitor:
- MACD crossovers
- Signal line interaction
- Histogram expansion
- Divergence
MACD confirmation can improve confidence in a trading setup.
Combining MACD with trend analysis often produces stronger signals.
Step 10: Assess Volatility Conditions
Volatility influences both opportunity and risk.
Questions to consider include:
- Is volatility increasing?
- Is volatility decreasing?
- Does current volatility suit the trading strategy?
Indicators such as Average True Range (ATR) can help evaluate market conditions.
Understanding volatility helps traders position size appropriately.
Step 11: Verify Risk-to-Reward Ratio
One of the most overlooked items on a Technical Analysis Checklist Before Entering Any Trade is risk-to-reward evaluation.
Before entering a position, traders should determine:
- Entry price
- Stop-loss level
- Profit target
A favorable risk-to-reward ratio often exceeds 1:2.
This means potential reward should be at least twice the amount risked.
Even successful traders experience losses. Positive risk-to-reward ratios help maintain profitability over time.
Step 12: Determine Stop-Loss Placement
Every trade requires a predefined exit plan.
Stop-loss placement should be based on technical factors rather than arbitrary percentages.
Logical stop-loss locations include:
- Below support
- Above resistance
- Beneath trend lines
- Below chart pattern structures
Proper stop placement protects capital and reduces emotional decision-making.
Step 13: Check Multiple Time Frames
Multi-time-frame analysis improves decision-making.
For example:
- Weekly charts reveal major trends.
- Daily charts identify setups.
- Intraday charts refine entries.
When multiple time frames align, trading opportunities often become more compelling.
Conflicting signals across time frames may indicate caution.
Step 14: Review Sector Strength
Strong sectors often produce strong trading opportunities.
Before entering a trade, evaluate:
- Sector performance
- Industry momentum
- Institutional interest
A stock moving higher within a strong sector typically has a greater probability of success.
Sector analysis provides valuable context.
Step 15: Monitor Upcoming News and Events
Although technical analysis focuses on price behavior, traders should remain aware of major events.
Potential market-moving catalysts include:
- Earnings reports
- Economic releases
- Central bank decisions
- Regulatory announcements
Unexpected events can disrupt even the strongest technical setup.
Awareness improves risk management.
Common Mistakes Traders Make
Many traders ignore their checklist when excitement increases.
Common errors include:
Chasing Breakouts
Entering after extended price movement often increases risk.
Ignoring Volume
Breakouts without volume frequently fail.
Overtrading
Taking too many trades reduces selectivity.
Skipping Risk Analysis
Even excellent setups can fail.
Maintaining discipline remains critical.
Using Technology to Improve Trade Evaluation
Modern trading platforms provide sophisticated analytical tools.
These include:
- Real-time screening
- Automated alerts
- Pattern recognition
- Relative strength analysis
- Multi-time-frame charting
Technology helps traders evaluate opportunities more efficiently.
However, discipline remains more important than software.
The Growing Role of Artificial Intelligence in Technical Analysis
Artificial intelligence is transforming market analysis.
AI systems can:
- Scan thousands of securities
- Detect chart patterns
- Evaluate momentum
- Analyze historical performance
Machine learning models continuously refine their analysis based on new data.
While AI enhances efficiency, human judgment remains essential for interpreting market conditions.
Creating Your Personal Trading Checklist
Every trader should customize their checklist.
A typical checklist may include:
- Trend confirmation
- Support and resistance analysis
- Volume validation
- RSI confirmation
- MACD confirmation
- Risk-to-reward assessment
- Stop-loss placement
- Sector strength review
- Event awareness
Customization helps align the checklist with individual trading goals.
Conclusion
Following a Technical Analysis Checklist Before Entering Any Trade can significantly improve trading consistency, discipline, and long-term performance. Instead of relying on emotions or market noise, traders can use a structured process to evaluate opportunities objectively. Trend analysis, support and resistance, volume confirmation, momentum indicators, chart patterns, risk management, and market context all play essential roles in identifying high-quality setups.
No checklist can eliminate losses entirely, but a disciplined approach helps traders avoid many common mistakes and focus on opportunities with favorable probabilities. Over time, consistency in preparation often leads to consistency in results.
메타데이터
- post_id
- 28e0f11bb072
- slug
- technical-analysis-checklist-before-entering-any-trade-28e0f11bb072
- url
- https://medium.com/@astroduinaaai/technical-analysis-checklist-before-entering-any-trade-28e0f11bb072
- canonical_url
- https://medium.com/@astroduinaaai/technical-analysis-checklist-before-entering-any-trade-28e0f11bb072
- author_url
- https://medium.com/@astroduinaaai
- status
- ok
- fetched_at
- 2026-08-06 06:05:27


