From Data Product to Strategic Impact — Why Open Data Product Graphs (ODPG) Matter
In most organizations, we measure what we can find, not what truly matters. Catalogs list assets, lineage shows flow, and dashboards show…
From Data Product to Strategic Impact — Why Open Data Product Graphs (ODPG) Matter
In most organizations, we measure what we can find, not what truly matters. Catalogs list assets, lineage shows flow, and dashboards show numbers, but none of them explain why an asset exists, who depends on it, or what business outcome it enables.
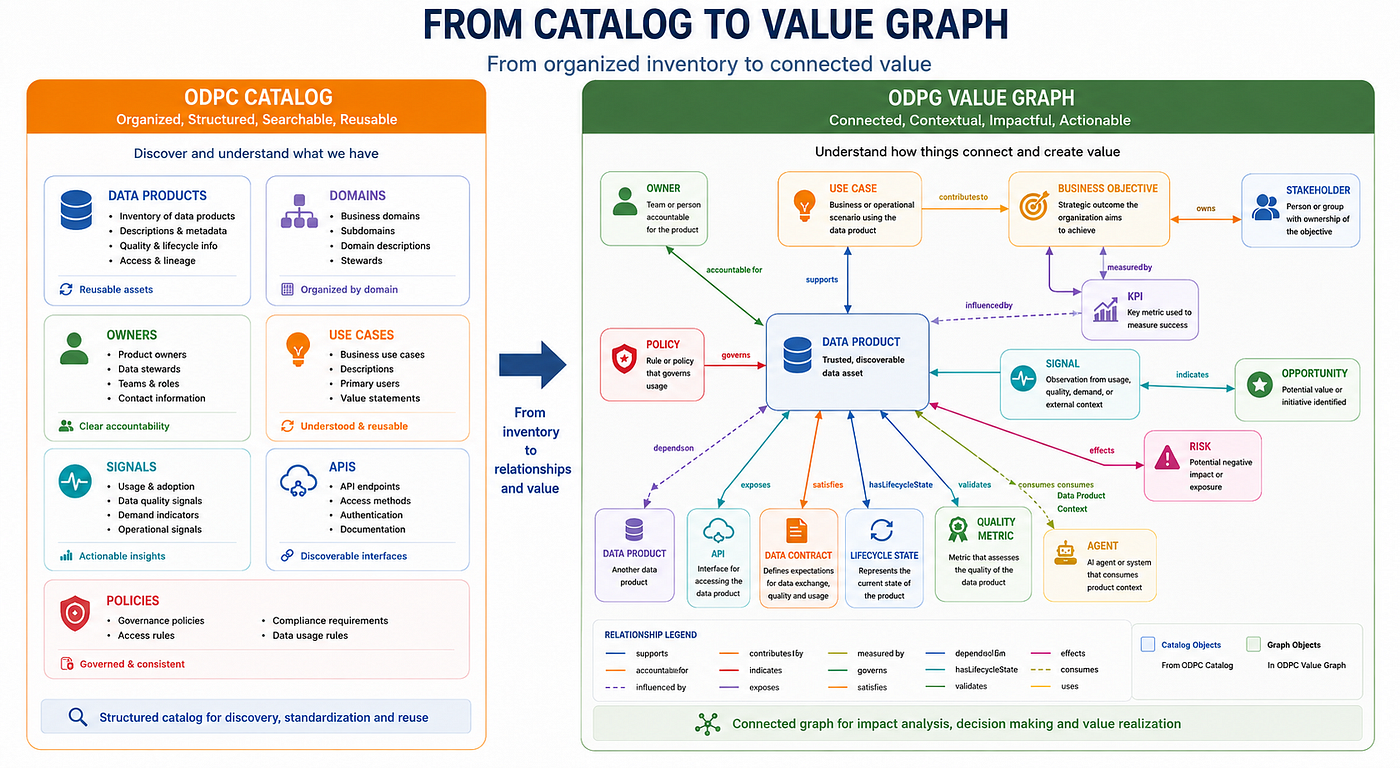
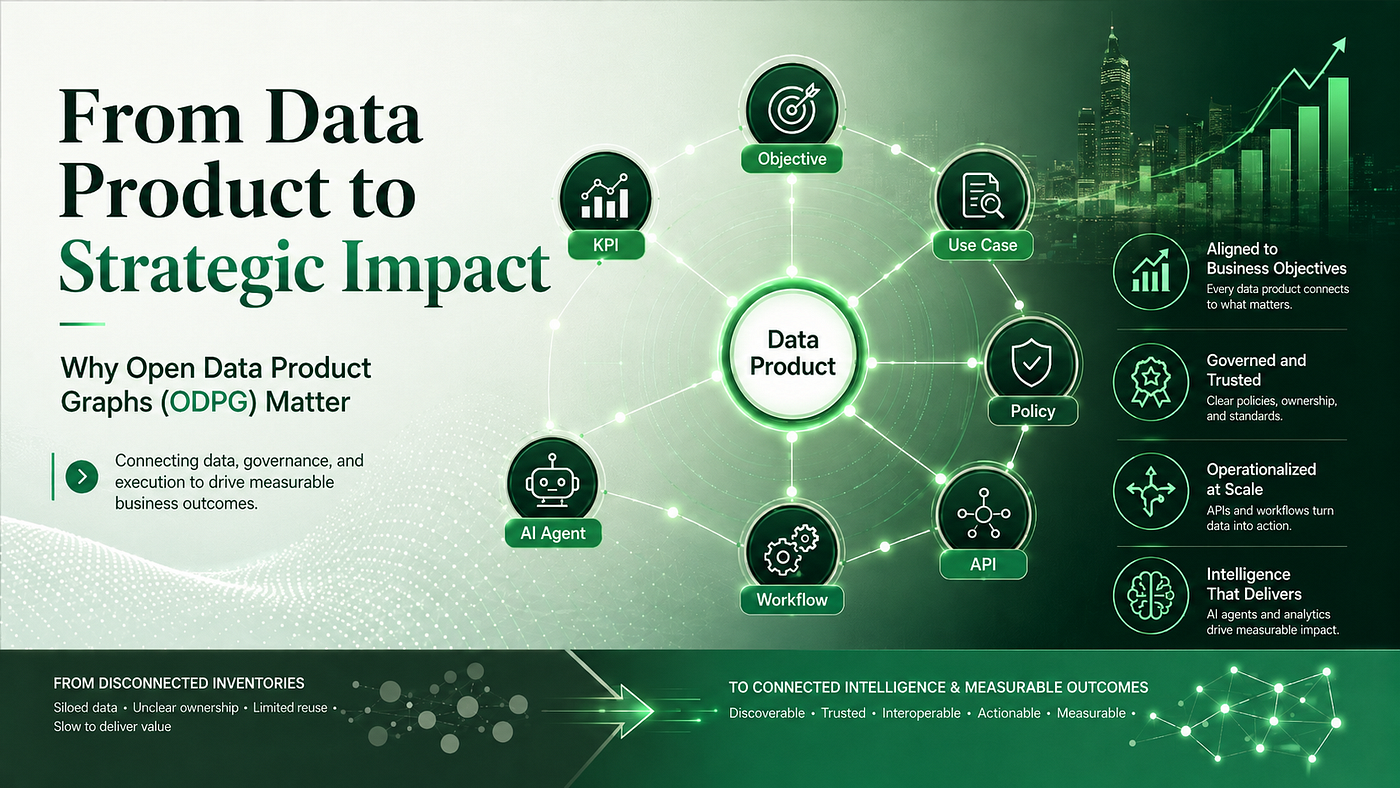
Open Data Product Graphs (ODPG) change that by turning discrete data products, use cases, policies, and KPIs into a connected, machine-readable map of value. This is how organizations move from inventory to intelligence.
Why is the timing right?
Business leaders now demand traceability from technical work to measurable outcomes so they can prioritize investment and quantify risk. Engineering teams need contextual awareness to make safe, efficient changes that won’t break downstream capabilities.
And AI systems, now part of core automation, need trustworthy, governance-aware context to act safely and explainably. ODPG gives all three a shared language and structure, enabling faster decisions and defensible automation.
What ODPG does
- Connects entities such as data products, use cases, business objectives, KPIs, policies, APIs, agents, workflows, and more.
- Encodes relationships: who uses what, what supports which objective, what is governed by which policy, and which KPIs measure outcomes.
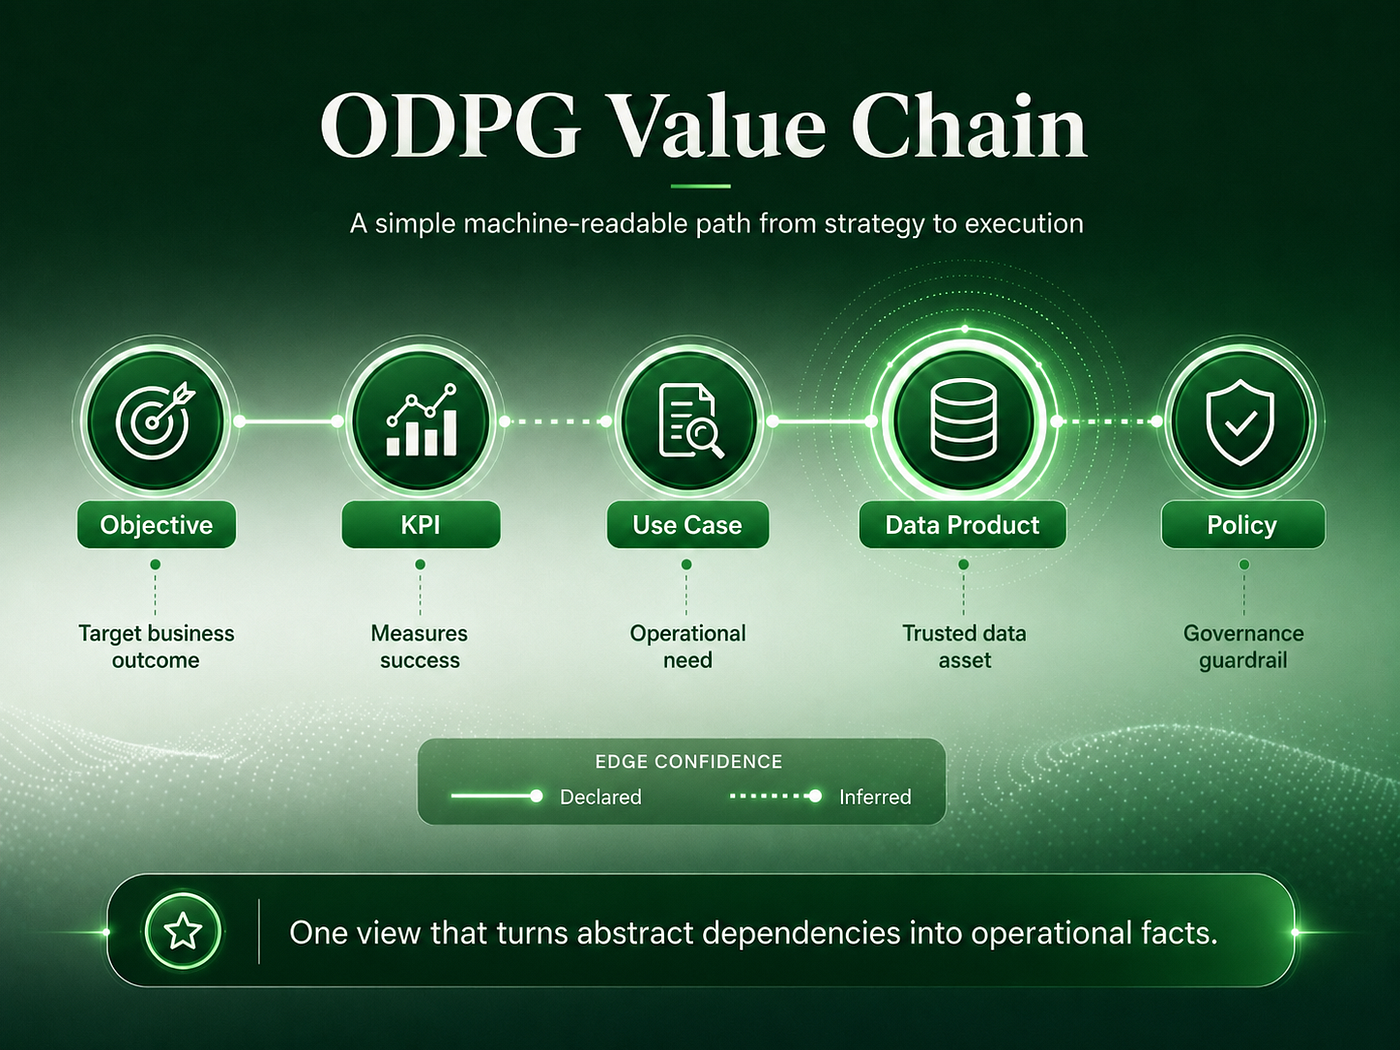
- Surfaces certainty: relationships carry confidence levels (declared vs inferred), enabling prioritized validation and human-in-the-loop review.
A compact example that shows the power
Take Customer360. Alone, it’s a catalog entry; inside an ODPG graph, it’s part of a story:
- Use case “Churn Prediction” → uses → Customer360.
- Churn Prediction → supports → Business Objective “Increase Retention.”
- KPI “Churn Rate” → measures → Increase Retention. With those links established, you can now answer operationally critical questions in seconds: If Customer360 degrades, which objectives and KPIs are impacted? Which policies must an AI agent check before using the data? Who needs to be notified, and what tests must be run before a release?
Three strategic benefits you’ll feel fast
- Portfolio intelligence: ODPG surfaces orphan objectives, duplicate initiatives, and missing governance controls across the portfolio — not within a single catalog or team.
- Governance that travels: Attach policies to nodes and the graph naturally propagates governance impact, enabling dependency-aware compliance and auditability.
- AI-ready context: Agents can traverse the graph to discover relevant data, constraints, and objectives while respecting confidence and governance signals — reducing hallucination risk and improving explainability.
How this changes operating models
- Product managers get evidence-based prioritization tied to measurable outcomes.
- Data engineers operate with clearer SLAs, impact awareness, and fewer surprise escalations.
- Risk and compliance teams get a machine-readable map for audits and policy enforcement.
- AI platforms gain a structured context layer that reduces the risk of unsafe decisions and improves traceability.
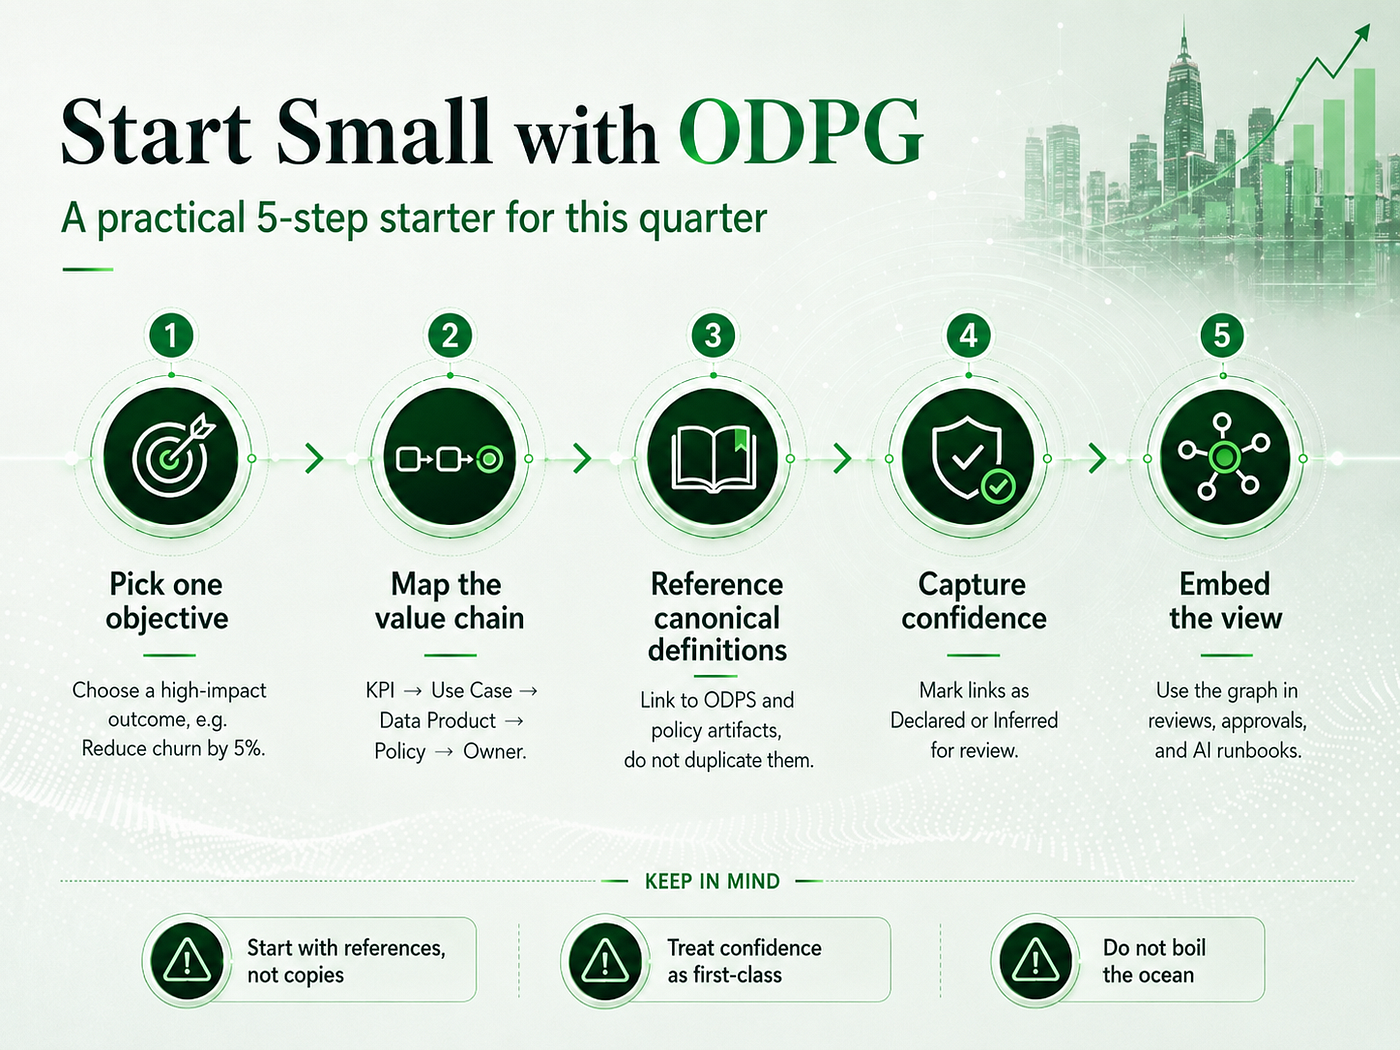
A practical 5-step starter you can do this quarter
- Pick one objective: choose a high-impact objective for the next quarter (e.g., “Reduce churn by 5%”).
- Map its value chain: document KPI → supporting use cases → data products → policies → owners. Keep the graph small: 10–30 nodes to start.
- Reference canonical definitions: don’t duplicate definitions; point nodes at canonical ODPS/ODPV artifacts so the graph stays single-source-of-truth.
- Capture confidence: label relationships as declared or inferred so reviewers can triage which ones need validation.
- Embed the view: make the graph visible in product reviews, change approvals, and AI runbooks so it becomes operational, not archival.
Tactical notes that prevent common traps
- Start with references, not copies: graphs should reference ODPS documents and policy artifacts rather than embedding large amounts of duplicate content. This prevents drift.
- Treat confidence as first-class: inferred links are valuable, but only when surfaced with appropriate confidence and review workflows.
- Don’t boil the ocean: an effective graph is precise, not exhaustive — map the critical value chains first.
- Make the graph actionable: expose the graph to automation (CI checks, change approvals, agent context), not just to documentation browsers.
How ODPG complements existing standards
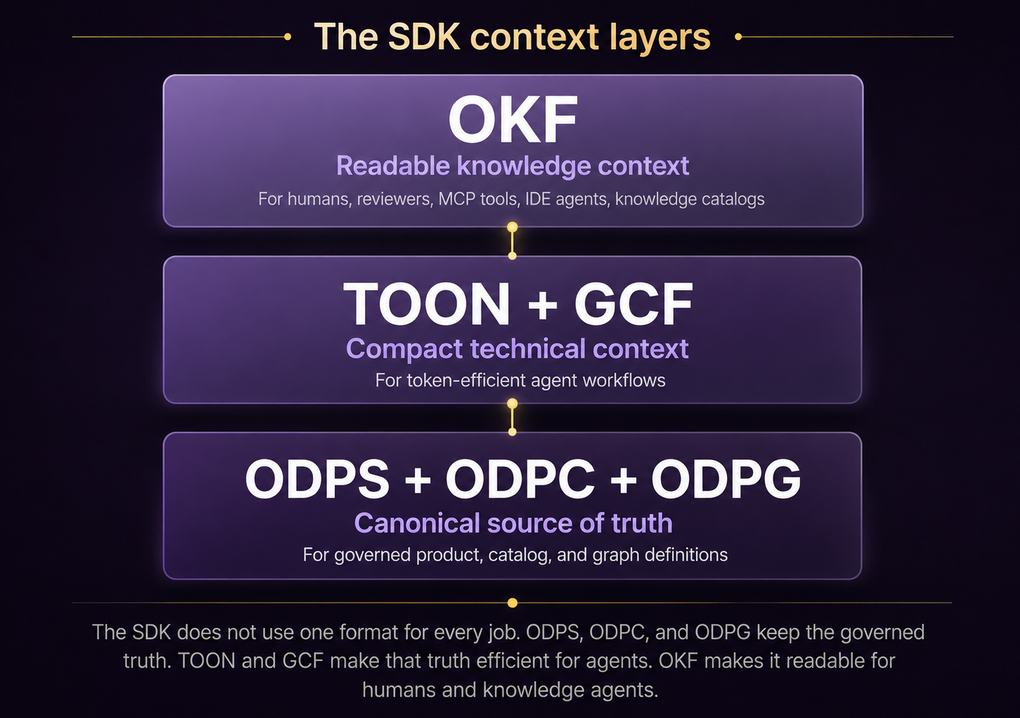
ODPG isn’t a replacement for data product specs or catalogs; it’s the relationship layer. Use ODPS (data product spec) for canonical product definitions, ODPV for shared vocabulary, ODPC for discovery, and ODPG to answer the question: “How do these things create value together?”
When these layers interoperate, teams can reason about impact and strategy using machine-readable artifacts rather than spreadsheets and PowerPoint diagrams.
Real-world signals this is useful
Teams that adopt graph-first thinking report faster incident-impact analysis, improved prioritization decisions, and fewer governance blind spots, because questions that used to require dozens of Slack threads and spreadsheet lookups can be answered with graph traversal and a single authoritative view.
The AI angle
For agentic systems, ODPG provides the structured context agents need for safe actions: which data they may use, which policy checks to perform, which objective they support, and the confidence in those relationships.
That changes agents from “autonomous guessers” into “context-aware assistants” that can explain their rationale and follow governance guardrails.
One-minute visualization idea
A simple visualization everyone understands: draw a horizontal value chain — Objective → KPI → Use Case → Data Product → Policy.
Show arrows for relationships and color edges by confidence. That single view turns abstract dependencies into operational facts.
Final thought
If you’re accountable for outcomes, whether product, AI, or governance — treat ODPG as more than a spec: it’s the connective tissue that turns work into measurable business impact.
Start with one objective, map its value chain into a small graph, and use that view to drive the next prioritization meeting.
Over time, these graphs compound into enterprise-level intelligence that transforms how you plan, govern, and automate.
메타데이터
- post_id
- 28ee58869077
- slug
- from-data-product-to-strategic-impact-why-open-data-product-graphs-odpg-matter-28ee58869077
- url
- https://blog.opendataproducts.org/from-data-product-to-strategic-impact-why-open-data-product-graphs-odpg-matter-28ee58869077
- canonical_url
- https://blog.opendataproducts.org/from-data-product-to-strategic-impact-why-open-data-product-graphs-odpg-matter-28ee58869077
- author_url
- https://medium.com/@zaheraboushakra
- status
- ok
- fetched_at
- 2026-06-20 20:29:01