Improve Queries with Query Execution Plan
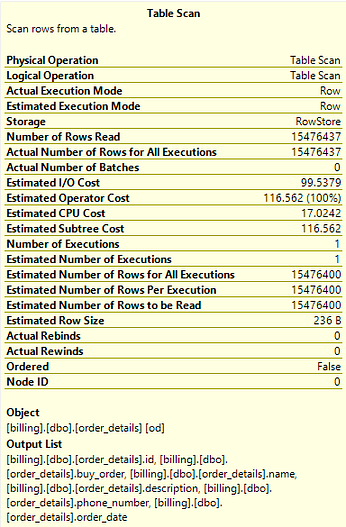
I want to teach you how to read this yellow table above in this article. What means all these numbers and metrics.
Improve Queries with Query Execution Plan
Source: Author
Not a medium member? Read here!
I want to teach you how to read this yellow table above in this article. What means all these numbers and metrics.
To start, I need to provide a lab so you can run the same commands along with me. We will use the table below:
CREATE DATABASE [billing]
GO

USE [billing]
GO

-- Create the table
CREATE TABLE order_details (
    [id] INT NOT NULL IDENTITY(1,1),
    [buy_order] VARCHAR(50),
    [name] VARCHAR(100),
    [description] VARCHAR(255),
    [phone_number] VARCHAR(20),
    [order_date] DATE
)
GO

-- Insert 1,000,000 rows
IF OBJECT_ID('dbo.Numbers') IS NULL
BEGIN
    CREATE TABLE dbo.Numbers (
        Number INT PRIMARY KEY
    );
    ;WITH E1(N) AS (
        SELECT 1 UNION ALL SELECT 1 UNION ALL SELECT 1 UNION ALL
        SELECT 1 UNION ALL SELECT 1 UNION ALL SELECT 1 UNION ALL
        SELECT 1 UNION ALL SELECT 1 UNION ALL SELECT 1 UNION ALL SELECT 1
    ),
    E2(N) AS (SELECT 1 FROM E1 a, E1 b),
    E4(N) AS (SELECT 1 FROM E2 a, E2 b),
    E6(N) AS (SELECT 1 FROM E4 a, E2 b),
    cteTally(N) AS (
        SELECT ROW_NUMBER() OVER (ORDER BY (SELECT NULL)) FROM E6
    )
    INSERT INTO dbo.Numbers(Number)
    SELECT N FROM cteTally;
END;

INSERT INTO order_details (buy_order, name, description, phone_number, order_date)
SELECT
    'BO' + CAST(n.Number AS VARCHAR),
    'Name' + CAST(n.Number AS VARCHAR),
    'Description' + CAST(n.Number AS VARCHAR),
    CAST(1000000000 + n.Number AS VARCHAR),
    DATEADD(day, ABS(CHECKSUM(NEWID())) % 365, '2020-01-01')
FROM dbo.Numbers n
WHERE n.Number <= 1000000; -- Limit to 1,000,000 rows
Copy and run F5, each time you run the last query it will insert 1,000,000 rows, run as many times as you want.
Let’s run the query for the first time?
I’m going to start right away with a SELECT .*
SELECT
 *
FROM [billing]..[order_details] od
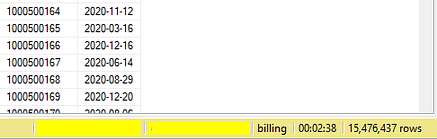
And the result:
Source: Author
Terrifying! Almost 03 minutes to run a query!
Let’s understand why?
Execution Plan and Strategies
The best approach to tuning a query is always starting with its execution plan.
We can visualize it in two ways:
- Ctrl + L: Display only the estimated execution plan
- Ctrl + M: Run the query and display the actual execution plan used
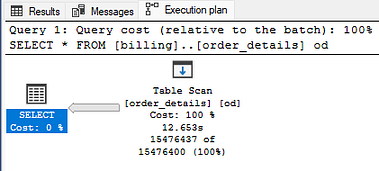
Just select Ctrl + M and run it again, here’s what we have:
Source: Author
The main reason for the query’s delay here is the execution of a Table Scan.
This implies scanning and reading the entire table directly from disk, especially if the table has no indexes defined.
It’s crucial to observe the impact that each element has on the following aspects:
- Estimated I/O Cost
- Estimated Operator Cost
- Estimated CPU Cost
- Estimated Subtree Cost

Source: Author
When these costs are high, it indicates that this is the stage where there is a significant impact on the execution of your query.
- I’ll go into more details as the article progresses.
And if we create a clustered index? Or better yet, a PK?
When we add a PK to a table, a clustered index is automatically created. It’s important to remember that each table can only have one clustered index.
Here’s the syntax for creation:
ALTER TABLE [order_details]
ADD CONSTRAINT [PK_order_details_id] PRIMARY KEY ([id])
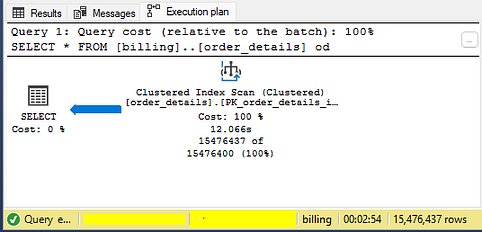
When you run the SELECT *again, you’ll see that the amount of time and the impact are the same.
The difference is that the table uses the clustered index in execution, which also performs a scan:
Source: Author
Why the delay? Well, it’s simple… we’re still *using SELECT .**
How about we try it with just the indexed field?
SELECT
 od.[id]
FROM [billing]..[order_details] od
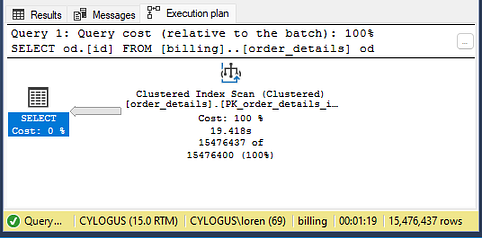
Now the result:
Source: Author
More than 01 minute advantage, my friends!
We’re not only retrieving fewer data, but we’re also retrieving data from an indexed field, which allows us to fetch the data more quickly.
And if we create a non-clustered index? And improve the query?
Ok… I understand that we can’t do anything with the [id], and I acknowledge that the query is still very slow.
So, let’s think about a query that makes sense, we need to think about a filter (WHERE).
We don’t always want the same data, but rather the orders within a period, is that a good idea?
SELECT
 od.[buy_order],
 od.[name],
 od.[description],
 od.[phone_number],
 od.[order_date]
FROM [billing].[dbo].[order_details] od
WHERE od.[order_date] > '2020-10-30' AND od.[order_date] < '2020-11-30'
AND od.[buy_order] IS NOT NULL
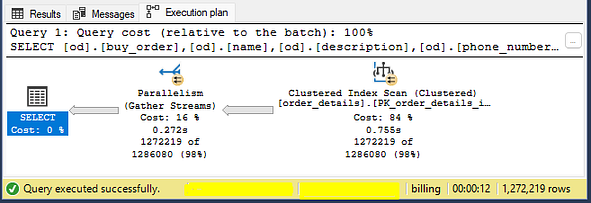
The idea here is to retrieve the orders within a 30-day period that have been received.
And magically, the query is running in 12 seconds:
Source: Author
Is it perfect and can we close here? Actually, no…
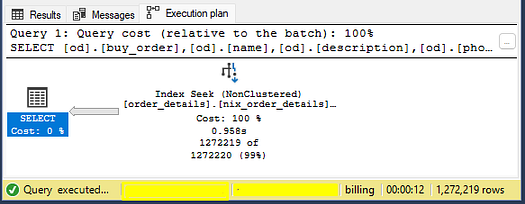
Since our index is scanning the table, it’s costing a lot in terms of resources. Ideally, we should perform a Seek to retrieve this data, avoiding excessive disk reads.
And how to make it perform a Seek? Non-clustered index on them!
Here’s the syntax for the index:
CREATE NONCLUSTERED INDEX [nix_order_details]
ON [billing].[dbo].[order_details] ([order_date], [buy_order])
INCLUDE ([name], [description], [phone_number])
And the result:
Source: Author
The Seek is already a reality!
Don’t be alarmed if the time remains the same, in a heavily used database this type of indexing would have a significant impact, and I’ll explain why.
First, let’s compare before vs. after:

Source: Author
When we have a Seek index, it goes directly to the rows we need to read, unlike Index Scan, which reads all rows of the table and returns only the rows that were executed.
Actual Number of Rows for All Executions x Number of Rows Read
By accessing only the necessary rows, the impact extends to other components of the query execution plan, resulting in possible decreases in the following aspects:
- Estimated Operator Cost
- Estimated I/O Cost
- Estimated CPU Cost
These improvements comes from more efficient data access, reducing the load on system resources and optimizing the overall query performance.
For example, imagine that multiple users are performing various queries with different dates.
If the table has only one clustered index, each query will require the disk to be repeatedly queried to access the data, which can result in a significant increase in disk load and potentially cause performance bottlenecks.
And how to identify bottlenecks?
How to Identify a Query that is Costing for the Database?
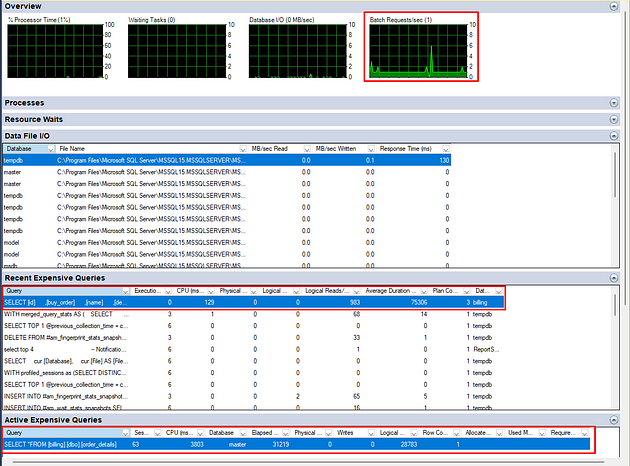
The easiest and quickest way to identify a query that is weighing down the database is through the Activity Monitor.
The Activity Monitor is a GUI-based tool, meaning it provides you with an overview of your database and real-time activities. You can identify if there’s something locking your database as soon as you open the Activity Monitor.
Example of the Activity Monitor with the query without index:
Source: Author
What does each tab mean?
1- Overview:
- Provides a quick overview of the overall health and performance of the server including CPU usage, waiting tasks, active user connections, and database I/O statistics.
2- Processes:
- Displays information about the processes currently running. Some examples include: Session ID, Login and Login Name, and the accessed database.
3- Resource Waits:
- Resource waits occur when processes are waiting for resources such as CPU, memory, disk I/O, or locks.
- Shows a list of resource waits.
4- Data File I/O:
- Provides information about the I/O activity of the data files associated with the databases.
- Displays the .mdf, .ldf, and .ndf data files of the databases.
5- Recent Expensive Queries:
- Displays a list of recent queries that have consumed a significant amount of server resources, such as CPU time or I/O.
- Includes details such as query text, execution count, total CPU time, and average execution time.
6- Active Expensive Queries:
- Similar to the recent expensive queries tab, but focuses on active queries that are consuming significant server resources.
Database Engine Tuning Advisor to Find Improvements
The Database Engine Tuning Advisor (DTA) is a tool that comes with SQL Server and is used to analyze workloads and provide recommendations that can improve query performance.
The Database Engine Tuning Advisor makes recommendations for:
- Indexes and STATISTICS
- Partitioning
In other words, it will analyze your entire structure and make recommendations based on it.
One recommendation for using the DTA is to use a workload file; this file can be generated through SQL Server Profiler called a trace file (Trace Profiler).
But there are other ways to do this, one of which is to go directly through the query.
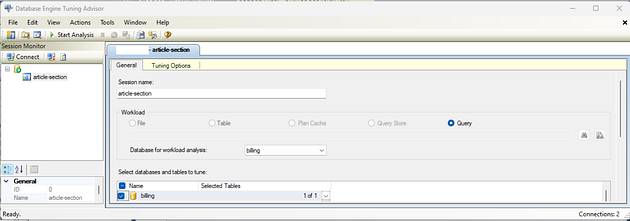
To do this, simply select the query Ctrl + A > right-click > Analyze Query in Database Engine Tuning Advisor:

Source: Author
Example of the tuning that will open:
Source: Author
In the Tuning Options, you can choose what type of recommendation you want to receive. After that, just click on Start Analysis.
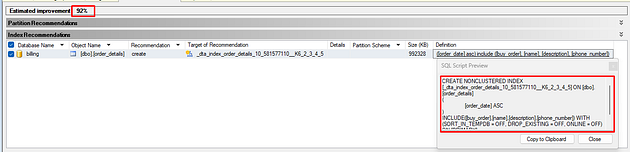
And magically, we have the recommendation:
Source: Author
An estimated improvement of 92%, let’s take a closer look at the index?
CREATE NONCLUSTERED INDEX [_dta_index_order_details_10_581577110__K6_2_3_4_5] ON [dbo].[order_details]
(
 [order_date] ASC
)
INCLUDE([buy_order],[name],[description],[phone_number]) WITH (SORT_IN_TEMPDB = OFF, DROP_EXISTING = OFF, ONLINE = OFF) ON [PRIMARY]
Very similar to what we created above, remember?
Just be careful about one point: The improvement was made focusing only on this table.
The recommendation is to generate a Profiler file. That way, it can have an overview of the structures and bottlenecks!
I hope you enjoyed it as much as I did!
What about the next steps?
- Save the content here, create a database example and go training. It is the best way to learn!
Enjoying the content?
Support me saying thanks by buying me a coffee! ☕
메타데이터
- post_id
- 2979a92cfe8f
- slug
- improve-queries-with-query-execution-plan-2979a92cfe8f
- url
- https://blog.devops.dev/improve-queries-with-query-execution-plan-2979a92cfe8f
- canonical_url
- https://blog.devops.dev/improve-queries-with-query-execution-plan-2979a92cfe8f
- author_url
- https://medium.com/@lorenzouriel
- status
- ok
- fetched_at
- 2026-07-17 20:05:51