Pure Financial Analytics, Part 1B: Stress Testing the Forecast Against the Oil Shock — building the…
When oil becomes a geopolitical instrument, the test is not perfect prediction. The test is whether the forecast still maps the stress…
Pure Financial Analytics, Part 1B: Stress Testing the Forecast Against the Oil Shock — building the baseline
When oil becomes a geopolitical instrument, the test is not perfect prediction. The test is whether the forecast still maps the stress regime.
Part 1A introduced the forecasting core: a regime-aligned approach using FastDTW to compare current macro-market structure against historical analogues, then translate that alignment into a volatility-aware daily forecast.
Part 1B is the out-of-sample question.
Once the forecast left the lab, did it survive contact with the tape?
The answer, through the latest available May 21, 2026, futures data, is yes — with a more interesting detail underneath: the Gordon daily forecast did not simply compete against static oil calls. It held up through a period when oil traded as a geopolitical instrument, with price action clustering around support levels exactly when public geopolitical commentary intensified.
The test window
The forecast was scored from April 29 through May 21, 2026, using daily WTI futures closes. Investing.com’s WTI historical table shows the front-month contract falling from $106.88 on April 29 to $99.91 on May 21, with a sharp event-window low around the May 6–11 period before rebounding into mid-month. The forecast was not re-fit during the window. The question was simple: compare the Gordon daily forecast path against realized WTI futures and against public institutional reference forecasts.
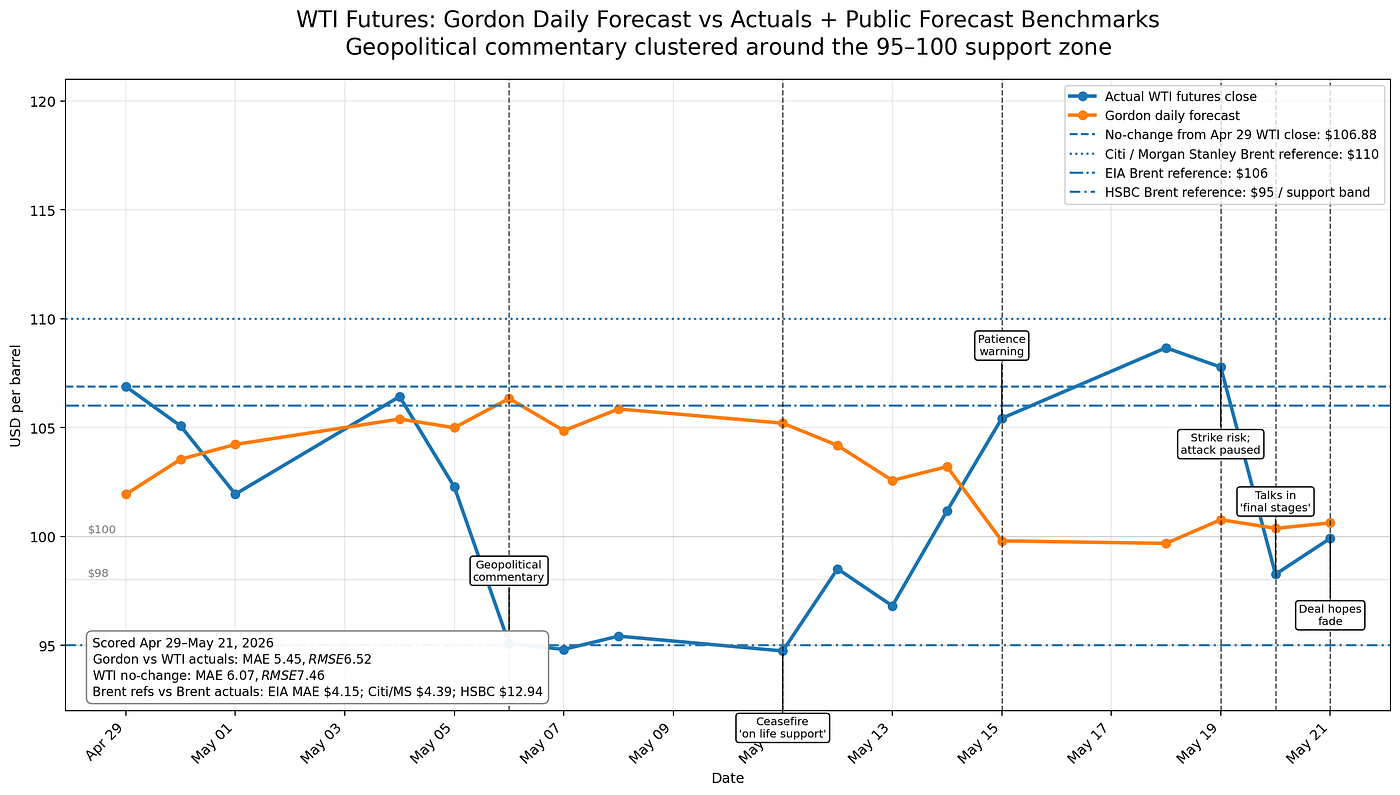
Forecast vs Benchmarks
🚨 HIRING: Tech Talent 💰 $50–$120/hr | 🔥 Multiple Roles
Frontend • Backend • Full Stack • Mobile • AI/ML • DevOps 👉 **Apply Here**

What the forecast got right
The Gordon daily forecast did not nail every turn. No daily oil forecast does in a geopolitical shock. But it did something more useful than a static target: it stayed inside the live stress zone while the market was repricing around war-risk headlines, Strait of Hormuz disruption risk, and shifting diplomatic signals.
Through May 21, the Gordon daily forecast scored:
| Forecast / benchmark                       | Market tested against |       MAE |      RMSE |
| ------------------------------------------ | --------------------- | --------: | --------: |
| **Gordon daily forecast**                  | WTI actuals           | **$5.45** | **$6.52** |
| No-change from Apr. 29 WTI close           | WTI actuals           |     $6.07 |     $7.46 |
| EIA $106 Brent reference                   | Brent actuals         | **$4.15** | **$5.22** |
| Citi / Morgan Stanley $110 Brent reference | Brent actuals         |     $4.39 |     $5.27 |
| HSBC $95 Brent reference                   | Brent actuals         |    $12.94 |    $13.82 |
The WTI comparison is the most direct one: Gordon daily forecast vs actual WTI futures. On that test, the forecast beat the no-change benchmark anchored to the April 29 close.
The Brent comparison is different. Citi, Morgan Stanley, EIA, HSBC, and other institutional forecasts are typically published as quarterly averages, scenario levels, or reference targets — not daily WTI paths. Citi lifted its base-case Brent forecast to $110 for Q2 2026, while Morgan Stanley also had a $110 Q2 Brent forecast. EIA’s May Short-Term Energy Outlook put Brent around $106/bbl in May and June, while HSBC raised its 2026 Brent forecast to $95/bbl.
So, the clean conclusion is not “Gordon beat every bank on the same exact instrument.” The cleaner conclusion is this:
On WTI, Gordon beat the no-change benchmark. On Brent, EIA and Citi/Morgan Stanley were competitive as level forecasts, but they were not daily-path forecasts.
Brent vs WTI: the correct comparison
Using Brent futures closes over the same April 29–May 21 window, Brent moved from $118.03 on April 29 to $106.88 on May 21, with large swings around the same geopolitical stress period.
Against Brent actuals, the public benchmark levels ranked this way:
| Brent reference forecast                   | Brent actuals MAE |
| ------------------------------------------ | ----------------: |
| **EIA $106 May–June Brent reference**      |         **$4.15** |
| Citi / Morgan Stanley $110 Brent reference |             $4.39 |
| HSBC $95 Brent reference                   |            $12.94 |
That matters. It means the institutional Brent calls were not useless. EIA and Citi/Morgan Stanley were close on the Brent level.
A flat Brent reference level can be close on average while still failing to describe the path. The Gordon model was attempting the harder task: a daily WTI path through a stress regime.
The geopolitical layer
The chart shows something worth studying further: the president’s geopolitical commentary clustered around the same support region where WTI was testing and retesting the lower band.
May 6 brought commentary around hopes for an Iran deal and the possibility of Hormuz being open to all. The market was already breaking lower. May 11 brought the “on life support” ceasefire language. WTI was still sitting near the lower support band. May 15 brought a sharper warning tone toward Iran, and WTI had rebounded hard. May 20 brought “final stages” negotiation language and a sharp selloff. May 21 reversed again as hopes faded and oil rebounded. Reuters reported that on May 21 Brent rose to $108.09 and WTI climbed to $101.78 as complications in U.S.-Iran talks renewed supply concerns.
That is the pattern: geopolitical commentary was not randomly distributed across the chart. It appeared near the market’s stress points — especially the $95–$100 WTI support zone — where traders were repricing the probability of supply normalization versus renewed escalation.
The forecast’s “tightening” regime label therefore looks defensible. The realized tape was not a calm supply-demand market. It was a shock market, repeatedly repricing around diplomacy, Hormuz risk, and political messaging.
The forecast did not need to predict the next headline. It needed to recognize that the market was already trading as if the next headline mattered.
Conclusion
Part 1B shows the forecasting core doing what it was designed to do: hold its shape when the market stopped behaving like a clean historical average.
The Gordon daily forecast was tested during a geopolitical oil shock, not a quiet pricing window. WTI was moving around a live support zone, public commentary was arriving near key inflection points, and institutional forecasts were mostly expressed as broad Brent level targets rather than daily paths.
Against that backdrop, the Gordon daily forecast remained competitive where it mattered most: it stayed closer to the realized WTI path than the no-change benchmark and tracked the stress regime more effectively than static reference levels.
The value of the model is not that it predicts every headline. No oil model does that. The value is that it identified the structure of the market before the outcome was obvious: a tightening, event-driven regime where price was being pulled between supply-risk premium and diplomatic de-escalation.
That is the role of regime alignment in forecasting.
It does not replace judgment. It gives judgment a live map.
Thank you for being a part of the community
Before you go:

👉 Be sure to clap and follow the writer ️👏️️
👉 Follow us: **Linkedin| [Medium](https://medium.com/codetodeploy)**
👉 CodeToDeploy Tech Community is live on Discord — **Join now!**
Disclosure: This post includes affiliate and partnership links.
메타데이터
- post_id
- 2986aeb9e0d2
- slug
- pure-financial-analytics-part-1b-stress-testing-the-forecast-against-the-oil-shock-building-the-2986aeb9e0d2
- url
- https://medium.com/codetodeploy/pure-financial-analytics-part-1b-stress-testing-the-forecast-against-the-oil-shock-building-the-2986aeb9e0d2
- canonical_url
- https://medium.com/codetodeploy/pure-financial-analytics-part-1b-stress-testing-the-forecast-against-the-oil-shock-building-the-2986aeb9e0d2
- author_url
- https://medium.com/@antonrgordon
- status
- ok
- fetched_at
- 2026-06-09 15:37:30