What I Learned About Product Analytics Using Mixpanel: Events, Funnels, and User Behavior
Introduction
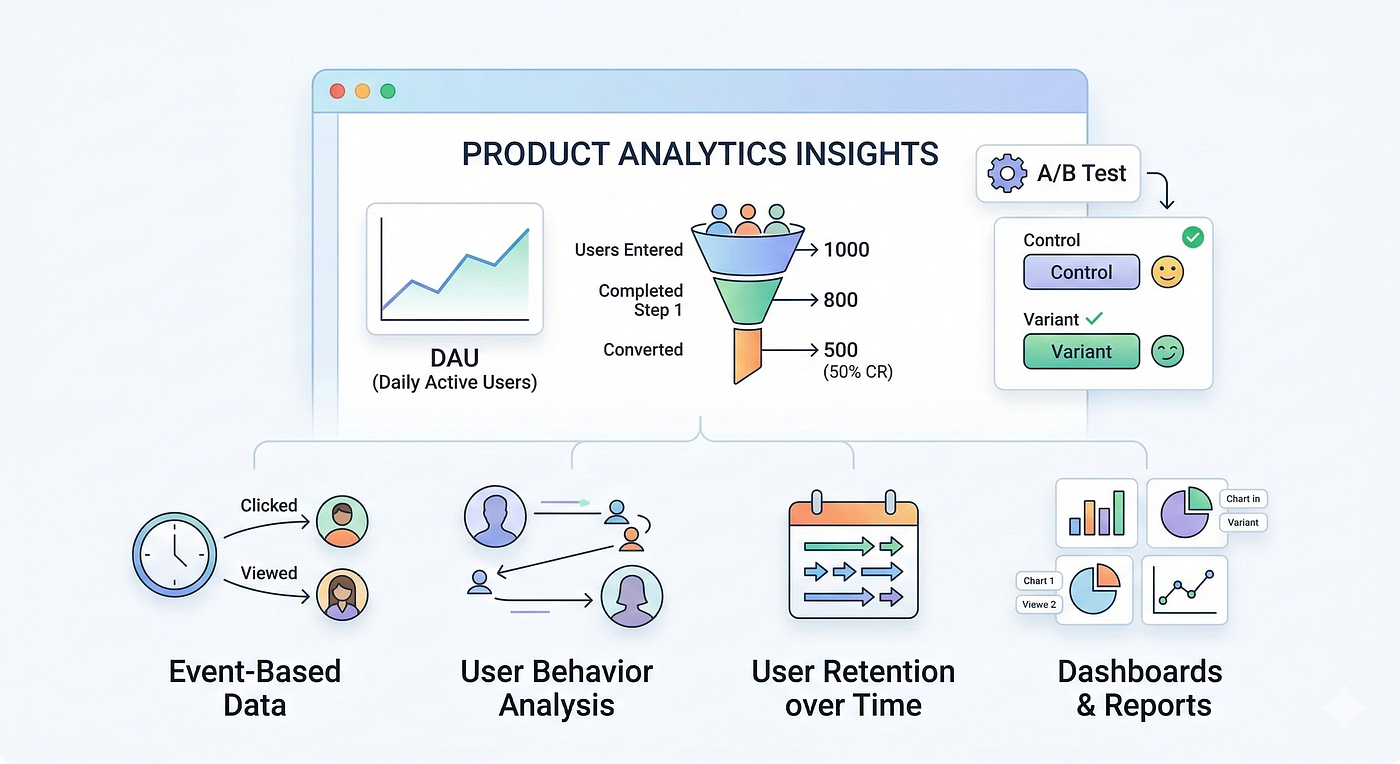
What I Learned About Product Analytics Using Mixpanel: Events, Funnels, and User Behavior
Introduction
Product analytics helps teams understand “how users interact with a product”. Instead of relying on assumptions, teams analyze behavioral data to understand user actions, engagement, and product performance.
Tools like Mixpanel allow teams to “collect, analyze, and visualize behavioral data”, helping organizations make better product decisions.
As part of the “Product Analytics Micro-Certification from Product School”, I explored how behavioral data is structured and analyzed to measure product health.
Setting Up Mixpanel
The first step in analyzing product behavior is collecting event data. To simulate product activity, a dataset was loaded into Mixpanel to generate user events.
Once the data is ingested, the events become visible in the Insights dashboard, where they can be visualized using charts such as line graphs to observe user activity over time.
This setup allows product teams to begin analyzing user behaviors and identifying patterns within the product.
Understanding Behavioral Data
Behavioral data combines two types of information:
Object Data: Object data describes attributes about entities. Example: User | Age | Country Rows represent objects, and columns represent attributes. Limitations include: 1.Every change requires updating records 2.Hard to analyze behavioral patterns 3.Counting activity across time is inefficient.
Event Data Event data records every user action independently. Example: Event | Timestamp | User | Device Advantages of event data: 1.Tracks actions over time 2.Easy to analyze behavioral trends 3.Flexible structure (new keys can be added anytime)
Because of these advantages, event data is ideal for analyzing “user behavior inside digital products”.
Taxonomy and Data Organization Before collecting data, teams must define a “taxonomy”. Taxonomy answers questions such as: What events are we tracking? What properties describe these events?
Clear taxonomy ensures that product teams collect “consistent and meaningful data”.
Mixpanel also provides “Lexicon”, a data dictionary tool that allows teams to define and document events and properties so everyone understands the data being analyzed.
Framing Good Questions Analytics is only valuable when teams ask “the right questions”. Examples of good product questions include: Which features are used most frequently? Where do users drop off in the purchase flow? What actions indicate that a user will return?
Framing good questions helps analysts extract “meaningful insights instead of just numbers”.
Behavioral Metrics Behavioral metrics measure how users interact with the product. One commonly used metric is: DAU — Daily Active Users DAU counts the number of “unique users performing at least one action in a day”.
For example: If one user performs many actions in a day, they are still counted as “one active user”. If no users perform any actions, then “DAU = 0”.
These metrics help product teams measure “engagement and overall product health”.
Visualizing Data Data visualization helps transform raw data into insights. Common visualizations include: Bar Charts Useful for comparing quantities between categories. Example: comparing the most used features in an app. Pie Charts Used to show proportions of a whole. Example: percentage of users using different devices. Data Tables Useful when sorting or stacking different attributes. Line Charts Used to show trends over time.
The horizontal axis usually represents “time”, making line charts ideal for analyzing behavioral trends.
Sharing Insights with Dashboards Analysis alone is not enough. Insights must also be shared with stakeholders. Dashboards allow teams to: Monitor key product metrics Communicate findings clearly Track changes in performance over time
A well-designed dashboard ensures that leadership, product teams, and stakeholders can easily understand product performance.
Acquisition Metrics
Acquisition metrics measure “how users enter a product”.
One of the most common ways to analyze acquisition is through “funnel analysis”.
Funnel Analysis
A funnel measures “conversion between sequential steps in a user journey”.
Example from the “RandoSando” case study: Step 1 — User opens the app Step 2 — User orders a sandwich Step 3 — User receives the sandwich
As users move through each step, the number typically decreases.
This drop-off helps teams identify “where users abandon the process”.
Funnels can appear in different shapes: Wide funnel → many users complete the steps Narrow funnel → significant drop-offs occur between steps
Conversion rate measures how many users successfully move from one step to the next.
Trend Spotting
Trend analysis helps teams identify patterns in user behavior over time.
Examples include: Increasing daily activity Seasonal usage patterns Sudden drops in engagement
Identifying these trends helps teams “respond quickly to product changes or shifts in user behavior”.
Retention Metrics Retention measures how well a product “keeps users returning over time”.
Acquisition is usually easier to measure because users perform a clear action such as “signing up or creating an account”.
Retention, however, is more complex because each product defines retention differently.
Examples: A food ordering app might measure retention through “repeat orders”. A streaming service might measure retention through “returning viewing sessions”.
Strong retention often leads to “long-term business profitability”.
Experiments and A/B Testing
Product teams often test different ideas to improve the user experience. The course presented a scenario where the “RandoSando payment flow was confusing and inefficient”.
The goal was to improve the checkout experience. Instead of guessing the best solution, teams run “experiments”.
A/B Testing A/B testing compares two versions of a product experience. Important components include: Control Group Users experiencing the original design. Variant Users experiencing a new feature or design.
By comparing behavioral data between groups, teams determine which experience performs better.
Experiments allow organizations to make “data-driven product decisions”.
Key Takeaways
Through this learning experience, I gained a deeper understanding of how product teams analyze user behavior using data.
Some of the most valuable takeaways include: 1.Event data provides a powerful way to track user behavior over time 2.Funnel analysis helps identify where users drop off in a product journey 3.Behavioral metrics like “DAU” provide insight into engagement levels 4.Retention analysis is essential for long-term product success 5.Experiments and “A/B testing” help teams make data-driven product improvements
These concepts highlight how product analytics enables teams to build better user experiences.
Conclusion
Product analytics allows teams to understand user behavior and improve digital experiences using data.
By combining: Event tracking Behavioral metrics Funnels Retention analysis Experimentation
organizations can continuously improve their products based on real user behavior.
Tools like Mixpanel make it possible to transform raw data into insights that guide product development and business strategy.
메타데이터
- post_id
- 298aed3dbd8a
- slug
- what-i-learned-about-product-analytics-using-mixpanel-events-funnels-and-user-behavior-298aed3dbd8a
- url
- https://medium.com/@sreejapasupuleti11/what-i-learned-about-product-analytics-using-mixpanel-events-funnels-and-user-behavior-298aed3dbd8a
- canonical_url
- https://medium.com/@sreejapasupuleti11/what-i-learned-about-product-analytics-using-mixpanel-events-funnels-and-user-behavior-298aed3dbd8a
- author_url
- https://medium.com/@sreejapasupuleti11
- status
- ok
- fetched_at
- 2026-06-09 15:37:30



