Observability with OpenTelemetry, Linkerd, Prometheus, and OpenSearch
Observability is critical for any company building technology. It reveals how users actually interact with your application, driving…

Observability with OpenTelemetry, Linkerd, Prometheus, and OpenSearch
Observability is critical for any company building technology. It reveals how users actually interact with your application, driving product and business decisions, while providing the forensic detail SREs and engineers need to identify and resolve incidents quickly, and more.
As applications evolve into distributed systems, with multiple services handling different responsibilities, the volume and volume of telemetry (metrics, logs, traces, events) explodes. Collecting, correlating, and consuming this data at scale is challenging, and a central platform becomes essential to aggregate and easily consume them.
In this article, I will focus on OpenSearch, the open-source search and analytics suite that engineers and data scientists use for search, observability, data ingestion, and I will show you how to use the metrics exposed by Linkerd by using both OpenTelemetry Collectors and Prometheus Instances directly in the OpenSearch dashboard.
Origin of the OpenSearch project
Similar to what happened with OpenTofu and Terraform, OpenSearch was created in response to Elastic’s announcement changing its software licensing strategy and stopping the release of new versions of Elasticsearch and Kibana under the Apache License in January 2021. That triggered the creation of a fork of Elasticsearch and Kibana, which then became OpenSearch (derived from Elasticsearch 7.10.2) and OpenSearch Dashboards (derived from Kibana 7.10.2).
The project’s reception has been huge, and as of 2025 total downloads exceed 1 billion, with over 3,300 contributors and 400 organizations actively contributing to the project. Usage has grown even more with the addition of managed offerings from cloud service providers like AWS that make it easier for companies to use and maintain these tools. As of 2024, 100,000+ customers use Amazon OpenSearch Service, including Adobe, Uber, Expedia, NVIDIA, The Washington Post, Netflix, and many others.
OpenSearch Ecosystem
OpenSearch’s open-source model has empowered many companies and individual contributors to create a rich ecosystem of plugins, integrations, and tooling. The core three peaces are the following:
OpenSearch
This is the core distributed search and analytics engine. Data are injested and stored as JSON documents inside indices (collections of documents). It provides functionality needed for operations at scale like sharding/replication, alerting, anomaly detection, RBAC and more.
OpenSearch Dashboards
This is the web application that provide a UI for the engineers to use in order to easily consume the injested data, build charts, dashboards, and connect to external systems like Prometheus to visualize metrics without ingesting them into OpenSearch.
Data Prepper
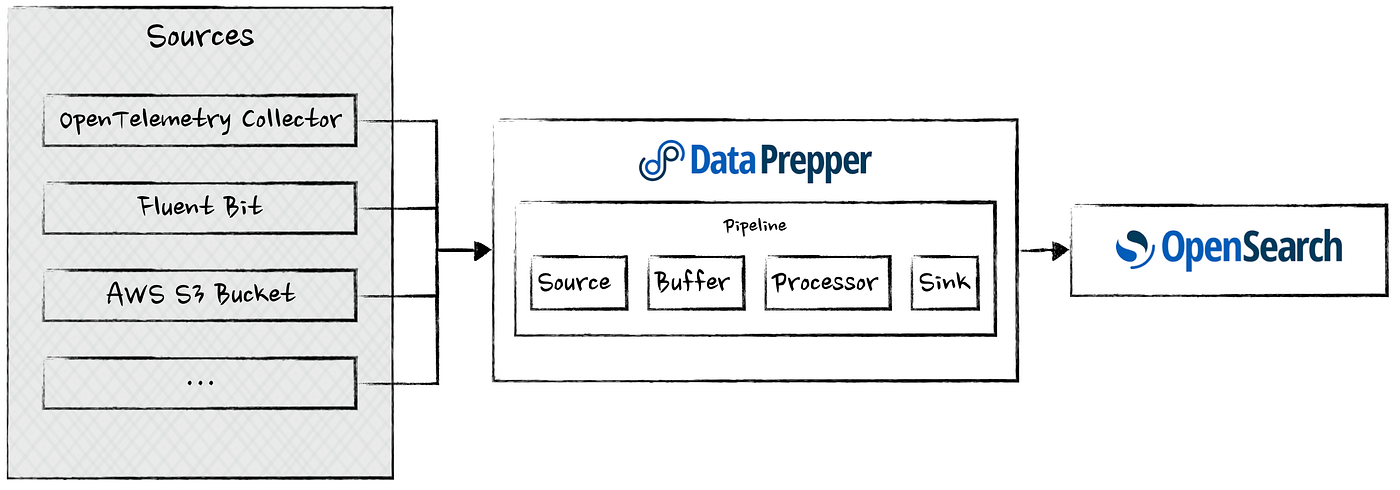
This is a data collector that create pipelines that ingests, enriches, transforms, and routes data coming from mutilple sources to specific targets based on a defined configuration.
OpenSearch and Linkerd
Now that we have an idea of what OpenSearch is, let’s move on to the meaty stuff. In this section, I will guide you step by step through the setup of a demo environment and the scrape and visualization of the metrics and logs emitted by both the Linkerd proxy and the control plane. The demo will be split into two code sections:
- I will show how to integrate your Prometheus instance with OpenSearch
- I will use an OpenTelemetry Collector to scrape the metrics directly and display them in OpenSearch Dashboards without using Prometheus.
Setting up the environment
Let’s start by bringing up a local environment to play with. First, we need to create a Kubernetes cluster.
k3d cluster create "01" \
  --image rancher/k3s:v1.30.0-k3s1 \
  --k3s-arg '--flannel-backend=none@server:*' \
  --k3s-arg '--disable=traefik@server:*'
Then install Linkerd. There are many ways to install Linkerd; in this case we will use the Linkerd CLI.
curl --proto '=https' --tlsv1.2 -sSfL https://run.linkerd.io/install-edge | sh
export PATH=$HOME/.linkerd2/bin:$PATH
linkerd install --crds | kubectl apply -f -
linkerd install | kubectl apply -f -
If you want to know more about other ways to install Linkerd, take a look at my previous article.
Next, let’s deploy a simple application that we will use to generate traffic and collect metrics.
apiVersion: v1
kind: Namespace
metadata:
  name: simple-app
  annotations:
    linkerd.io/inject: enabled
---
apiVersion: v1
kind: Service
metadata:
  name: simple-app-v1
  namespace: simple-app
spec:
  selector:
    app: simple-app-v1
    version: v1
  ports:
    - port: 80
      targetPort: 5678
---
apiVersion: apps/v1
kind: Deployment
metadata:
  name: simple-app-v1
  namespace: simple-app
spec:
  replicas: 1
  selector:
    matchLabels:
      app: simple-app-v1
      version: v1
  template:
    metadata:
      labels:
        app: simple-app-v1
        version: v1
    spec:
      containers:
        - name: http-app
          image: hashicorp/http-echo:latest
          args:
            - "-text=Simple App v1 - CLUSTER_NAME"
          ports:
            - containerPort: 5678
Install OpenSearch and OpenSearch Dashboard
Installing the search engine and the related visualization tool is pretty straightforward. First, we need to define a couple of values required to integrate with Prometheus like plugins.query.datasources.encryption.masterkey . This key/value pair is required as it is going to be used to encrypt sensitive informations like credentials used during the connection to external data sources.
cat > opensearch.yaml <<'YAML'
config:
  opensearch.yml: |-
    cluster.name: opensearch-cluster
    network.host: 0.0.0.0
    plugins.query.datasources.encryption.masterkey: "be4377581acba8e390524366a1d0320a"
extraEnvs:
  - name: OPENSEARCH_INITIAL_ADMIN_PASSWORD
    value: 8}F?cs0GZz
YAML
Once we have the values in place, we can install the Helm charts. In this case, we’ll use the default values for OpenSearch Dashboards.
helm repo add opensearch https://opensearch-project.github.io/helm-charts
helm repo update
helm upgrade --install opensearch opensearch/opensearch \
  --namespace opensearch \
  --create-namespace \
  --values opensearch.yaml
helm upgrade --install opensearch-dashboards opensearch/opensearch-dashboards \
  --namespace opensearch \
  --create-namespace
Now we can access OpenSearch Dashboards by port-forwarding the opensearch-dashboards pod on port 5601:
export POD_NAME=$(kubectl get pods --namespace opensearch -l "app.kubernetes.io/name=opensearch-dashboards,app.kubernetes.io/instance=opensearch-dashboards" -o jsonpath="{.items[0].metadata.name}")
export CONTAINER_PORT=$(kubectl get pod --namespace opensearch $POD_NAME -o jsonpath="{.spec.containers[0].ports[0].containerPort}")
kubectl --namespace opensearch port-forward $POD_NAME 8080:$CONTAINER_PORT
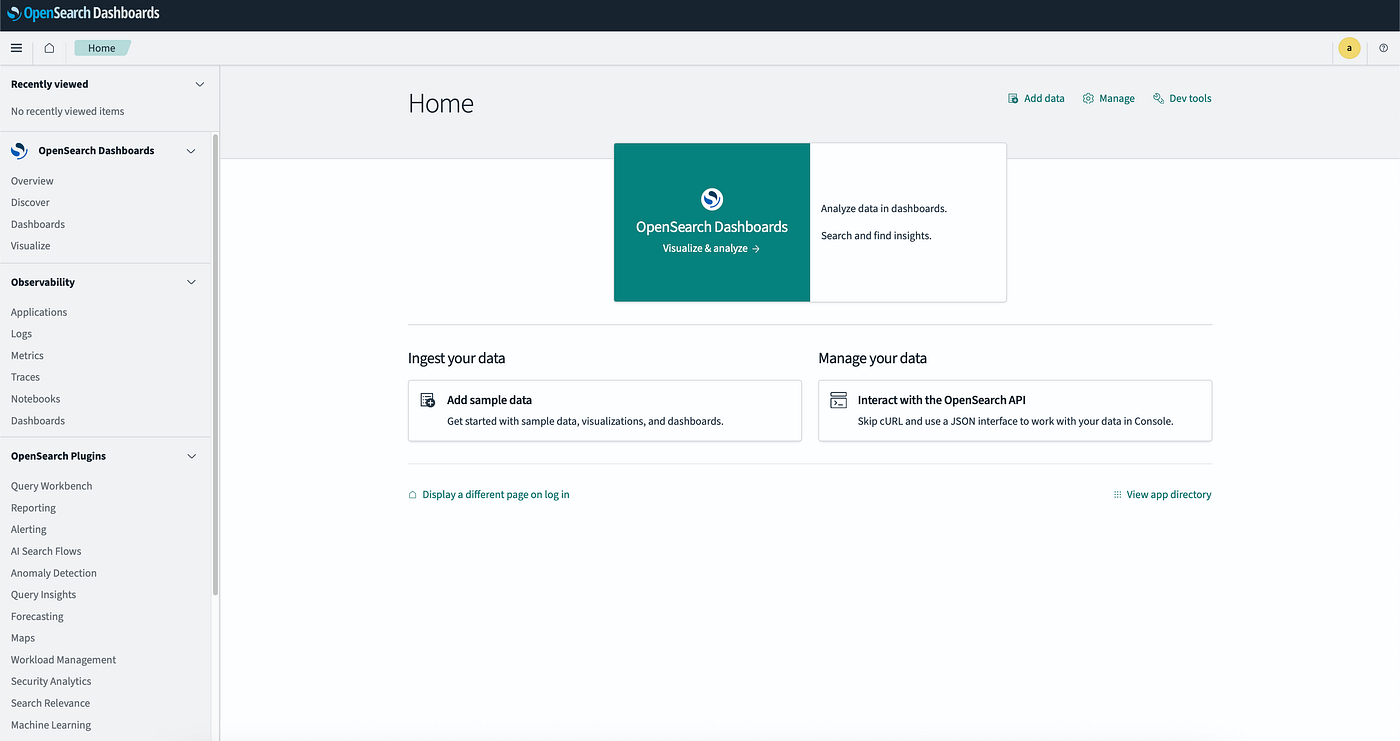
Browse to http://127.0.0.1:8080 and log in using admin as the username and the password defined in the Helm chart values.
Prometheus Data Source for Linkerd
The first step is to install Prometheus and configure it to scrape the metrics exposed by the Linkerd proxies and control plane components. To do so, create the following values file:
cat > prometheus.yaml <<'YAML'
server:
  extraFlags:
  - web.enable-lifecycle
  securityContext:
    runAsUser: 0
    runAsNonRoot: false
    runAsGroup: 0
    fsGroup: 0
  global:
    scrape_interval:     15s
    scrape_timeout:      10s
    evaluation_interval: 15s
extraScrapeConfigs: |
  - job_name: 'linkerd-controller'
    kubernetes_sd_configs:
    - role: pod
      namespaces:
        names:
        - 'linkerd'
    relabel_configs:
    - source_labels:
      - __meta_kubernetes_pod_container_port_name
      action: keep
      regex: admin-http
    - source_labels: [__meta_kubernetes_pod_container_name]
      action: replace
      target_label: component
  - job_name: 'linkerd-service-mirror'
    kubernetes_sd_configs:
    - role: pod
    relabel_configs:
    - source_labels:
      - __meta_kubernetes_pod_label_linkerd_io_control_plane_component
      - __meta_kubernetes_pod_container_port_name
      action: keep
      regex: linkerd-service-mirror;admin-http$
    - source_labels: [__meta_kubernetes_pod_container_name]
      action: replace
      target_label: component
  - job_name: 'linkerd-proxy'
    kubernetes_sd_configs:
    - role: pod
    relabel_configs:
    - source_labels:
      - __meta_kubernetes_pod_container_name
      - __meta_kubernetes_pod_container_port_name
      - __meta_kubernetes_pod_label_linkerd_io_control_plane_ns
      action: keep
      regex: ^linkerd-proxy;linkerd-admin;linkerd$
    - source_labels: [__meta_kubernetes_namespace]
      action: replace
      target_label: namespace
    - source_labels: [__meta_kubernetes_pod_name]
      action: replace
      target_label: pod
    - source_labels: [__meta_kubernetes_pod_label_linkerd_io_proxy_job]
      action: replace
      target_label: k8s_job
    - action: labeldrop
      regex: __meta_kubernetes_pod_label_linkerd_io_proxy_job
    - action: labelmap
      regex: __meta_kubernetes_pod_label_linkerd_io_proxy_(.+)
    - action: labeldrop
      regex: __meta_kubernetes_pod_label_linkerd_io_proxy_(.+)
    - action: labelmap
      regex: __meta_kubernetes_pod_label_linkerd_io_(.+)
    - action: labelmap
      regex: __meta_kubernetes_pod_label_(.+)
      replacement: __tmp_pod_label_$1
    - action: labelmap
      regex: __tmp_pod_label_linkerd_io_(.+)
      replacement:  __tmp_pod_label_$1
    - action: labeldrop
      regex: __tmp_pod_label_linkerd_io_(.+)
    - action: labelmap
      regex: __tmp_pod_label_(.+)
YAML
Then install the Prometheus Community Helm chart:
helm repo add prometheus-community https://prometheus-community.github.io/helm-charts
helm repo update
helm upgrade --install prometheus prometheus-community/prometheus \
  --namespace monitoring \
  --create-namespace \
  --values ./prometheus.yaml
Integrate OpenSearch with Prometheus
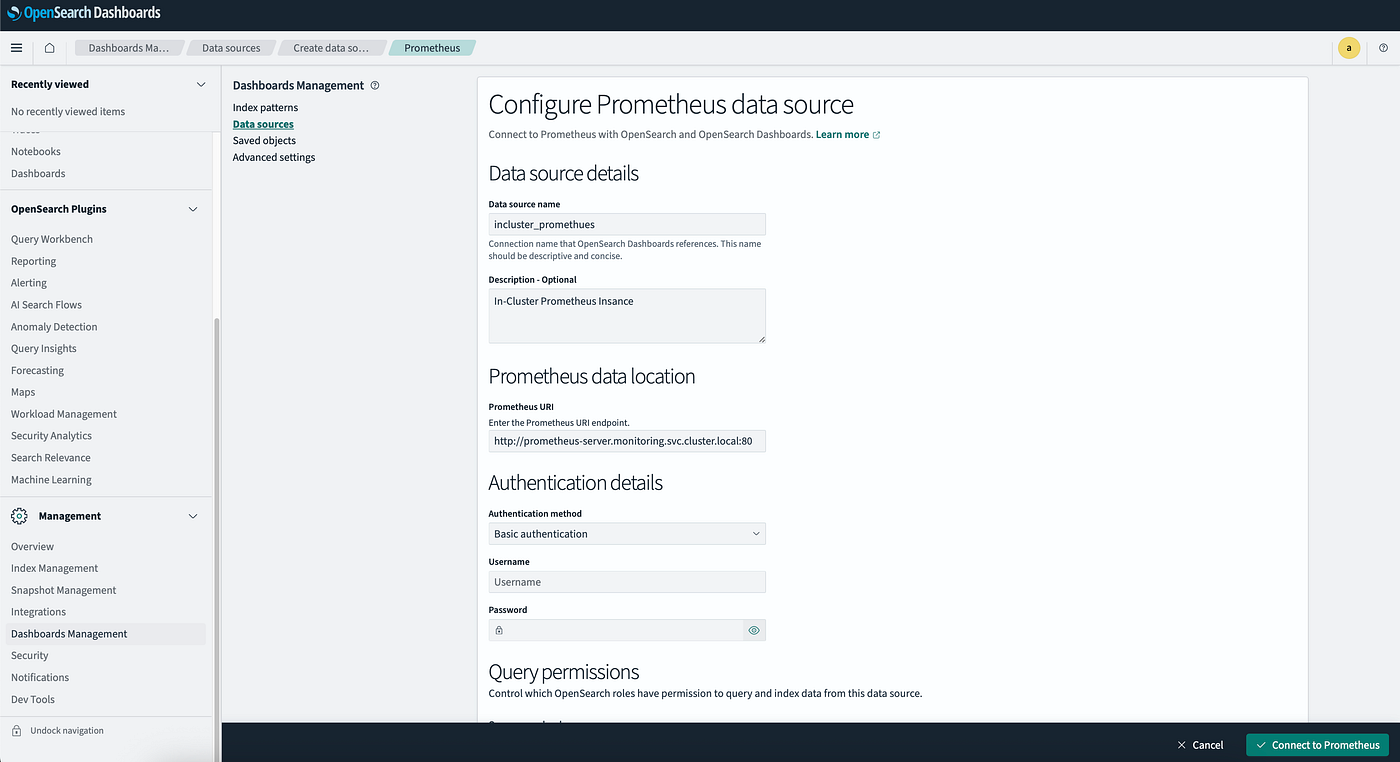
- In OpenSearch Dashboards, open Dashboard Management.
- Choose Data sources.
- Click Create direct query connection and select Prometheus.
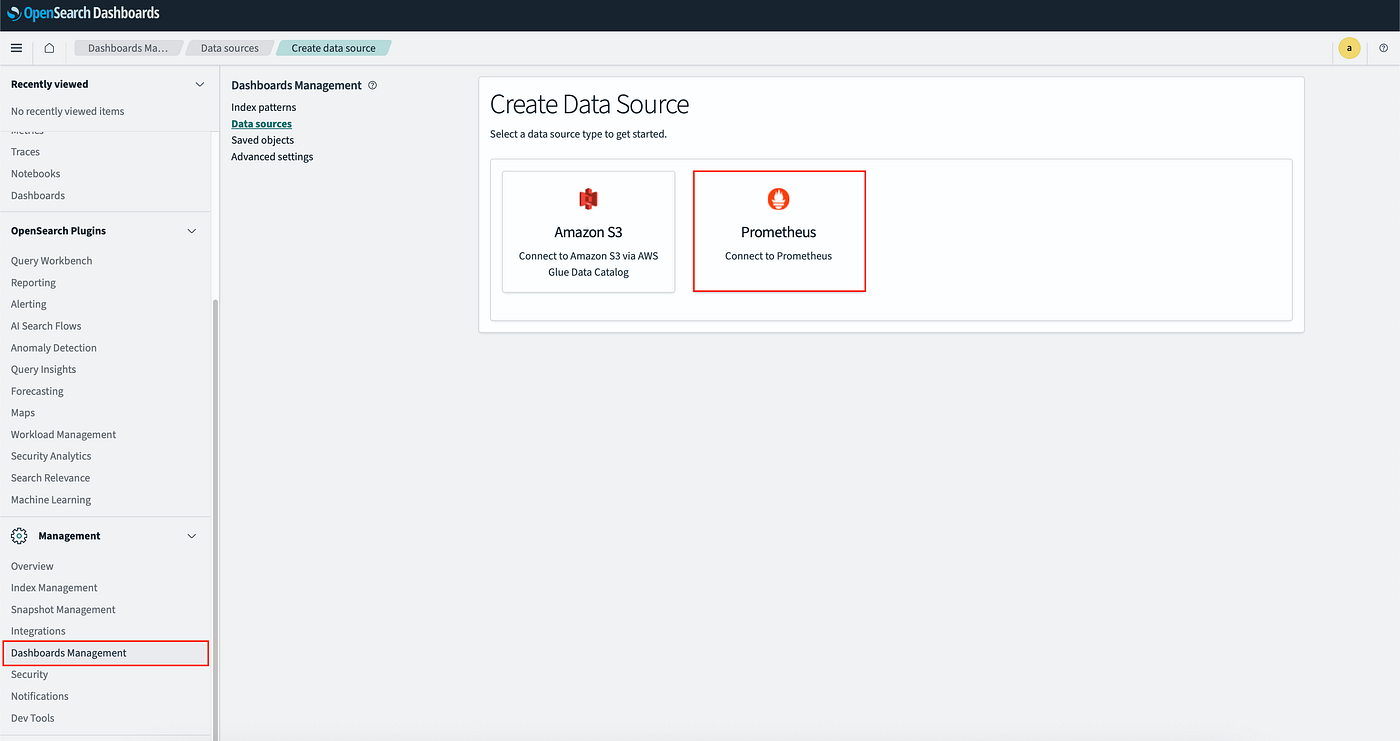
- Fill in the form with the Prometheus Server service running in your cluster (in this example, Prometheus Server is deployed in the
monitoringnamespace), then click Connect to Prometheus.
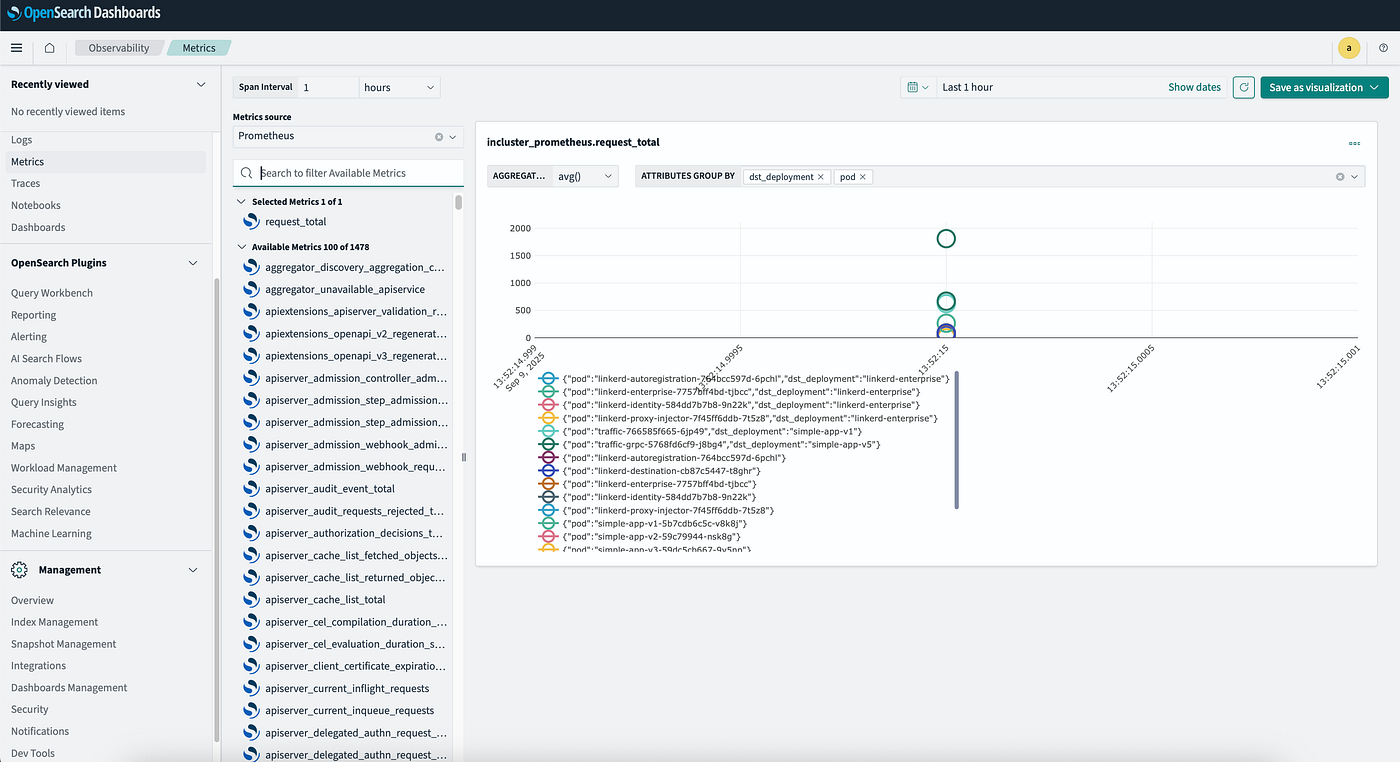
If you select the Metrics option in the Observability section, you’ll be able to access the metrics scraped by Prometheus and create interactive dashboards from them.
OpenTelemetry Pipeline for Linkerd
There may be cases where creating a direct query connection is disabled , for example, in Amazon OpenSearch Service. In this case, you can use the OpenTelemetry Collector to scrape the Prometheus metrics exposed by the proxies and control plane, and then use Data Prepper to send them to OpenSearch.
Install Data Prepper
The Data Prepper instance needs the OpenSearch service endpoint and the name of the index it will automatically create based on the metrics ingested by the OpenTelemetry Collector.
cat > data-prepper.yaml <<'YAML'
pipelineConfig:
  enabled: true
  demoPipeline: false
  config:
    metrics-pipeline:
      source:
        otel_metrics_source:
          port: 21891
          ssl: false
          health_check_service: true
      sink:
        - opensearch:
            hosts: ["https://opensearch-cluster-master.opensearch.svc.cluster.local:9200"]
            username: "admin"
            password: "8}F?cs0GZz"
            insecure: true
            index_type: custom
            index: ss4o_metrics-otel-%{yyyy.MM.dd}
            bulk_size: 4
YAML
Then install Data Prepper with Helm:
helm install data-prepper opensearch/data-prepper --values data-prepper.yamlInstall the OpenTelemetry Collector
This component scrapes the metrics exposed by the Linkerd control plane and proxies and pushes them to the configured Data Prepper instance. We need to configure:
- an exporter pointing to Data Prepper on port
21891(the metrics port), - the Prometheus receiver with jobs to scrape Linkerd metrics
- a pipeline that ties them together.
cat > open-telemetry.yaml <<'YAML'
config:
  exporters:
    otlp/dataprepper:
      endpoint: data-prepper.default.svc.cluster.local:21891
      tls:
        insecure: true
        insecure_skip_verify: true
  extensions:
    health_check:
      endpoint: ${env:MY_POD_IP}:13133
  processors:
    memory_limiter:
      check_interval: 5s
      limit_mib: 512
      spike_limit_percentage: 25
    batch: {}
  receivers:
    otlp:
      protocols:
        grpc: {}
        http: {}
    prometheus:
      config:
        scrape_configs:
          - job_name: 'linkerd-controller'
            kubernetes_sd_configs:
            - role: pod
              namespaces:
                names:
                - 'linkerd'
            relabel_configs:
            - source_labels:
              - __meta_kubernetes_pod_container_port_name
              action: keep
              regex: admin-http
            - source_labels: [__meta_kubernetes_pod_container_name]
              action: replace
              target_label: component
          - job_name: 'linkerd-service-mirror'
            kubernetes_sd_configs:
            - role: pod
            relabel_configs:
            - source_labels:
              - __meta_kubernetes_pod_label_linkerd_io_control_plane_component
              - __meta_kubernetes_pod_container_port_name
              action: keep
              regex: linkerd-service-mirror;admin-http$
            - source_labels: [__meta_kubernetes_pod_container_name]
              action: replace
              target_label: component
          - job_name: 'linkerd-proxy'
            kubernetes_sd_configs:
            - role: pod
            relabel_configs:
            - source_labels:
              - __meta_kubernetes_pod_container_name
              - __meta_kubernetes_pod_container_port_name
              - __meta_kubernetes_pod_label_linkerd_io_control_plane_ns
              action: keep
              regex: ^linkerd-proxy;linkerd-admin;linkerd$
            - source_labels: [__meta_kubernetes_namespace]
              action: replace
              target_label: namespace
            - source_labels: [__meta_kubernetes_pod_name]
              action: replace
              target_label: pod
            - source_labels: [__meta_kubernetes_pod_label_linkerd_io_proxy_job]
              action: replace
              target_label: k8s_job
            - action: labeldrop
              regex: __meta_kubernetes_pod_label_linkerd_io_proxy_job
            - action: labelmap
              regex: __meta_kubernetes_pod_label_linkerd_io_proxy_(.+)
            - action: labeldrop
              regex: __meta_kubernetes_pod_label_linkerd_io_proxy_(.+)
            - action: labelmap
              regex: __meta_kubernetes_pod_label_linkerd_io_(.+)
            - action: labelmap
              regex: __meta_kubernetes_pod_label_(.+)
              replacement: __tmp_pod_label_$1
            - action: labelmap
              regex: __tmp_pod_label_linkerd_io_(.+)
              replacement:  __tmp_pod_label_$1
            - action: labeldrop
              regex: __tmp_pod_label_linkerd_io_(.+)
            - action: labelmap
              regex: __tmp_pod_label_(.+)
  service:
    telemetry:
      metrics:
        address: ${env:MY_POD_IP}:8888
    extensions:
      - health_check
    pipelines:
      metrics:
        receivers: [prometheus]
        processors: [memory_limiter, batch]
        exporters: [otlp/dataprepper, debug]
YAML
Finally, install the related Helm chart:
helm repo add open-telemetry https://open-telemetry.github.io/opentelemetry-helm-charts
helm install opentelemetry-collector open-telemetry/opentelemetry-collector \
   --set image.repository="otel/opentelemetry-collector-k8s" \
   --set mode=deployment \
   --values open-telemetry.yaml
(Optional) Role and RoleBidnings
Depending on your environment, you may need to deploy the following RBAC resources to allow the OpenTelemetry Collector to query Kubernetes APIs:
kubectl apply -f - <<EOF
apiVersion: rbac.authorization.k8s.io/v1
kind: ClusterRole
metadata:
  name: otel-prom-discovery
rules:
- apiGroups: [""]
  resources: ["pods", "services", "endpoints", "nodes"]
  verbs: ["get", "list", "watch"]
- apiGroups: ["discovery.k8s.io"]
  resources: ["endpointslices"]
  verbs: ["get", "list", "watch"]
---
apiVersion: rbac.authorization.k8s.io/v1
kind: ClusterRoleBinding
metadata:
  name: otel-prom-discovery
roleRef:
  apiGroup: rbac.authorization.k8s.io
  kind: ClusterRole
  name: otel-prom-discovery
subjects:
- kind: ServiceAccount
  name: opentelemetry-collector
  namespace: default
EOF
Configure OpenSearch
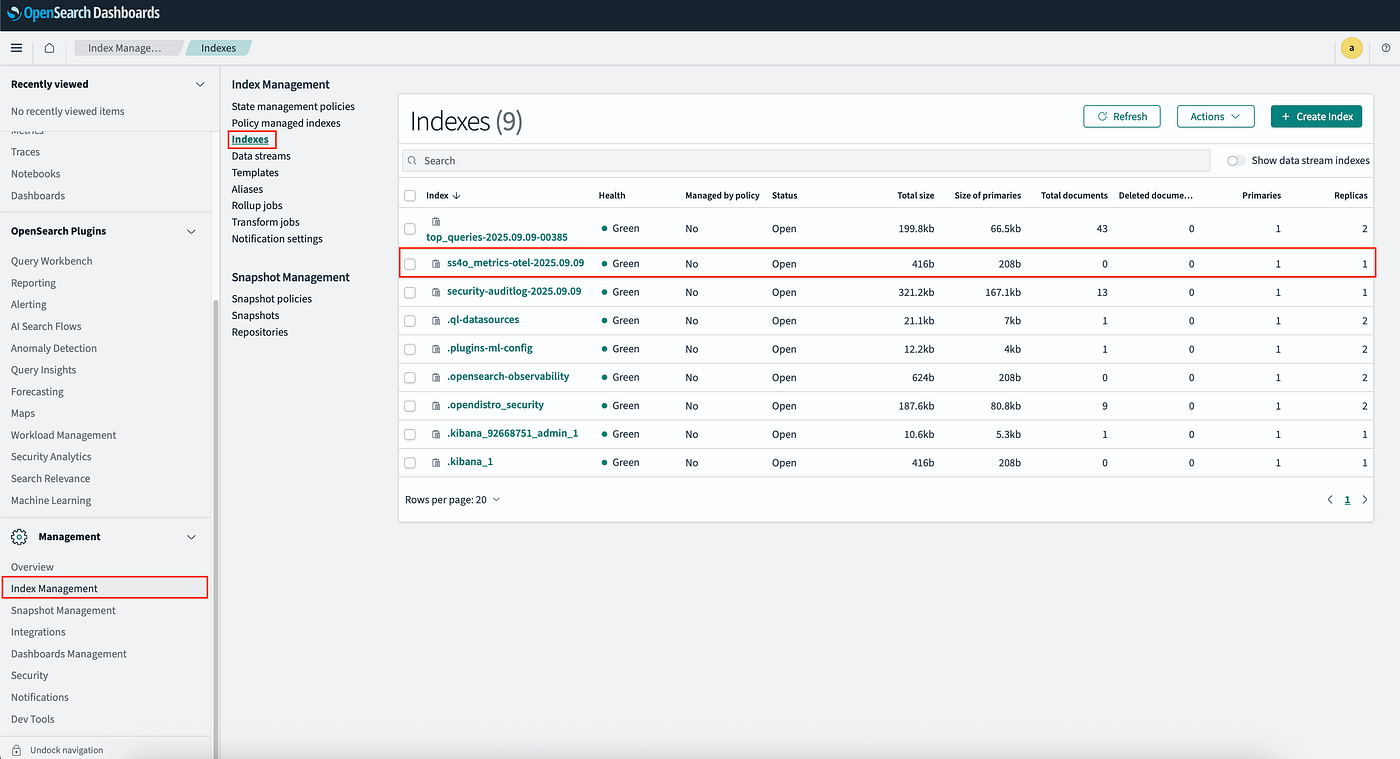
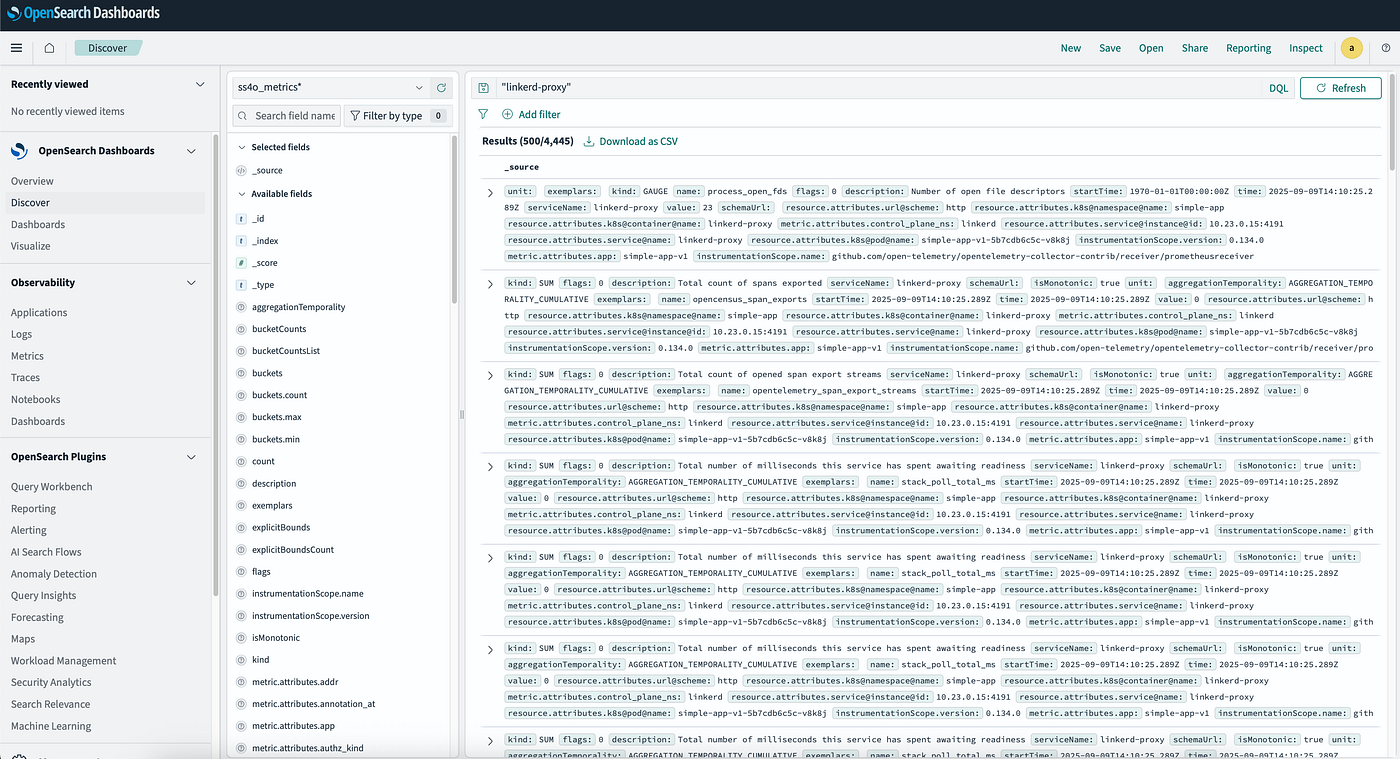
Once deployed, a new index will be created with the following format: ss4o_metrics-otel-%{yyyy.MM.dd}.
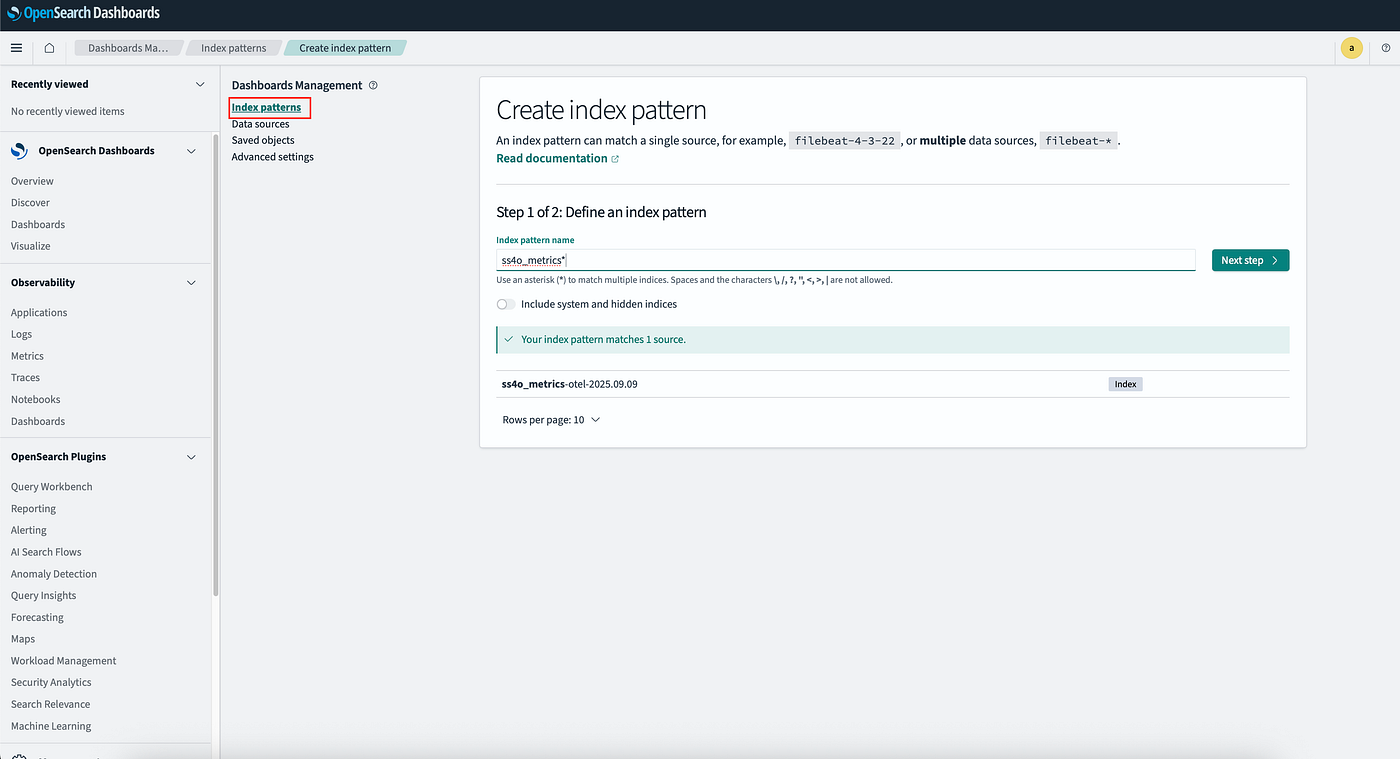
Create a new index pattern in OpenSearch Dashboards so the data can be queried and visualized.
Finally, you are going to be able to analyze the contents of the index directly from the Discover section.
Reference:
- OpenSearch Announcement: https://aws.amazon.com/blogs/opensource/stepping-up-for-a-truly-open-source-elasticsearch/
- re:Invent 2024 OpenSearch Session: https://reinvent.awsevents.com/content/dam/reinvent/2024/slides/ant/ANT329_Whats-new-in-search-observability-and-vectors-in-OpenSearch-Service-.pdf
- OpenSearch Official Documentation: https://docs.opensearch.org/latest/about/
- OpenTelemetry Collector: https://opentelemetry.io/docs/platforms/kubernetes/helm/collector/
- Data Prepper: https://docs.opensearch.org/latest/data-prepper/

👋 If you find this helpful, please click the clap 👏 button below a few times to show your support for the author 👇
🚀Join FAUN Developer Community & Get Similar Stories in your Inbox Each Week
메타데이터
- post_id
- 2b0a503e10f6
- slug
- observability-with-opentelemetry-linkerd-prometheus-and-opensearch-2b0a503e10f6
- url
- https://faun.pub/observability-with-opentelemetry-linkerd-prometheus-and-opensearch-2b0a503e10f6
- canonical_url
- https://faun.pub/observability-with-opentelemetry-linkerd-prometheus-and-opensearch-2b0a503e10f6
- author_url
- https://medium.com/@gtrekter
- status
- ok
- fetched_at
- 2026-06-21 07:44:09