The Data Oligarchs Just Had Their Worst February in Memory.
When Anthropic’ s legal AI tool triggered a $285 billion single-day rout and “software-mageddon” wiped $1 trillion from the sector in a…
The Data Oligarchs Just Had Their Worst February in Memory. Here’s Why MSCI Is Different from Everyone Else in the Blast Radius.
When Anthropic’ s legal AI tool triggered a $285 billion single-day rout and “software-mageddon” wiped $1 trillion from the sector in a week, the market treated every “data business” the same way. That was a category error and understanding why is one of the most important structural distinctions in financial markets right now.
By Mohsin Abdul Qadir | February 17, 2026, | Strategy & Markets
I want to talk about something that happened in the first two weeks of February 2026 that I do not think has been properly analysed yet not at the structural level that matters to investment committees and C-suite strategy teams.
In the span of ten trading days, the financial data and analytics sector was taken out to the woodshed, and the numbers were not subtle. Bloomberg characterized the first major leg of the selloff as a $285 billion rout “across the software, financial services and asset management sectors.” Reuters, via Channel NewsAsia, reported that the S&P 500 software and services index had shed approximately $1 trillion in market value since January 28 a move the financial press promptly dubbed “software-mageddon.”
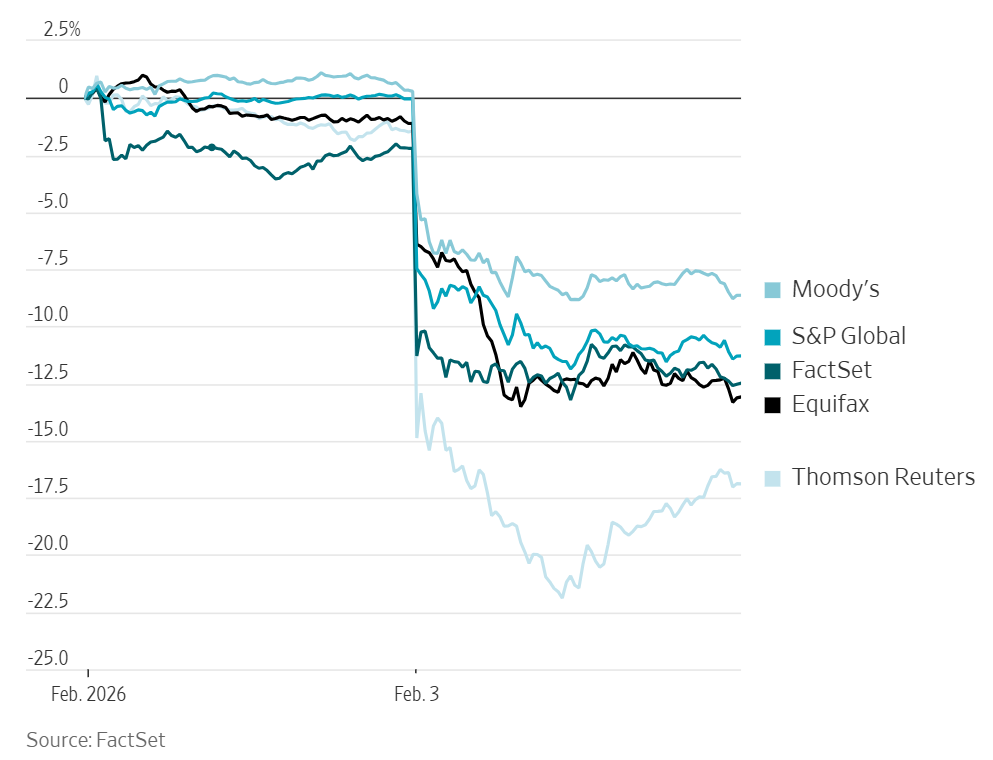
The trigger, specifically, was Anthropic unveiling a legal automation tool. That specific product announcement was enough to reprice the entire white-collar workflow stack the businesses that sit between raw information and regulated action.
In Europe, the carnage was immediate and precise: RELX fell ~14%, London Stock Exchange Group ~13%, Wolters Kluwer ~13%, and Thomson Reuters ~18% in a single session. On the American side: Gartner fell 31% in a single session on February 3rd after guiding to zero revenue growth in 2026. S&P Global dropped 18% in premarket and closed 10% after its 2026 EPS guidance landed below consensus at $19.40–$19.65 against a $19.96 expectation. Moody’s fell ~11% in sympathy. FactSet dropped 10%. Verisk declined 5%. Nasdaq Inc. fell 4.4%.
MSCI, caught in the blast radius, declined somewhere between 3% and 8% depending on the trading day you are measuring.
Here is my thesis: the market was right to be afraid, but it shot at all targets equally when the structural situation across these companies is radically different. The February selloff was simultaneously rational at the sector level and deeply undiscriminating at the individual stock level. Nowhere is that distinction starker, or more consequential, than with MSCI.
Let me show you why.
The Anthropic Trigger: What Actually Happened, Day by Day
Before the structural analysis, let me be precise about the sequence of events because the narrative has gotten compressed in ways that obscure its meaning.
February 3, 2026, The Gartner Shock. Gartner beat Q4 revenue and earnings estimates. It did not matter. The company guided to flat-to-negative 2026 revenue ($6.46B projected vs. $6.51B the prior year) and guided EPS 6.6% below 2025’s result. The market read this as: AI is already eating Gartner’s lunch. The stock fell 31% intraday. For context, Gartner had already been cut roughly in half over the preceding 52 weeks. This was an already-wounded company confirming the wound was real. For investors who had been watching, this was not surprised it was confirmation.
February 3–7, 2026 The Anthropic Legal Tool Trigger. Anthropic released Claude features targeting enterprise legal and professional workflow automation. Fortune reported that FactSet fell 10% on the AI competition fear this triggered. The fear was existential and explicit: if an LLM can synthesize earnings data, generate competitive landscapes, and run financial screens all tasks that FactSet’s terminal charges premium subscription fees to perform then the revenue model faces structural disruption.
February 6, 2026, The European Contagion. The Guardian’s headline framed it directly: data-driven companies “were smashed.” RELX −14%, LSE −13%, Wolters Kluwer −13%, Thomson Reuters −18% in a single session. Bloomberg’s $285 billion figure captures the single-day magnitude. This was not a US-specific phenomenon it was a global repricing of the assumption that professional workflow software is durably defensible.
February 10–12, 2026 The S&P Global Precision Strike. S&P Global reported solid Q4 2025 results revenue up 9% year-over-year. The Indices segment surged 14% on higher asset-linked fees. But 2026 guidance came in below consensus, and management cited higher capex required to “pivot to an AI-first platform.” The market interpreted this as margin compression without a visible payback horizon. S&P Global’ s market cap, near $145B+ at its recent peak, fell sharply on the week.
Three overlapping events. A single sector narrative. And MSCI caught in the crossfire despite having a fundamentally different economic structure from most of the names mentioned above.
The Category Error That Explains the Opportunity
The market treated “financial data company” as a single category facing a single threat. This is analytically imprecise in a way that creates consequences either losses if you sell MSCI alongside Gartner, or opportunity if you understand why they are structurally different.
There are two fundamentally different things companies in this space sell:
Type A: Information and Analysis. Packaged insights, research, and synthetic intelligence. You pay for this because it saves analyst-hours and reduces the cost of producing an informed judgment. Gartner sells this. FactSet sells a meaningful portion of this. These products are, functionally, expensive cognitive labour and yes, AI can replace cognitive labour. This is a legitimate, structural, long-term threat to Type A businesses.
Type B: Coordination Infrastructure. Standards, benchmarks, and certification that serve as the organizing grammar of global capital markets. You pay for this not because it gives you information you could not find elsewhere, but because everyone else is using the same standard, and deviating from it carries its own specific, exceptionally large costs. Dislodging a standard means dislodging everyone downstream who relies on it.
MSCI’s Index business sells Type B.
The difference matters enormously because AI can replicate analysis. It cannot at least not within the 3–5-year investment horizon that matters for most capital allocators replicate coordination equilibria. And that, in structural terms, is what MSCI’s index franchise fundamentally is.
MSCI’s Actual Numbers: What the 2025 10-K Tells You
Let me anchor this analysis in verified financial facts rather than narrative impressions, because the numbers themselves tell the structural story.
MSCI reported $3.134 billion in total operating revenues for FY2025. Here is the segment breakdown and critically the EBITDA margin for each:
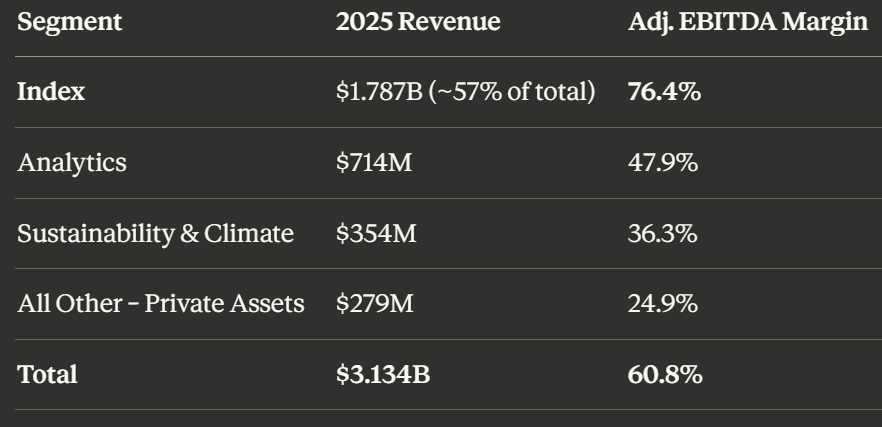
EBITDA Martins Per MSCI Product Segment (Source: Factset)
A 76.4% EBITDA margin in the Index segment. Let me put that in context: that is not a technology margin, and it is certainly not an “information services” margin in any ordinary sense. That is a toll bridge margin the kind of economics you earn when you own infrastructure that the entire institutional investment ecosystem must cross.
These margins are the quantitative signature of one of two things: either a durable structural moat, or an industry about to be structurally deflated by technological disruption. Last week’s selloff was the market flirting with the second interpretation.
But there is a second number from the 10-K that is even more telling: retention rates for the year ended December 31, 2025, were 95.9% (Index) and 94.4% (Total).
In any commoditizing market, retention is where the truth leaks first. When a standard starts eroding when buyers start believing they can self-supply you see it in cancellations before you see it in margins. The fact that Index retention sits at 95.9% in a year of maximum AI anxiety is not a lagging indicator of a past moat. It is a live signal about the present stickiness of a coordination standard.
The AUM Flywheel: MSCI’s Most Durable Economic Structure
Here is the number that, in my view, is the single most important figure in MSCI’s disclosure for understanding its competitive position:
AUM in ETFs linked to MSCI equity indexes: $2.3407 trillion on December 31, 2025, up from $1.7247 trillion a year prior.
That is a $616 billion increase in a single year in the AUM base on which MSCI earns asset-based licensing fees. And critically, asset-based fees were 43.1% of Index segment operating revenues in 2025 meaning a meaningful portion of MSCI’s most profitable revenue line scales automatically with global equity market capitalization.
This is not a SaaS business model, and that distinction is crucial to understanding why MSCI was misclassified in last week’s selloff.
The typical workflow software business earns per-seat subscription fees that a buyer can potentially reduce by deploying AI to reduce the number of human seats using the software. That is precisely the model that faces AI disruption pressure, and it is the model that explains why Gartner, FactSet, and similar companies are legitimately repricing.
MSCI’s Index revenue architecture is different. Asset-based fees do not go down because BlackRock buys fewer analyst seats. They go up every time global equity markets appreciate, and they scale with every dollar of passive AUM growth. This is a revenue architecture that AI cannot attack through seat displacement.
The platform logic driving this flywheel is straightforward: more asset managers adopt MSCI indexes → more ETF products and liquidity form around those indexes → more investor familiarity and institutional acceptance → higher switching costs → more adoption of MSCI indexes. The network effect here is not social it is gravitational.
The Switching Cost Is Not High. It Is Catastrophic.
I want to be precise about why MSCI’s index franchise is structurally different from a normal software business with “high switching costs,” because the distinction matters.
Consider what would be required for BlackRock to switch iShares MSCI Emerging Markets ETF one of the most traded ETFs in the world away from the MSCI benchmark:
-
Notify every LP globally and renegotiate mandate definitions in investment policy statements
-
Accept massive tracking error against the competitive set of EM funds that remain benchmarked to MSCI with every deviation requiring explanation to clients and consultants
-
Trigger potentially billions of dollars in forced transactions as the fund rebalances to the new index composition
-
Convince institutional due diligence committees who have MSCI embedded in their compliance frameworks and benchmark policy to approve a non-standard standard
-
Destroy the brand equity of “iShares MSCI” which is the literal product name and a core part of the fund’s commercial identity
This is not a switching cost in the ordinary sense. It is a switching catastrophe. And the important structural asymmetry is this: the larger the AUM benchmarked to MSCI, the more catastrophic the switch becomes. MSCI’s moat grows with the very AUM it monetizes.
MSCI reported approximately 6,800 clients across 100+ countries as of December 31, 2025. The job these clients are hiring MSCI to do is not “give us data.” It is “defend our investment process under audit, regulatory scrutiny, and LP due diligence.” That job-to-be-done is not replaced by an AI that can draft faster it requires a certified standard with legal standing, methodology documentation, and global institutional acceptance.
However, and intellectual honesty requires acknowledging this MSCI itself disclosed in its 10-K that “advances in AI and cloud platforms have also lowered the barriers for clients to build capabilities internally.” That is the company’s own language about the threat it faces. The moat is real, but it is not invulnerable, and management knows it.
The BlackRock Concentration: The Most Important Risk Nobody Is Pricing
There is a number in the 2025 10-K that deserves more attention than it typically receives:
MSCI’s largest client organization BlackRock accounted for 10.8% of consolidated operating revenues in FY2025, with 96.5% of that revenue tied to asset-based fees on BlackRock products based on MSCI indexes.
Let me translate that into strategic terms. Ten percent of MSCI’s total revenue comes from fees on products that BlackRock has built on top of MSCI’s standards and all of it is asset-based, meaning BlackRock’s continued willingness to build its flagship index product line on MSCI infrastructure is not just a client relationship, it is an existential dependency.
The standard optimistic framing: BlackRock cannot switch. The switching cost analysis above applies with maximum force to BlackRock, which has built more iShares products on MSCI standards than any other institution. Switching would be commercial self-destruction.
The less comfortable question: in a world where AI genuinely lowers the cost of building and maintaining proprietary index infrastructure, at what point does BlackRock’s calculus shift? At what point does $335M+ in annual fees paid to MSCI (10.8% of $3.1B) justify a multi-year investment in internal benchmark construction?
My view: the switching cost remains too high to make this rational in the 3–5-year horizon, because the problem is not computation cost (which AI can lower) but coordination legitimacy (which AI cannot manufacture). A BlackRock proprietary benchmark would launch with zero of the institutional recognition, LP acceptance, regulatory standing, and liquidity ecosystem that MSCI World has accumulated over fifty years. But this is the right question to keep asking every year.
Where AI Actually Threatens MSCI Honestly
The intellectually honest version of this analysis requires separating the AI threat by segment, because MSCI is not a monolithic business.
Index (~57% of revenue): Minimal near-term AI threat. The value is coordination, not computation. AI can construct and back test an index trivially, in fact. What it cannot do is make that index the standard that institutional capital, regulators, and LPs coordinate around. The switching cost analysis is the moat here, and it is structural.
The longer-horizon risk: If AI enables major asset managers to construct, back test, and validate custom indices at near-zero cost, and regulators simultaneously accept custom benchmarks as valid for compliance purposes, the standardization premium erodes. This is a 7–10-year risk, not a 2026–2028 risk. But it is worth watching.
Sustainability & Climate (~11% of revenue): Real AI threat, most urgent. MSCI’s 2025 Sustainability & Climate segment net sales were down 47.1% versus 2024. That is a significant deceleration signal, and it arrives at exactly the moment when AI-native ESG scoring tools are becoming more capable. A meaningful portion of ESG rating is text-mining-intensive analysing company disclosures, controversy indicators, policy alignment. These are exactly the tasks LLMs perform well and cheaply. The competitive pressure here is not theoretical.
MSCI’s defines in ESG must shift from “we have scale in data collection” to “we have regulatory standing as a certified methodology.” EU SFDR, the EU Taxonomy, and MiFID II sustainability requirements create compliance mandates that specifically reference benchmark administrators making MSCI’s regulatory standing a moat rather than just a credential. But that moat is contingent on regulatory design, not structural.
Analytics / Barra (~23% of revenue): Competitive but defensible. The Barra factor models carry fifty years of IP, deep historical data, and strong embedded workflow. AI raises the ceiling here richer factor construction, NLP-powered earnings analysis but also lowers the competitive barrier for new entrants building AI-native risk platforms. This is a 3.5-star castle: valuable IP, but in a competitive market that is actively innovating around it.
The summary verdict: AI directly threatens 34% of MSCI’s business (ESG + parts of Analytics) and poses minimal near-term threat to 57% (Index). That is a materially different situation from Gartner, where AI threatens the core product directly, or from FactSet, where the terminal workflow model is the target.
The Private Markets Bet: MSCI’s Most Important Move of the Decade
I want to spend time on the corporate strategy play that, in my view, has been systematically underappreciated in the coverage of last week’s selloff.
MSCI’s acquisition of Burgiss in 2023 for approximately $697 million is the most strategically significant move the company has made in a decade.
Burgiss is the performance data network for private equity a database of LP and GP performance records that underpins benchmarking in private markets. Here is the strategic logic: MSCI built its public markets moat by becoming the standard that institutional investors, regulators, consultants, and LPs coordinate around when measuring international equity performance. That took fifty years and enormous accumulated legitimacy.
Private markets private equity, private credit, private real assets represent a $10+ trillion asset class that currently has no equivalent standard. Pension funds genuinely cannot clearly answer “is our PE program outperforming?” because there is no MSCI equivalent for private equity. The benchmarking problem is unsolved, and the institutional demand for solving it is enormous.
MSCI, with Burgiss and its earlier acquisition of Real Capital Analytics (commercial real estate transaction data, ~$950 million in 2021), is deliberately attempting to replicate the standardization game in private markets. The potential payoff recurring, asset-linked fees on private market benchmarks is a multi-decade revenue opportunity.
The transaction cost economics logic for why MSCI had to acquire, not partner: Burgiss’s private market performance database is a highly specific asset. The LP and GP data networks depend on confidentiality, trust, and long-term relationship dynamics that would have given Burgiss extraordinary hold-up leverage over MSCI at every contract renewal. A contractual alliance would have created the very incompleteness problem it sought to solve. Ownership was the only solution.
The risk: execution. Building a coordination standard in private markets requires solving the Chicken-and-Egg problem getting enough LPs, GPs, and consultants to coordinate on Burgiss/MSCI as the benchmark before Preqin or PitchBook/Morningstar achieves equivalent critical mass. This is a race, and the outcome is not guaranteed. But MSCI enters it with the most important asset: institutional legitimacy as an existing standard-setter.
The Revenue Architecture Trap (Why S&P DJI and FTSE Russell Won’t Attack MSCI)
Here is a game-theoretic point that I rarely see articulated in mainstream coverage.
The most credible potential disruptors of MSCI’s index business are S&P Dow Jones Indices and FTSE Russell. Both have the data infrastructure, the institutional relationships, and the technical capability to attempt aggressive market share raids. So why don’t they?
Because they face the revenue architecture trap.
S&P DJI’s most profitable business is the S&P 500 franchise which is itself an index standard with asset-based fees and the exact same structural moats that protect MSCI. If S&P DJI initiates a price war in EM or factor index fees, it signals to the market that index standards are commodities which immediately destroys the premium pricing justification for its own franchise. FTSE Russell faces precisely the same constraint.
This is not coincidence. This is the Nash Equilibrium of a market where all major players are incumbents in the same structural game. The rational strategy and the observed strategy are co-opetition: each player prices at a premium, maintains methodology differentiation, and avoids the signalling that would destroy collective pricing power.
The practical implication: MSCI’s most structurally credible competitors are themselves structurally constrained from mounting the attack that investors feared last week. The threat to MSCI’s core business is not a rival index provider with a slightly better algorithm. It is a fundamentally different business model the kind that an AI-enabled large asset manager building proprietary standards might represent. And that risk, while real, is long duration.
What a 5-Star Castle Looks Like vs. What the Market Priced Last Week
Let me put this in structural terms that I think clarify the investment thesis.
There is a useful conceptual distinction between what I call a 5-Star Castle and a 1-Star Structural Trap. Soft drinks are a castle: oligopolistic, low capital intensity, durable brand moats, no technological disruption risk to the core formula. Airlines are a trap: commoditized product, labour intensity, fuel cost exposure, regulatory entanglement, and no sustainable pricing power.
MSCI’s Index business is a 5-Star Castle. The industry structure high switching costs, coordination standard moat, asset-based fee monetization, oligopolistic rivalry, regulatory entrenchment is among the most structurally attractive in financial services.
MSCI’s ESG and Analytics businesses are 3-Star Castles structurally attractive but contested, with genuine AI exposure that warrants monitoring.
Last week, the market repriced MSCI as though all of it was a 2-Star Castle. The core claim of this analysis is that this repricing was category confusion, driven by temporal contagion from genuinely threatened peers, and that the structural divergence will reassert itself over the 3–5-year horizon that patient capital operates on.
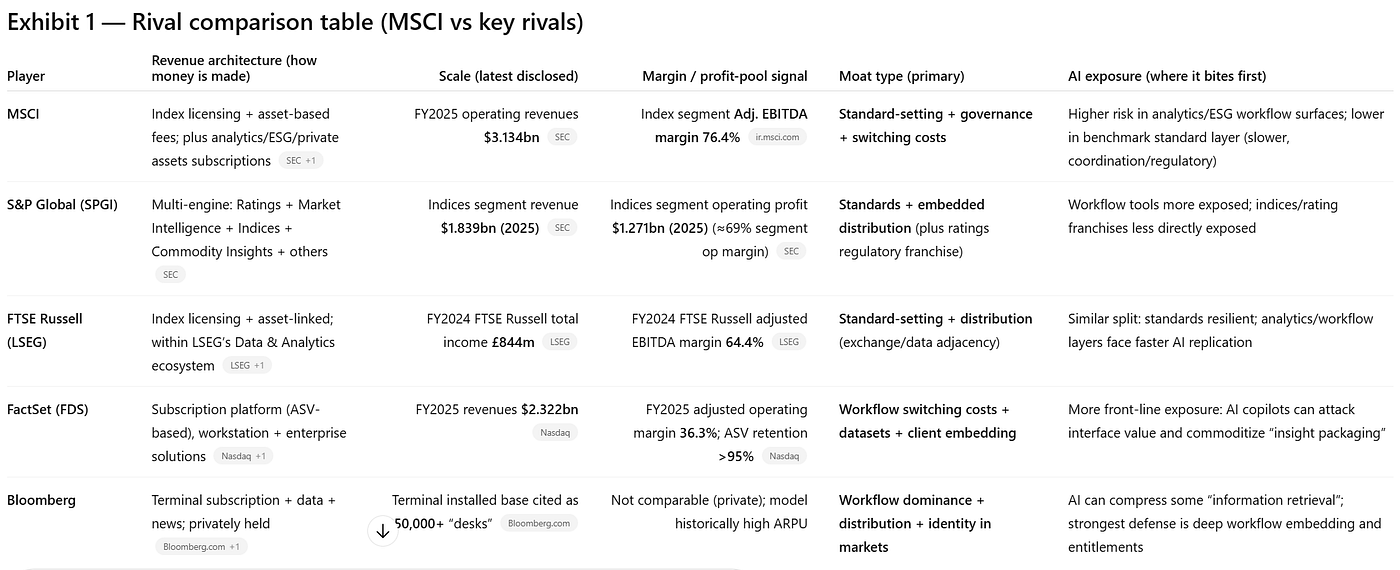
Rival Comparision of MSCI vs peers
The Three Scenarios and What to Watch
If I were running a position in MSCI, or deciding whether to initiate one, here is the scenario framework I would use grounded in the actual business dynamics rather than macro narratives about AI:
Base Case (60% probability): Castle holds, tooling reprices.
Index remains sticky. Asset-based fees continue compounding as global equity AUM grows. The $2.34 trillion ETF AUM base continues generating fee revenue that scales with market performance. Analytics and ESG face pricing pressure as AI reduces perceived differentiation in workflow tools, but retention remains above 93% and MSCI shifts delivery to AI-enhanced interfaces. Revenue reaches $3.5–3.8B by 2028; Index EBITDA margin holds at 73–76%.
What to watch: Index retention staying above 94%. ESG cancellation rates. BlackRock asset-based fee renegotiation cadence.
Bull Case (25% probability): AI increases the value of trusted inputs.
AI agents increase institutional demand for high-quality, rights-cleared, auditable datasets and certified benchmark governance making MSCI’s standard-setting role more central, not less. Private markets benchmarking via Burgiss achieves coordination tipping: major pension consultants begin requiring Burgiss/MSCI PE benchmarks in manager evaluation, replicating the public markets flywheel in a $10T asset class. Revenue reaches $4.2–4.8B by 2028; significant multiple re-rating.
This is the “data is the bottleneck” world and it is not implausible.
Bear Case (15% probability): Self-sufficiency becomes credible at scale.
BlackRock or Vanguard launches proprietary benchmark frameworks for core ETF products, reducing asset-based fee exposure. AI-native index construction tools reach institutional acceptance before MSCI can build equivalent AI capabilities internally. Regulatory intervention treats index providers as financial market infrastructure subject to fee caps. MSCI revenue growth stalls at 5–7%; Index EBITDA margin compresses toward 60%.
The bear case requires BlackRock to destroy iShares brand equity and create a fiduciary nightmare. The probability is low but non-trivial given the AUM concentration dynamic.
The Strategic Imperatives for MSCI Management
If I were sitting in MSCI’s boardroom, here is what I would be prioritizing for the next three to five years:
Win the private markets standards war. The Burgiss acquisition is the beachhead. This requires subsidizing initial adoption to solve the Chicken-and-Egg problem taking a short-term revenue hit to achieve the coordination tipping that creates the long-term moat. The window for establishing standard status in private markets is open right now. It will not remain open indefinitely.
Defend ESG through regulatory entrenchment, not data volume. As AI commoditizes text-based ESG scoring, the moat must shift to regulatory-facing methodology SFDR PAI alignment, EU Taxonomy mapping, TCFD scenario compliance. These are the ESG functions that a regulator requires you to do specifically with a certified benchmark administrator. Build the regulatory standing; let others compete on the data collection.
Lead AI adoption in your own products before a startup does it and calls it an MSCI alternative. The firm with fifty years of historical data, regulatory standing, and 6,800 institutional client relationships should be the winner of AI augmentation in this space. The risk is not that AI destroys MSCI it is that MSCI moves slowly, and a well-funded AI-native competitor claims the analytics positioning while MSCI defends the index core. The right response is not defensive denial; it is aggressive product cannibalization on your own terms.
Deepen the bundle flywheel. Clients using both Barra risk models and MSCI indexes have compounded switching costs changing either requires changing the integrated workflow. Price the bundle to maximize adoption breadth, accepting lower per-unit analytics revenue in exchange for higher combined entrenchment.
Monitor the BlackRock relationship with strategic attention. At 10.8% revenue concentration with 96.5% asset-based, this is a relationship that requires continuous value demonstration. MSCI should be asking: what is the next layer of value we can deliver to BlackRock that makes their dependence on our standards deeper, not just larger?
The Bottom Line
The February 2026 selloff in data providers was real, partially rational, and deeply undiscriminating.
Bloomberg’s $285 billion single-day rout and Reuters’ $1 trillion sector loss in a week were genuine repricing events for genuinely threatened businesses. Gartner’s pain is existential: it sells packaged analysis in a world where analysis is being commoditized. FactSet faces meaningful structural pressure on the terminal and workflow business that AI agents can partially replicate. Thomson Reuters down 18%, RELX down 14% these reflect legitimate questions about the durability of workflow software premiums.
But MSCI is not in the same structural category as any of those businesses. Its Index franchise 57% of revenue, 76.4% EBITDA margins, 95.9% retention, $2.34 trillion in benchmarked ETF AUM is built on coordination infrastructure, not cognitive labour. And coordination infrastructure is not what AI is attacking.
The market threw MSCI into the same basket as Gartner because both companies have “data” in their business description and both appear in the same sector indices. The structural analysis says they do not belong in the same basket. One sells analysis that AI can replicate. The other maintains the standard that the entire global institutional investment system must coordinate around to function.
That gap between market perception and structural reality is, historically, where the most durable investment opportunities live.
The February selloff did not change MSCI’s castle. It just temporarily lowered the drawbridge fee.
— -
The author is an investment management professional with a keen focus on technology, infrastructure and procurement and vendor strategy and EMBA candidate at Chicago Booth Business School. He applies rigorous competitive strategy frameworks Porter’s Five Forces, Value Stick analysis (Brandenburger & Stuart), Transaction Cost Economics (Williamson), Game Theory (Nash Equilibrium), and Platform Economics to investment and competitive strategy questions. This article represents analytical opinion, not investment advice. Verify all figures independently before making investment decisions.
— -
— -
Appendix:
-
Bloomberg News. “Anthropic AI Tool Sparks Selloff from Software to Broader Market.” Bloomberg, February 4, 2026. [Cited for $285 billion single-day rout figure and sector characterization.]
-
Reuters. “US Software Stocks Slammed on Mounting Fears Over AI Disruption, Lose $1 Trillion in Week.” Channel NewsAsia, February 5, 2026 (updated February 6, 2026). https://www.channelnewsasia.com/business/us-software-stocks-slammed-mounting-fears-over-ai-disruption-lose-1-trillion-week-4895706 [Cited for $1 trillion market value loss figure and “software-mageddon” characterization.]
-
Kollewe, Julia. “Anthropic’s Launch of AI Legal Tool Hits Shares in European Data Companies.” The Guardian, February 3, 2026. [Cited for European selloff figures: RELX −14%, LSE −13%, Wolters Kluwer −13%, Thomson Reuters −18%.]
-
Bylund, Anders. “Why Gartner Stock Fell 31% This Morning.” The Motley Fool, February 3, 2026. https://www.fool.com/investing/2026/02/03/why-gartner-stock-fell-31-this-morning/ [Cited for Gartner single-session decline and guidance miss details.]
-
Nolan, Beatrice. “Anthropic’s Claude Triggered a Trillion-Dollar Selloff. A New Upgrade Could Make Things Worse.” Fortune, February 6, 2026. https://fortune.com/2026/02/06/anthropic-claude-opus-4-6-stock-selloff-new-upgrade/ [Cited for FactSet −10% and Anthropic Claude Cowork/legal tool trigger.]
-
“Moody’s and FactSet Stocks Slide on S&P Global’s Weak 2026 Outlook.” Investing.com, February 2026. https://www.investing.com/news/stock-market-news/moodys-and-factset-stocks-slide-on-sp-globals-weak-2026-outlook-4496367 [Cited for Moody’s −11%, Verisk −5%, Nasdaq −4.4%, contagion dynamics.]
-
“S&P Global Forecasts 2026 Profit Below Estimates, Shares Plunge.” Reuters via Investing.com, February 10, 2026. https://www.investing.com/news/economy-news/sp-global-forecasts-2026-profit-below-estimates-shares-plunge-4496477 [Cited for S&P Global EPS guidance miss: $19.40–$19.65 vs. $19.96 consensus, premarket −18%.]
-
“Data Provider Stocks Tumble on AI Competition Fears.” The Wall Street Journal Live Coverage, February 3, 2026. https://www.wsj.com/livecoverage/stock-market-today-dow-sp-500-nasdaq-02-03-2026/card/data-provider-stocks-tumble-on-ai-competition-fears-C97KvtPTsT9H3joFwS7C [Cited for intraday data provider selloff characterization.]
-
MSCI Inc. Annual Report on Form 10-K for the Fiscal Year Ended December 31, 2025. Filed February 6, 2026. U.S. Securities and Exchange Commission. [Primary source for all MSCI financial figures: revenues $3.134B; Index margin 76.4%; total margin 60.8%; retention 95.9%/94.4%; ETF AUM $2.3407T; BlackRock concentration 10.8%; asset-based fees 43.1% of Index revenue; ESG net sales −47.1%; ~6,800 clients; AI/self-sufficiency risk disclosure.]
-
MSCI Inc. Burgiss Acquisition Press Release, August 2023. [Cited for acquisition price ~$697M and strategic rationale.]
-
MSCI Inc. Real Capital Analytics Acquisition Press Release, 2021. [Cited for acquisition price ~$950M.]
-
“S&P Global Market Cap 2012–2025.” MacroTrends, accessed February 2026. https://www.macrotrends.net/stocks/charts/SPGI/s-p-global/market-cap [Cited for market cap context.]
-
Financial Times. “Elliott Management Builds Stake in London Stock Exchange Group.” Financial Times, February 2026. [Cited for activist dynamics at LSEG as adjacent competitive signal.]
-
Financial Times. “Why Elliott Bet That LSEG Could Weather AI Storm.” Financial Times, February 2026. [Cited for broader AI narrative in European data providers.]
-
“AI Bear Case Continues to Weigh on Information Services Stocks.” Morningstar Equity Research, February 2026. https://www.morningstar.com/stocks/ai-bear-case-continues-weigh-information-services-stocks [Cited for analyst buy-side commentary on AI threat differentiation.]
-
Porter, Michael E. Competitive Strategy: Techniques for Analyzing Industries and Competitors. New York: Free Press, 1980. [Framework: Five Forces industry structure analysis.]
-
Brandenburger, Adam M., and Harborne W. Stuart Jr. “Value-Based Business Strategy.” Journal of Economics & Management Strategy 5, no. 1 (1996): 5–24. [Framework: Value Stick WTP, Cost, and Wedge analysis.]
-
Christensen, Clayton M. The Innovator’s Dilemma: When New Technologies Cause Great Firms to Fail. Boston: Harvard Business School Press, 1997. [Framework: Low-end vs. sustaining disruption classification.]
-
Williamson, Oliver E. The Economic Institutions of Capitalism: Firms, Markets, Relational Contracting. New York: Free Press, 1985. [Framework: Transaction Cost Economics asset specificity, hold-up, make vs. buy decisions.]
-
Eisenmann, Thomas, Geoffrey Parker, and Marshall W. Van Alstyne. “Strategies for Two-Sided Markets.” Harvard Business Review 84, no. 10 (October 2006): 92–101. [Framework: Platform economics, Chicken-and-Egg, subsidy side vs. money side.]
-
European Securities and Markets Authority (ESMA). Benchmark Regulation (EU) 2016/1011. Brussels: ESMA, 2016. [Cited for regulatory barrier to entry analysis and benchmark administrator status.]
-
Reuters. “Big Tech’s $600 Billion Spending Plans Exacerbate Investors’ AI Headache.” Channel NewsAsia, February 2026. [Cited for broader AI investment cycle context and investor sentiment.]
— -
© 2026. All rights reserved. Views are those of the author and do not constitute investment advice. All financial figures sourced from MSCI’s SEC-filed 10-K (February 6, 2026) and cited third-party reporting. Verify independently before acting.
메타데이터
- post_id
- 2bc2419aba94
- slug
- the-data-oligarchs-just-had-their-worst-february-in-memory-2bc2419aba94
- url
- https://medium.com/@mohsinabdulqadir/the-data-oligarchs-just-had-their-worst-february-in-memory-2bc2419aba94
- canonical_url
- https://medium.com/@mohsinabdulqadir/the-data-oligarchs-just-had-their-worst-february-in-memory-2bc2419aba94
- author_url
- https://medium.com/@mohsinabdulqadir
- status
- ok
- fetched_at
- 2026-06-20 20:29:01




