Jupyter Notebook for Beginners: From Zero to First Prediction
How to Install, Write, and Run Machine Learning Code on Real Data
Jupyter Notebook for Beginners: From Zero to First Prediction
How to Install, Write, and Run Machine Learning Code on Real Data

Photo by AltumCode on Unsplash
Jupyter Notebook is an open-source web application that allows you to write and run code, visualize data, and add explanations — all in one place.
It is widely used for — Data Science, Machine Learning, Python Programming, Data Visualization as well as Research and Education.
Unlike traditional code editors, Jupyter Notebook lets you combine — Code, Text, Images, Charts and Mathematical formulas inside a single interactive document.
Do you know why it is called “Jupyter”?
The name actually comes from three programming languages:
Ju → Julia
Pyt → Python
R → R
Although it started with these languages, Jupyter now supports over 40 languages.
How Jupyter Notebook Works?
Two concepts are essential to understanding Jupyter : Cells and Kernel.
What is Cells?
A cell is a block of content. Notebooks are made of cells stacked vertically. There are mainly two types of cells:
1. Code Cell — Used to write and run code.
print("Hello, World!")2. Markdown Cell — Used to write text, headings, lists, and documentation.
# My First Notebook
This is a beginner tutorial.
What is Kernel
The kernel is the “engine” that runs your code. Each notebook connects to a kernel that keeps track of all your variables and outputs as you work
To install Jupyter Notebook, you’ll need Python installed on your system.
Installation of Jupyter Notebook
- Install Python
- Install PIP
- Install Jupyter using PIP
1. Install Python
Ensure Python is installed on your computer (version 3.3 or higher is recommended). You can check this by running the following command in the command prompt.
python --versionDownload Python from python.org if it’s not already installed.
2. Install PIP
pip is the package installer for Python. Steps for installing pip on your windows —
- Download PIP
- Install PIP
- Add pip to environment variables
Download PIP
Step 1 — Download the get-pip.py (https://bootstrap.pypa.io/get-pip.py) file and store it in the same directory as Python is installed.
Step 2 — Run the command given below:
python get-pip.pyAnd wait through the installation process. After finishing installation, verify the Installation, by checking version:
pip -V
or
pip --version
Step 3 — Add PIP To Windows Environment Variables

If you are facing any path error like the given image, then you can follow the following steps to add the pip to your PATH:
- Open the Control Panel.
- Go to System and Security > System.
- Click on Advanced system settings on the left side.
- In the dialog box, select Environment Variables.
- Under System Variables, locate and double-click the PATH variable.
- Click New and enter the directory where pip is installed (e.g.,
C:\Users\<YourUsername>\AppData\Local\Programs\Python\PythonXX\Scripts). - Save the changes by clicking OK.
3. Install Jupyter using PIP
Open command prompt and run it:
pip install notebookGetting Started with Jupyter Notebook for Python
1. Launch Jupyter Notebook
Open your terminal or command prompt. Command to Launch Jupyter Notebook:
jupyter notebookThis will launch Jupyter, and your default browser should automatically open (or a new tab will be created) with the following URL: [http://localhost:8888/tree](http://localhost:8888/tree.).
When the notebook opens in your browser, the Notebook Dashboard will appear, displaying a list of notebooks, files, and subdirectories located in the directory where the notebook server was launched. Typically, you’ll want to start the notebook server in the top-level directory that contains your notebooks, which is often your home directory.

2. Create a New Notebook
In the Jupyter interface, click on the New button (top right corner). Select Python 3 to create a new notebook.

After that a new notebook will get created:

Give the name of your notebook replacing “Untitled”:

3. Writing Code in Jupyter Notebook
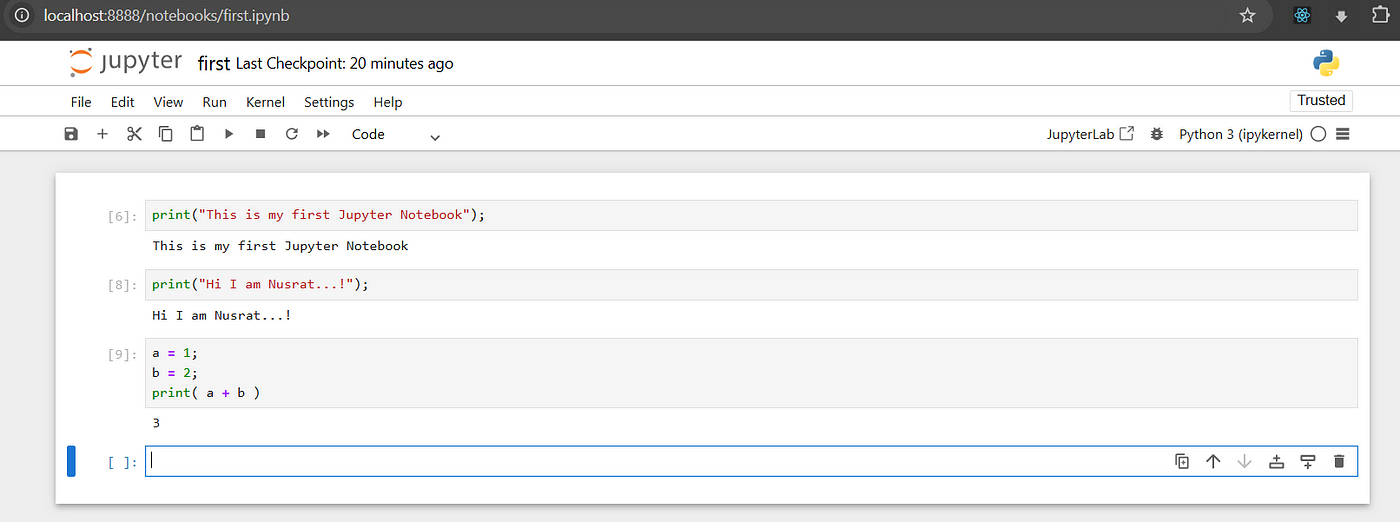
In Jupyter Notebook, the area you see is called a cell. A cell is where you write your code. You can have multiple cells in a notebook, and you can even run multiple cells simultaneously.
To execute a cell, you just select the cell and click the Run button that is in the row of buttons along the top. It’s towards the middle.
4. Prepare the Dataset
- Download a sample dataset in CSV format (e.g., COVID-19).
- Save the dataset in a convenient folder, such as
E:/DataSet/covidDataSet/
5. Write and Run Your Code with the Dataset
Here’s an example of Python code to load and explore a dataset using Pandas:
Before using panda, you need to install
*pandas*. You can install pandas directly from Jupyter Notebook or through the terminal/command prompt.
Option 1 — Install within Jupyter Notebook:
In a new cell in your Jupyter Notebook, run the following command:
*!pip install pandas*
This will install pandas in your current environment.
Option 2 — Install via Terminal/Command Prompt:
If you’re working from the command line or terminal, you can install pandas globally or in your virtual environment by running:
*pip install pandas*
# Import necessary libraries
import pandas as pd
# Load the dataset (replace 'path_to_dataset' with the actual path)
dataset_path = "E:/DataSet/covidDataSet/country_wise_latest.csv"
data = pd.read_csv(dataset_path)# Display the first 5 rows of the dataset
print("First 5 rows of the dataset:")
print(data.head())
Copy and paste the code into a cell in your notebook. And run the code
Note: Must use your own dataset path in the
dataset_pathvariable of the given code.
— Finally, the head() method displays the first 5 rows of your dataset. By default, it shows 5 rows. However, if you want to view more or fewer rows, you can specify the desired number as an argument inside the parentheses. For example, head(10) will display the first 10 rows as well as head(3) will display the first 3 rows.

— If you use describe() method, it will give statistical insights, like count, mean and standard deviation.

— The isnull().sum() method checks for any missing data in the dataset.

Oops, I have used Pandas without introducing it! Let’s learn what pandas is:
Pandas is a Python library for manipulating and analyzing data. It is excellent for working with structured data. You can learn more about the library from **here. In addition to pandas, there are other libraries available in Python for data manipulation and analysis, such as — Numpy, Dask, and SciPy.**
Data Visualization
There are several libraries in Python for data visualization such as Matplotlib, Plotly, and Yellowbrick.
Let’s visualize data using Matplotlib:
Just like
*pandas, you have to install `matplotlib`* directly from Jupyter Notebook or through the terminal/command prompt.
Option 1 — Install within Jupyter Notebook:
In a new cell in your Jupyter Notebook, run the following command:
*!pip install matplotlib*
This will install
*matplotlib* in your current environment.
Option 2 — Install via Terminal/Command Prompt:
You can install
*matplotlib* globally or in your virtual environment by running following command from the terminal:
*pip install matplotlib*
Finishing installation, you need to import matplotlib and run the following codes for visualizing the death data for the last 7 countries in our aforementioned dataset:
import matplotlib.pyplot as plt
first_5 = data.tail(7)
first_5.plot(x='Country/Region', y='Deaths', kind="bar")
Output:

Fig.: Country/Region vs Death (by COVID)
You can learn details about matplotlib libraries from here.
Sharing Your Work
One of Jupyter’s biggest strengths is how easy it is to share.
Direct sharing: Send someone the .ipynb file. They open it in their own Jupyter environment.
GitHub: Upload your .ipynb file to GitHub. It renders automatically in the browser.
Export to other formats: Use File → Download as to export to:
- HTML — A static webpage anyone can view
- Python (.py) — Just the code, no markdown
- PDF — Requires additional tools (Pandoc + LaTeX)
Command line conversion:
jupyter nbconvert --to html your-notebook.ipynbFree cloud options:
Google Colab — Run notebooks in your browser with free GPUs
nbviewer — Paste a notebook URL and get a rendered view
Binder — Turn a GitHub repo into a live, interactive notebook environment
Machine Learning Libraries
We have learned about libraries for data analysis as well as data visualization. But Python’s capabilities don’t end there — it also offers libraries for machine learning algorithms such as Scikit-learn, TensorFlow, PyTorch, and Keras.
Let’s have a little glance at these libraries —
- Scikit-learn: This library supports various regression, classification as well as clustering models such as Linear Regression, SVMs, Decision Trees, etc. You can study details from here.
- TensorFlow: This library supports neural networks, reinforcement learning, and production deployment. It is widely used for deep learning. Moreover, this library offers flexibility for custom model building. By the way, TensorFlow is developed by Google. You can learn details from here.
- PyTorch: This library is popular for research and production. Because it is great for custom deep learning models as well as NLP (Natural Language Processing) tasks. And PyTorch is developed by Facebook. You can learn all from here.
- Keras: The friendly face of deep learning. It is a high-level API that runs on top of TensorFlow to simplify building neural networks with just a few lines of code. It is excellent for beginners
- NLTK / spaCy: Your toolkit for text. They handle tasks like splitting text into sentences, identifying names/places (entities), and sentiment analysis
- OpenCV: It handles image and video processing (rotating, filtering, edge detection) and is often used with deep learning models
How to Choose the Right Tool?
If you are just starting, here is a simple roadmap to follow:
Start with the Core Four
NumPy and Pandas for handling data.
Matplotlib or Seaborn to look at the data.
Scikit-learn to build your first prediction model.
Pick a Deep Learning Path
- If you want to learn industry deployment and scalability, go with TensorFlow.
- If you want flexibility and research-oriented coding, go with PyTorch.
Tip: Learning Keras first is a great way to understand neural networks without getting bogged down by complexity .
Choose by Task
- Working with tables/numbers? Start with
Scikit-learn,XGBoost, orLightGBM. - Working with images? Use
OpenCVcombined withPyTorchorTensorFlow. - Working with text? Use
spaCyfor preprocessing andHugging Facefor powerful models . - Working with time series (dates/prices)? Check out
Dartsortsfresh
Hope the writing was enjoyable and meaningful. It’s your turn now, Play with your Jupyter Notebook.!
메타데이터
- post_id
- 2cb42e4bba11
- slug
- jupyter-notebook-for-beginners-from-zero-to-first-prediction-2cb42e4bba11
- url
- https://medium.com/@zhaolusi1/jupyter-notebook-for-beginners-from-zero-to-first-prediction-2cb42e4bba11
- canonical_url
- https://medium.com/@zhaolusi1/jupyter-notebook-for-beginners-from-zero-to-first-prediction-2cb42e4bba11
- author_url
- https://medium.com/@zhaolusi1
- status
- ok
- fetched_at
- 2026-06-09 14:34:10




