Compliance as telemetry: Building a $0 security monitoring pipeline with open source tools
How I used cinc-auditor, Alloy, and Grafana Cloud to turn Linux security posture into a live, auditor-ready dashboard — for free.
Compliance as telemetry: Building a $0 security monitoring pipeline with open source tools
How I used cinc-auditor, Alloy, and Grafana Cloud to turn Linux security posture into a live, auditor-ready dashboard — for free.
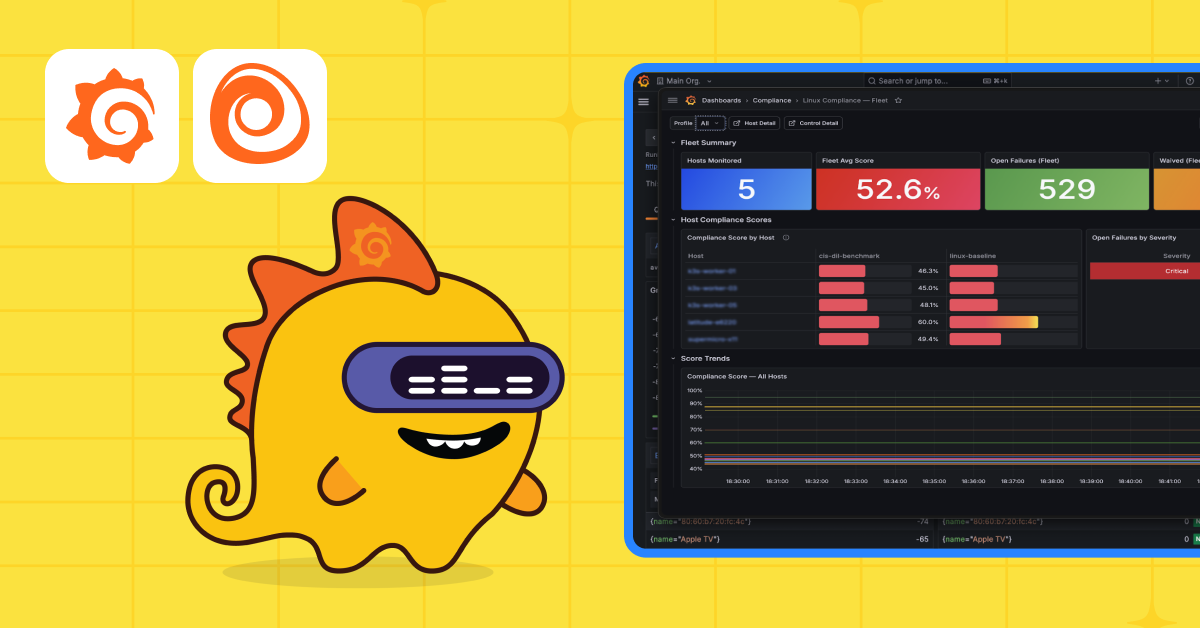
I have a decent-sized homelab that I wanted to secure properly. Having worked at Chef and now at Grafana Labs, it occurred to me that I was sitting at an interesting intersection: I knew InSpec-style compliance scanning from one world and observability pipelines from the other.
The obvious question was whether I could bridge the two. The result is server-compliance, an open-source pipeline that treats security posture like any other system metric.
Every compliance framework (SOC 2, ISO 27001, PCI-DSS, HIPAA) asks the same question: Can you prove your servers are configured securely? The traditional answer involves quarterly scans, PDF reports, and screenshots stapled into audit binders. This is my answer instead: a live dashboard, continuous scanning, and alerts that fire when something regresses.
The architecture
The design is lean by choice. Compliance visibility shouldn’t need its own separate infrastructure — it should live where your logs and metrics already are.
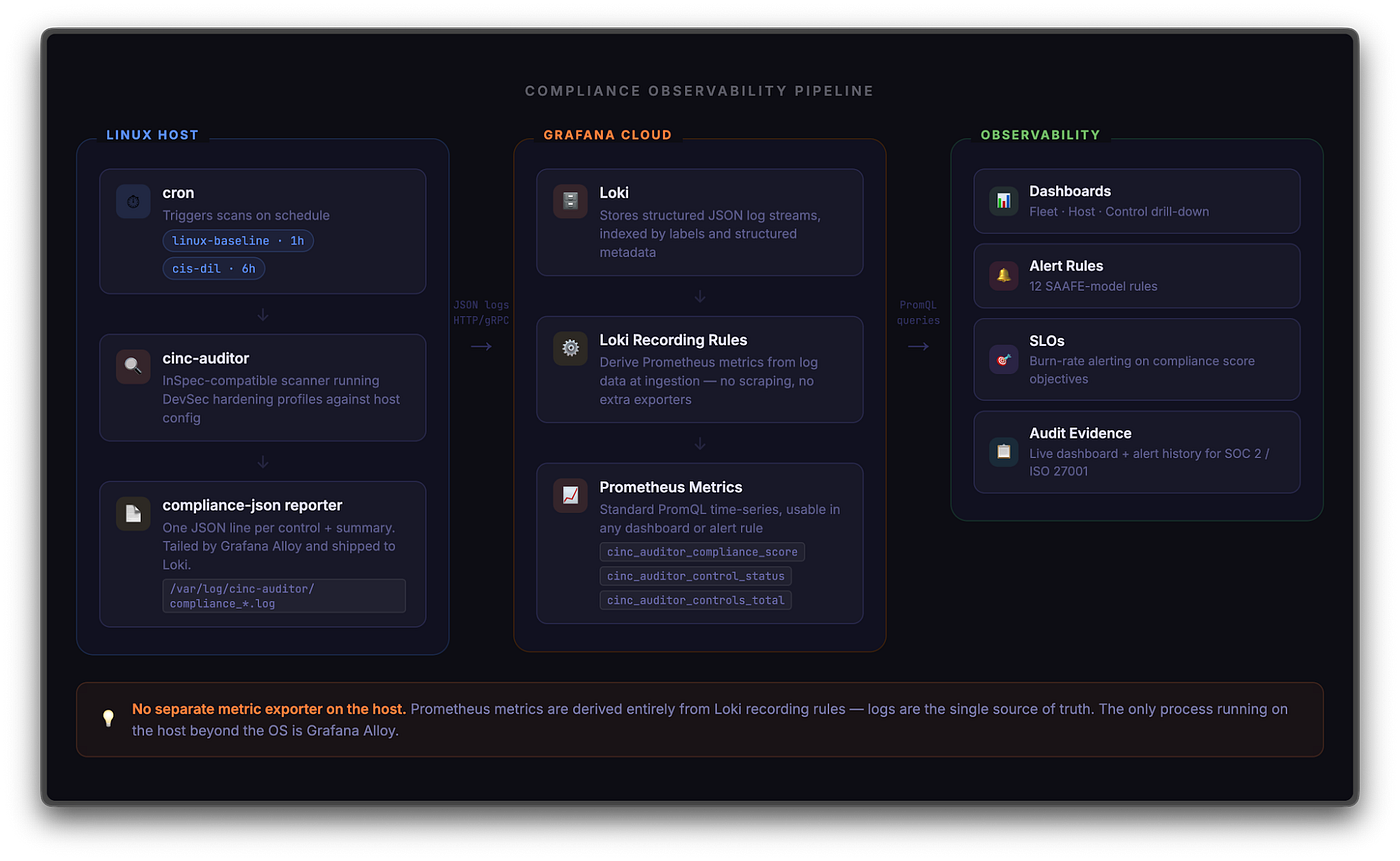
On each Linux host, cinc-auditor (a license free version of Chef Inspec) runs on a cron schedule using a custom JSON reporter. It produces structured log files that Grafana Alloy tails and ships to Grafana Cloud Logs. Recording rules then derive all the Prometheus metrics — compliance score, control counts, per-control status, scan duration — directly from the log data.
Those metrics power three dashboards (fleet, host, and control detail), 12 alert rules, and two SLOs. I run this on Grafana Cloud, but the same pipeline works with a self-hosted OSS stack (more on this later).
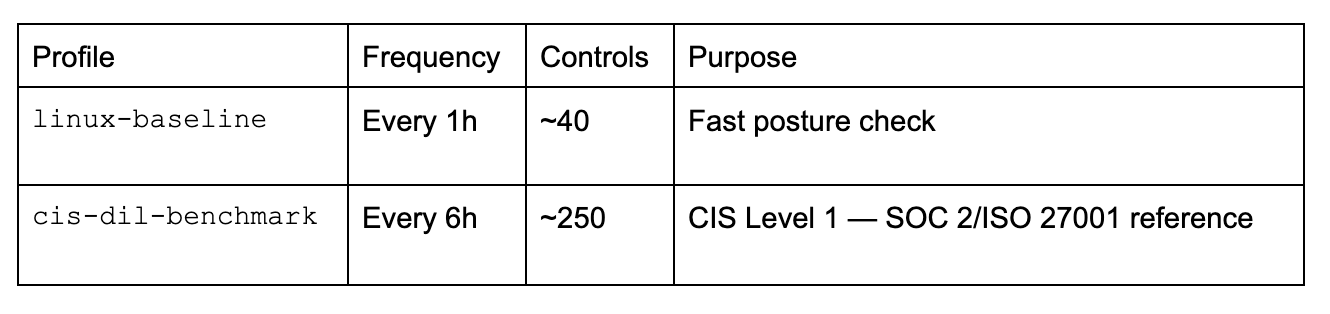
I run two profiles to balance speed and depth:
The secret sauce: a custom reporter
The non-obvious piece is how the data gets into Loki (which powers Grafana Cloud Logs) efficiently. By default, cinc-auditor exports results as a single massive JSON object. That works fine for humans reading a report, but it’s Loki poison, since parsing one giant blob per scan is expensive and slow.
To solve this, I wrote the compliance-jsonreporter plugin. Instead of one blob, it emits one lean JSON line per control result, followed by a scan summary line:
{"type":"control","id":"os-01","status":"passed","profile":"linux-baseline","host":"web-01"}
{"type":"control","id":"os-02","status":"failed","profile":"linux-baseline","host":"web-01"}
{"type":"summary","profile":"linux-baseline","passed":38,"failed":2,"total":40,"host":"web-01","duration_seconds":31.4}
This log-per-control format means Alloy can ship data with almost zero parsing overhead, and Loki’s structured metadata can carry high-cardinality fields like control ID and title without blowing up the stream cardinality.
Turning logs into metrics
Loki recording rules are the bridge between log data and Prometheus metrics. Rather than running expensive LogQL queries every time a dashboard panel loads, we compute the metrics once at ingestion time.
First, Alloy discovers and forwards the logs:
local.file_match "compliance_logs" {
  path_targets = [{"__path__" = "/var/log/cinc-auditor/compliance_*.log"}]
}

loki.source.file "compliance" {
  targets    = local.file_match.compliance_logs.targets
  forward_to = [loki.write.grafana_cloud.receiver]
}
Then a recording rule extracts the compliance score:
- record: cinc_auditor_compliance_score
  expr: |
    sum by (host, profile) (
      count_over_time({job="custom/cinc_auditor"} | json | status="passed" [5m])
    )
    /
    sum by (host, profile) (
      count_over_time({job="custom/cinc_auditor"} | json [5m])
    )
cinc_auditor_compliance_score is now a standard Prometheus metric. I can write the same PromQL against it that I would write for CPU utilization or request latency. The dashboards, alerts, and SLOs all work exactly the same way they would for any other signal.
The dashboards
Once the metrics are flowing, three dashboards provide drill-down from fleet-level posture to individual control failures.
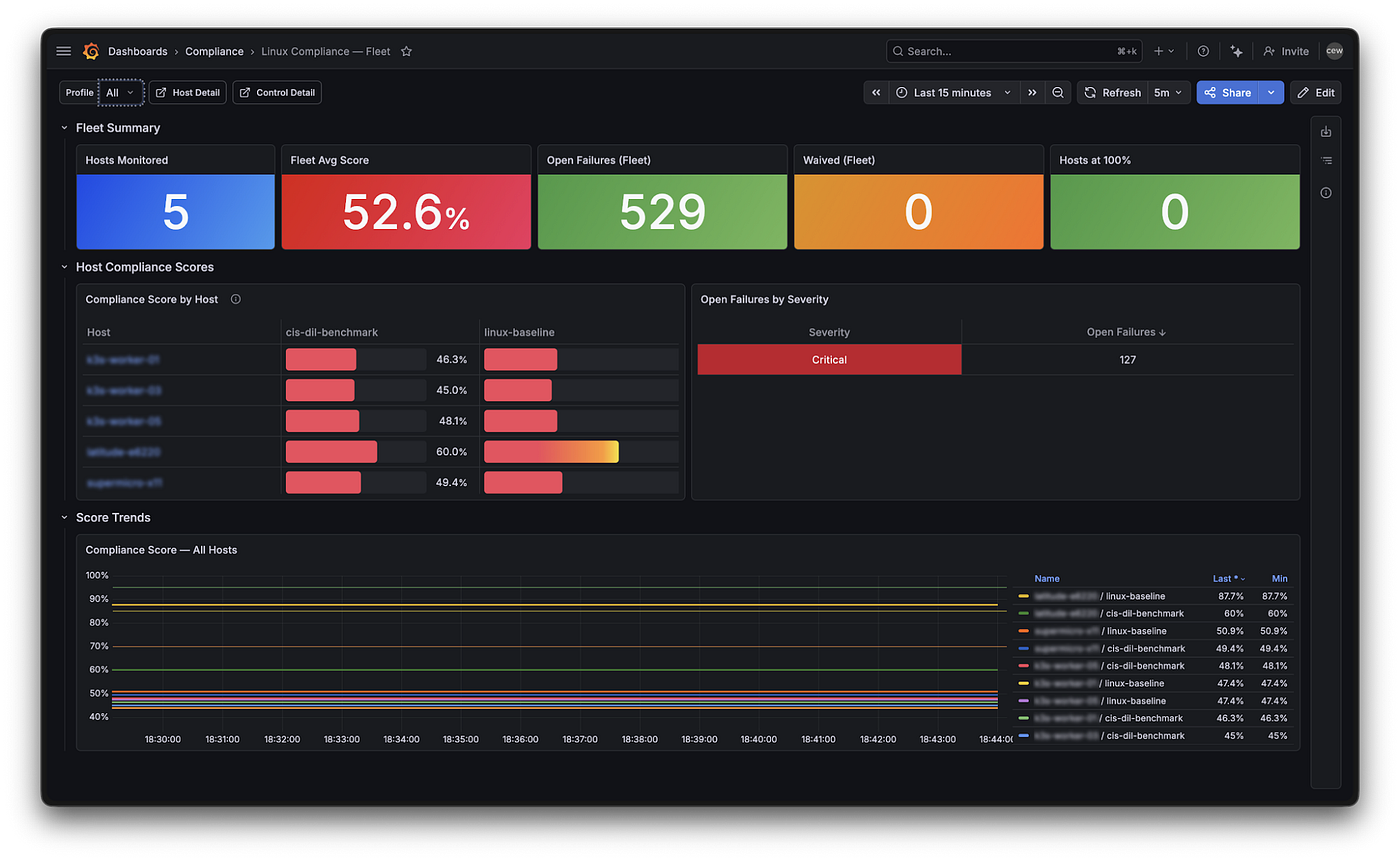
Fleet overview: Top-level compliance score per host and profile, hosts sorted by score, and trend lines that show how posture has changed over time. This is useful for quickly identifying which host needs attention.
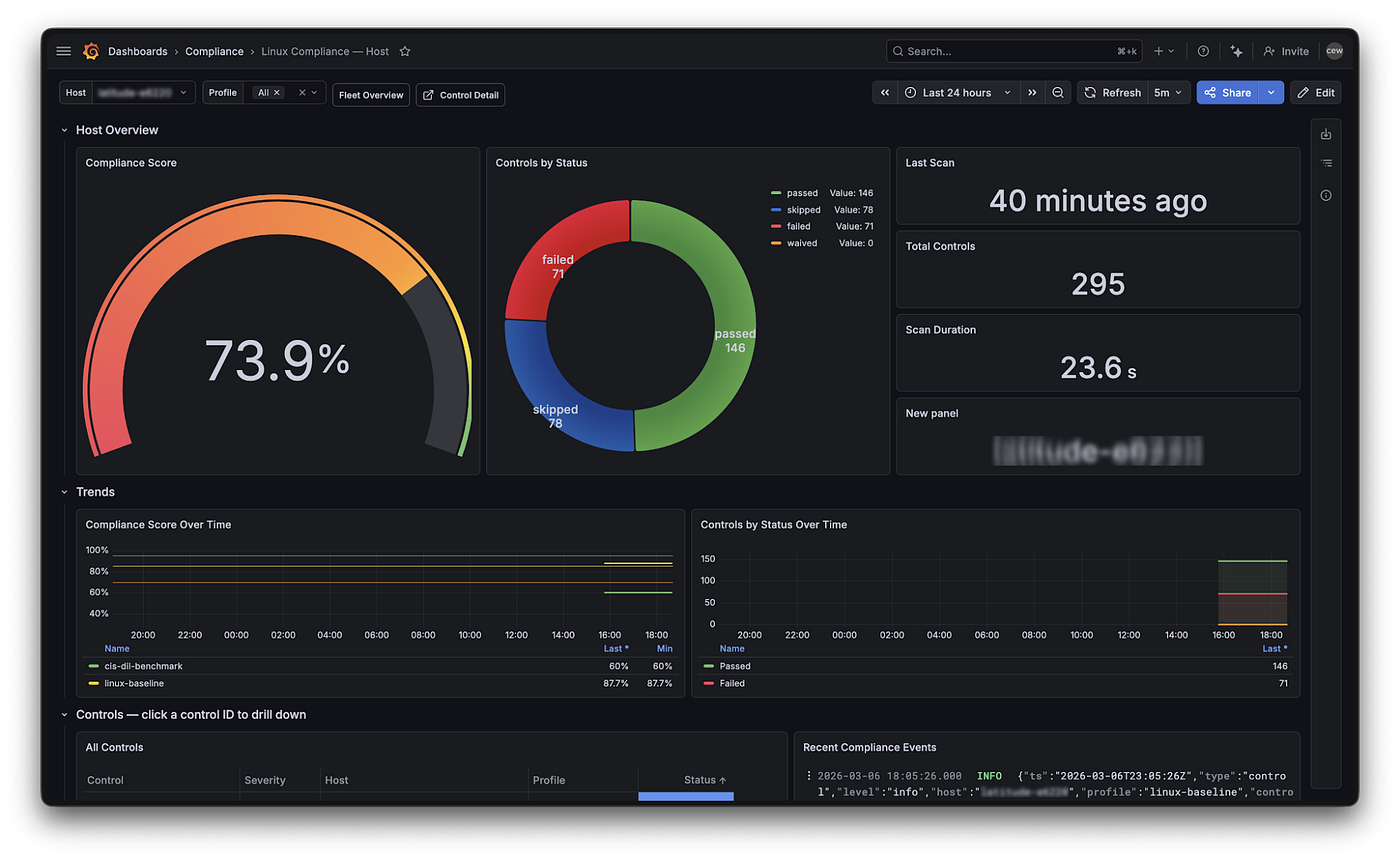
Host detail: A single host’s full compliance picture: score trend, control breakdown by status (passed/failed/waived/skipped), and a table of every failing control with its severity and InSpec description.
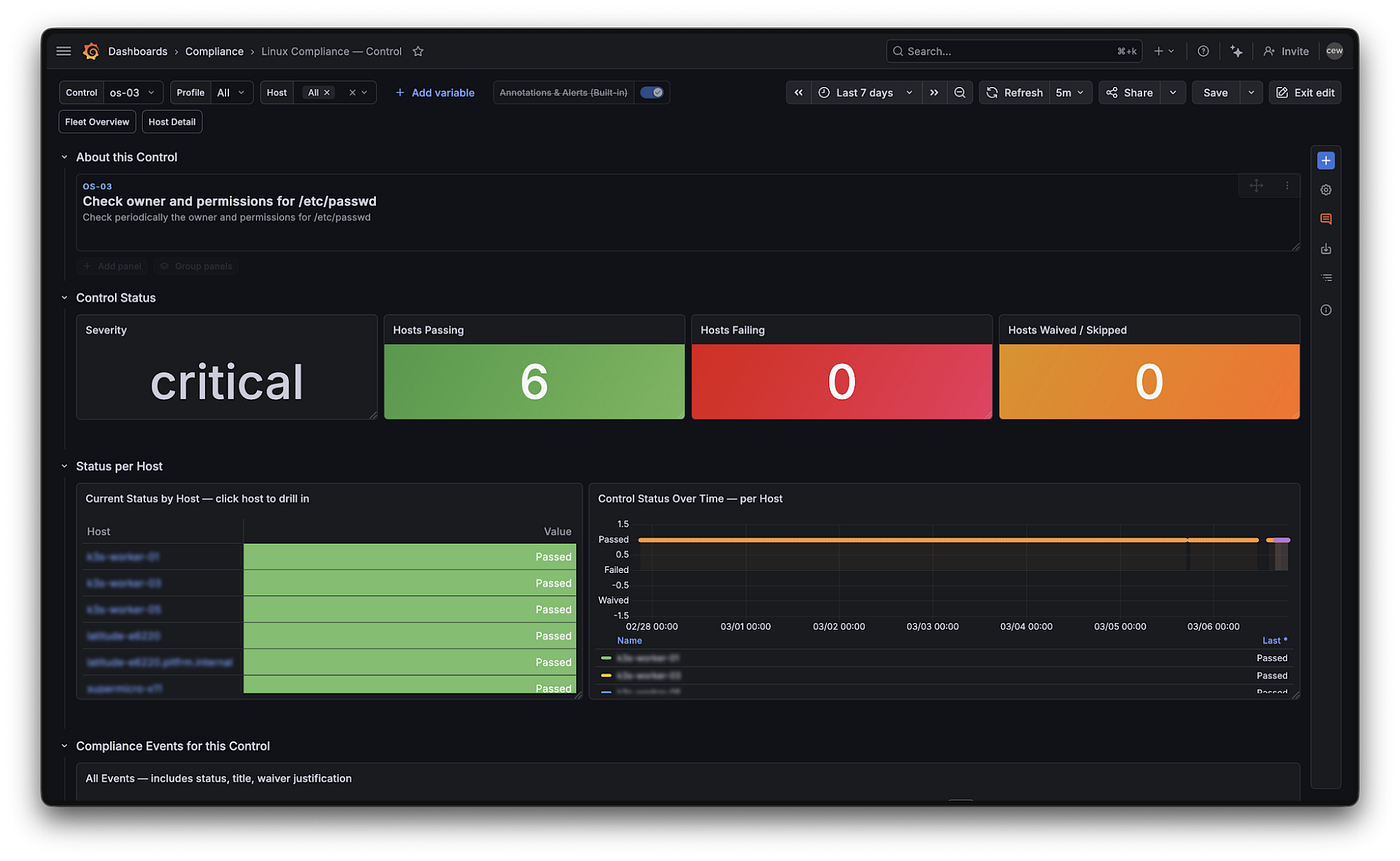
Control detail: You’re essentially flipping the query here. Pick a specific control and see its status across every host in the fleet. This is useful for rolling remediation work, where you fix a control on one host at a time and want to track progress.
Alerting and SLOs
Twelve pre-built alert rules are organized using the SAAFE model:
- Failure: Scan stopped producing results, score hit zero, critical control failing
- Error: Score below 90% for more than 30 minutes, more than 20% of controls failing
- Amend: Score dropped more than 5% in an hour, three or more new failures appeared
- Anomaly: Scan duration is 2x the 24-hour average, waiver count jumped
- Saturation: CPU or disk pressure on a scanned host
Two SLOs track compliance score objectives (95% for linux-baseline, 90% for cis-dil-benchmark) over a 28-day window and auto-generate fast-burn and slow-burn alerts. This turns the dashboard from something you check occasionally into something that actively pages you when posture degrades.
Compliance as code
The full pipeline is version-controlled, which matters as much as the pipeline itself.
Every waiver has a justification and an expiry date. When an auditor asks why IP forwarding is enabled, the answer is in waiver.yaml with a specific reason and a review date. Changes go through pull requests — the diff is the audit trail. The Ansible role deploys the entire stack to a fresh Ubuntu 24 host with a single command, so every host gets identical profiles, waivers, and scan schedules.
This is the difference between saying “we follow CIS” and showing a live dashboard with a 96.3% compliance score, a list of justified exceptions, and an alert history that proves you responded to every regression.
The cost argument
Now that I’ve shown you what server-compliance can do, let’s dig into what is always a key consideration: cost. A commercial compliance platform — Wiz, Lacework, Prisma Cloud, Qualys — typically costs $15 to $50 per host per month. For a 10-server fleet, that’s $1,800 to $6,000 per year. Now let’s compare that to your costs of using server-compliance:
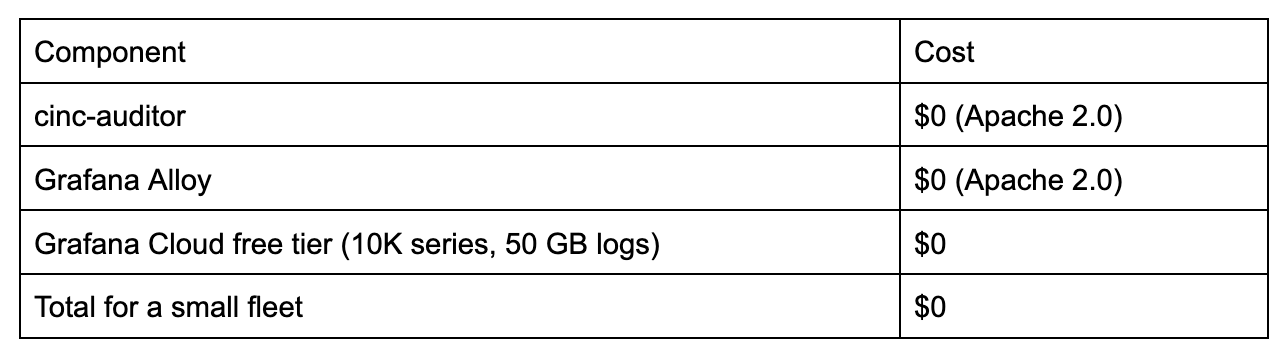
Even at scale, the only cost is Grafana Cloud usage above the free tier. A 100-host fleet running two profiles produces roughly 1,000 active series and 50,000 log lines per day — a few dollars a month at pay-as-you-go rates.
The trade-off is engineering time instead of license fees. For a team already using Grafana for monitoring, the marginal effort is a weekend to set up and an hour per quarter to review waivers.
Running server-compliance without Grafana Cloud
Everything I just discussed also works on the fully open source self-hosted stack — no Grafana Cloud account required.
Swap Grafana Cloud for:
- Loki OSS: Same recording rules, same LogQL queries, same Alloy config
- Prometheus: Receives the metrics derived from Loki recording rules
- Grafana OSS: Identical dashboards and alert rule definitions
The only thing you lose is the SLO plugin, which is Grafana Cloud-specific. Everything else — the custom reporter, the Alloy config, the recording rules, the dashboards, the SAAFE alert rules — is standard open-source and runs identically self-hosted.
The trade-off is the usual one: Grafana Cloud means a monthly bill (or staying within the free tier for smaller fleets); the OSS stack means infrastructure to run and maintain. For a team already operating Loki and Grafana OSS for other signals, adding this pipeline is almost zero marginal effort.
That said, Grafana Cloud brings real extras beyond hosting — Adaptive Telemetry and Incident Response Management, ML-powered anomaly detection, one-click integrations with hundreds of out-of-the-box dashboards, and features like Knowledge Graph for automated root cause analysis. If you are starting from scratch or want the operational overhead to be someone else’s problem, Grafana Cloud is the faster path to value.
Getting started
Everything you need is on GitHub: source code, the Ansible role, dashboards, alert rules, and a step-by-step setup guide. The scripts handle deploying all the Grafana Cloud resources — recording rules, dashboards, alerts, and SLOs — in a few minutes.
If you are preparing for SOC 2, hardening a homelab, or just want to know whether your servers are actually secure, give it a try. The price is right.
And if you liked this post,check out more of my writing on my personal blog.
메타데이터
- post_id
- 2d53690feb8f
- slug
- compliance-as-telemetry-building-a-0-security-monitoring-pipeline-with-open-source-tools-2d53690feb8f
- url
- https://medium.com/grafana-labs/compliance-as-telemetry-building-a-0-security-monitoring-pipeline-with-open-source-tools-2d53690feb8f
- canonical_url
- https://medium.com/grafana-labs/compliance-as-telemetry-building-a-0-security-monitoring-pipeline-with-open-source-tools-2d53690feb8f
- author_url
- https://medium.com/@colin.wood_61313
- status
- ok
- fetched_at
- 2026-07-08 20:12:56