Stock Market Weekly Wrap — Nasdaq Hits New High Amid Mixed Performance
Technical recap for the week of Oct 21–25, 2024. Nasdaq hits record high while bond yields pressure markets. Complete coverage of indices…
Stock Market Weekly Wrap — Nasdaq Hits New High Amid Mixed Performance
Technical recap for the week of Oct 21–25, 2024. Nasdaq hits record high while bond yields pressure markets. Complete coverage of indices and sector performance. New trade idea: RMD & DECK
Economic data sources: investor.com | Edward Jones | MarketWatch

Summary
The stock market delivered mixed performance last week as rising bond yields disrupted the broader market’s momentum, though the tech-heavy Nasdaq managed to reach new highs.
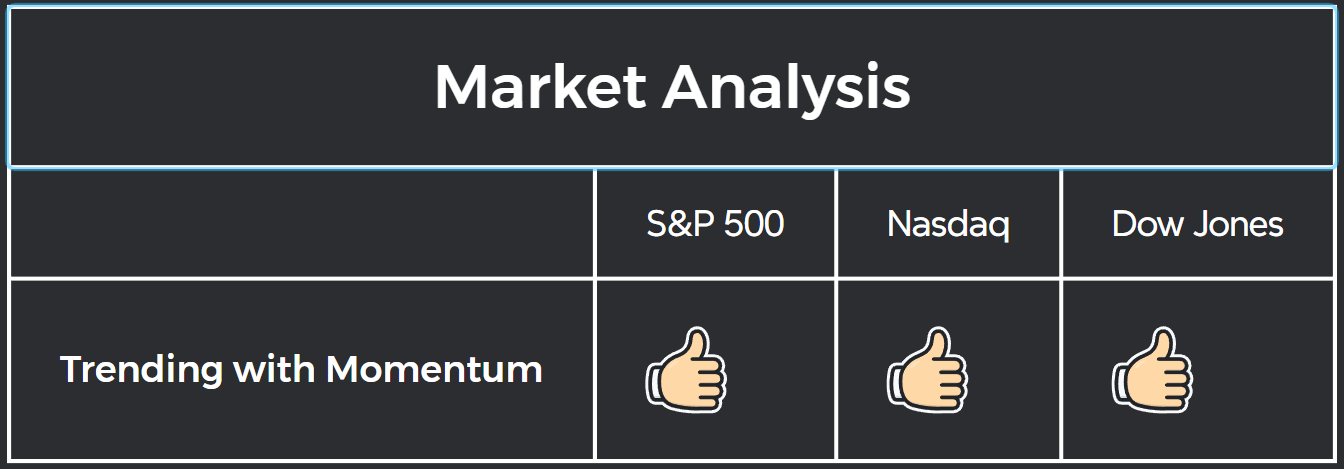
All indices are in a confirmed bullish trend
The broader market’s six-week winning streak came to an end as bond market volatility reached its highest levels since December 2023.
Market sentiment shifted as investors digested stronger-than-expected economic data and reevaluated Federal Reserve policy expectations.
Bond yields dominated headlines, surging from 3.60% to 4.20%, signaling a significant shift in the interest rate environment.
Key Takeaways from Last Week:
- Record Territory: The Nasdaq Composite reached new highs, demonstrating resilience amid market pressure
- Consumer sentiment climbed to a six-month high of 70.5 in October, strengthened by growing political confidence and a temporary pullback in interest rates
- September’s durable goods orders decreased 0.8%, matching the previous month’s decline, although core orders excluding transportation demonstrated resilience with a 0.4% gain despite Boeing strike impacts
- Sector Leadership: Shoe manufacturing stocks led advances, while consumer sectors exhibited strength
- Market Pressure: Rising bond yields weighed on overall market sentiment
- Economic Data: Durable goods orders declined 0.8% in September, while consumer sentiment hit a six-month high
- Trade Idea: RMD and DECK
- Watchlist: CLS
Looking Ahead
Investors are positioning themselves for a crucial week ahead, with several major catalysts on the horizon:
- Five Magnificent Seven earnings reports, including Microsoft, Apple, and Amazon
- Key economic data releases, notably PCE inflation figures
- October’s jobs report, projecting 125,000 new positions
Market Background: Key Events That Shaped Last Week’s Trading
1. Rising Bond Yields Challenged Market Momentum
- Bond yields dominated market sentiment last week, with the 10-year Treasury yield surging from 3.60% to 4.20%.
- Stronger-than-expected economic data fueled the yield surge, diminishing the likelihood of a higher rate cuts through year-end.
2. Economic Data Painted Mixed Picture
- September’s durable goods orders declined 0.8%, matching the previous month’s decrease and falling short of economists’ 0.5% projection.
- Orders rose 0.4% when excluding autos and aircraft, despite the ongoing Boeing strike impact.
- Consumer sentiment climbed to a six-month high of 70.5 in October, bolstered by growing political confidence and a temporary pullback in interest rates.
3. Political Landscape Influenced Trading
- Market participants closely monitored election developments, with betting markets indicating increased odds of a Trump victory.
- Fiscal policy concerns emerged as campaign proposals from both major candidates suggested substantial increases in government debt through 2035.
4. Corporate News Drove Market Movement
- McDonald’s shares fell 3% following reports of an E. coli outbreak linked to its Quarter Pounder burgers.
- The shoe manufacturing sector emerged as a bright spot, with Deckers Outdoor rallying 10.5% after exceeding earnings expectations.
Detailed Market Analysis: Technical Indicators and Performance
S&P 500 Technical Analysis
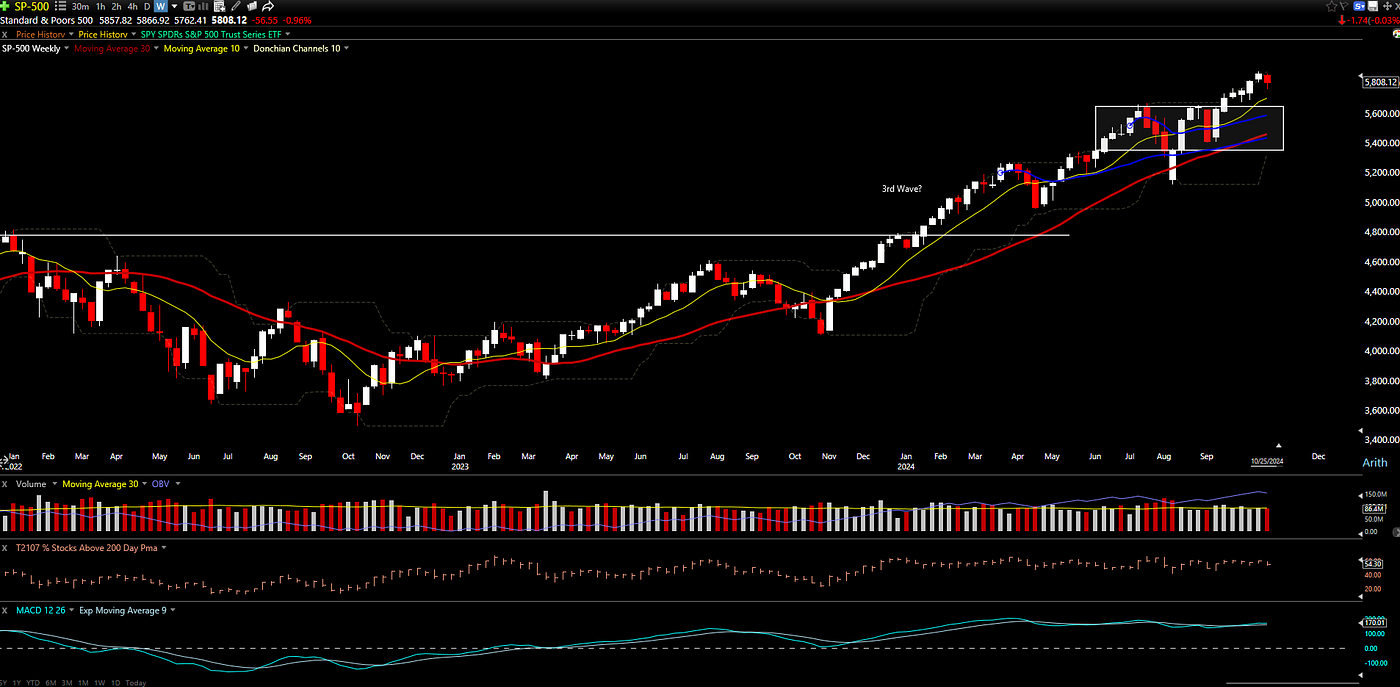
SPX pull back from all time high
Performance Metrics:
- Weekly Performance: 0.96%
- Year-to-Date Performance: 21.77%
Technical Indicators:
- The market retreated from last week’s all-time high
- Both short-term and long-term trends confirm bullish momentum
Volume:
- Volume remains stable
Market Breadth:
- Percentage of companies above 200 SMA: 54.30%
- The majority of companies maintain upward trends, participating in the overall market movement
Points of Concern:
- MACD divergence remains a significant concern
- Stocks are making new highs while MACD trends lower
- Overall sentiment remains unchanged, though market momentum is decelerating
Comparison with Other Major Indices
Nasdaq’s Record-Setting Performance
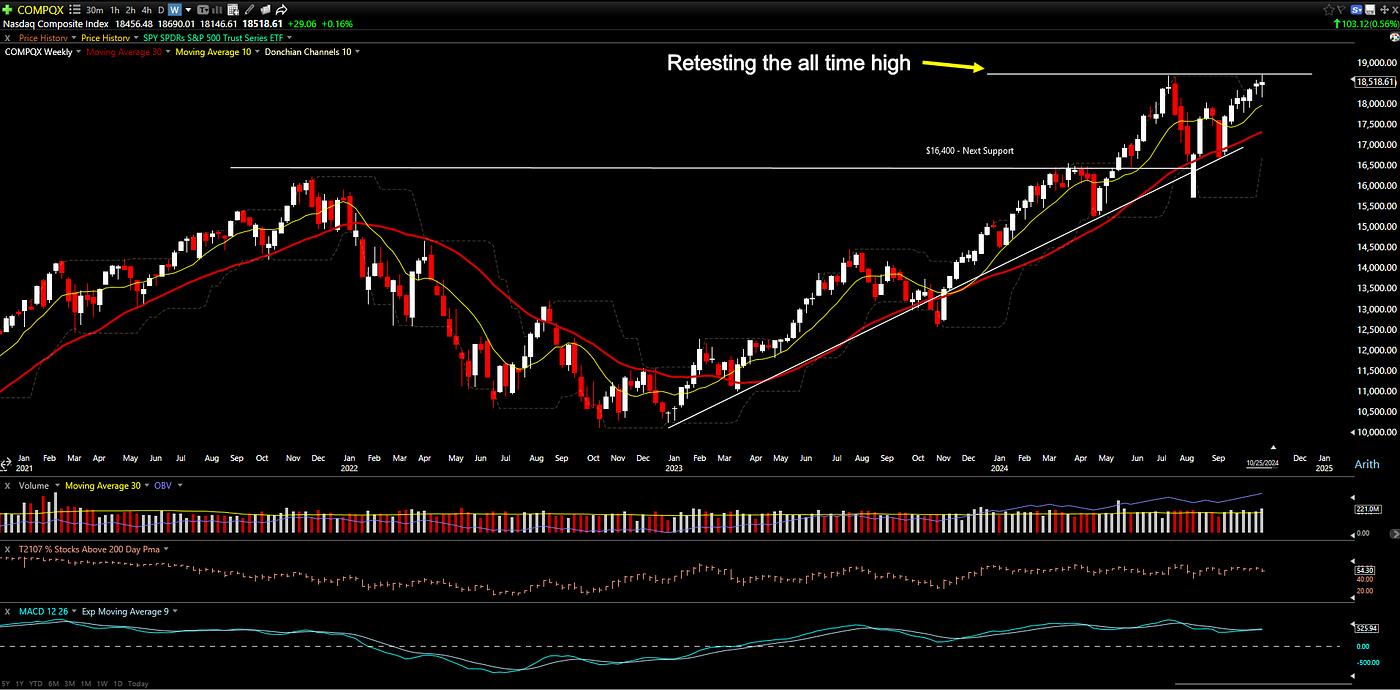
Nasdaq is reaching back to the all time high
Performance Metrics:
- Weekly Performance: 0.16%
- Year-to-Date Performance: 23.36%
Technical Indicators:
- Nasdaq is retesting its all-time high from below
- Uptrend remains intact
- Earnings reports from Apple, Microsoft, Meta, Google, and Amazon this week will serve as catalysts for potential breakout
Dow Jones Industrial Average Analysis
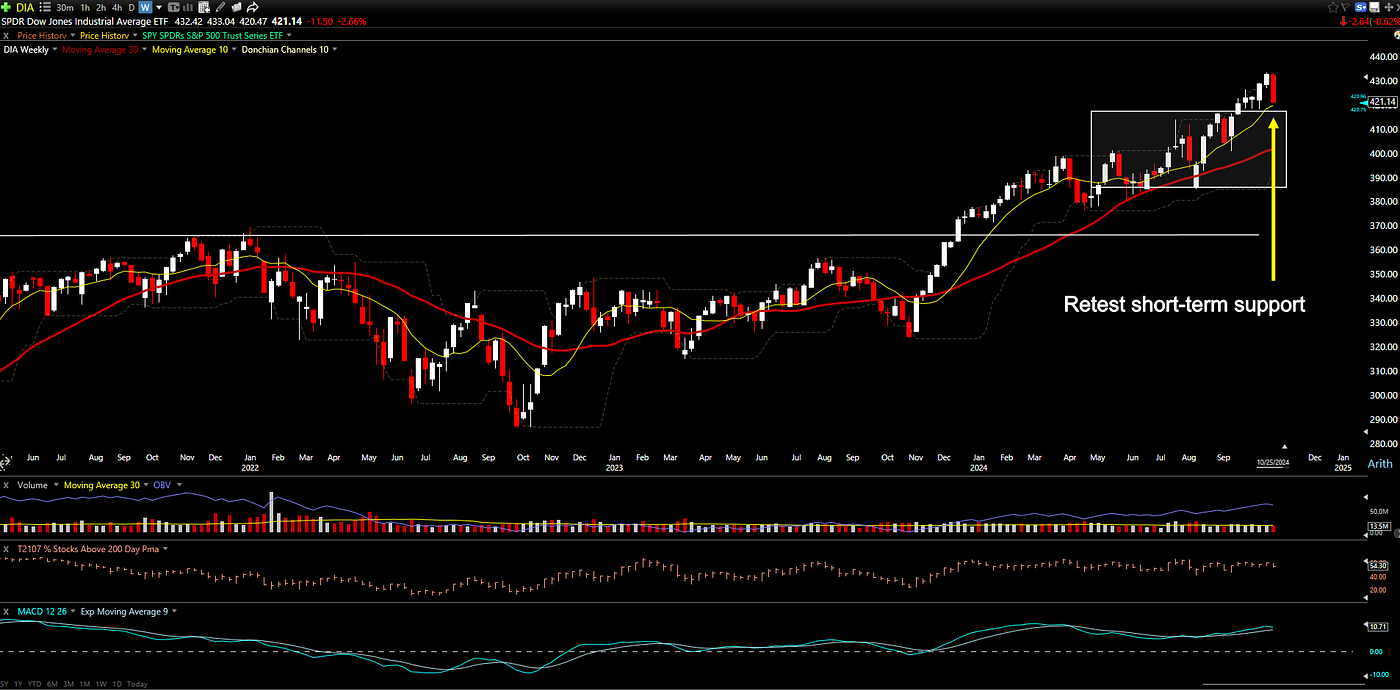
Dow Jones Industrial Average pulling back to the short term support
Performance Metrics:
- Weekly Performance: -2.68%
- Year-to-Date Performance: 11.74%
Technical Indicators:
- The Dow is pulling back to its short-term moving average support
- Like the other two markets, we remain in an uptrend
- This week marks the heart of earnings season, with potential for significant market shifts
- No immediate actions needed; patience is advised as we observe the market for clear signals
Russell 2000 Small Cap Review
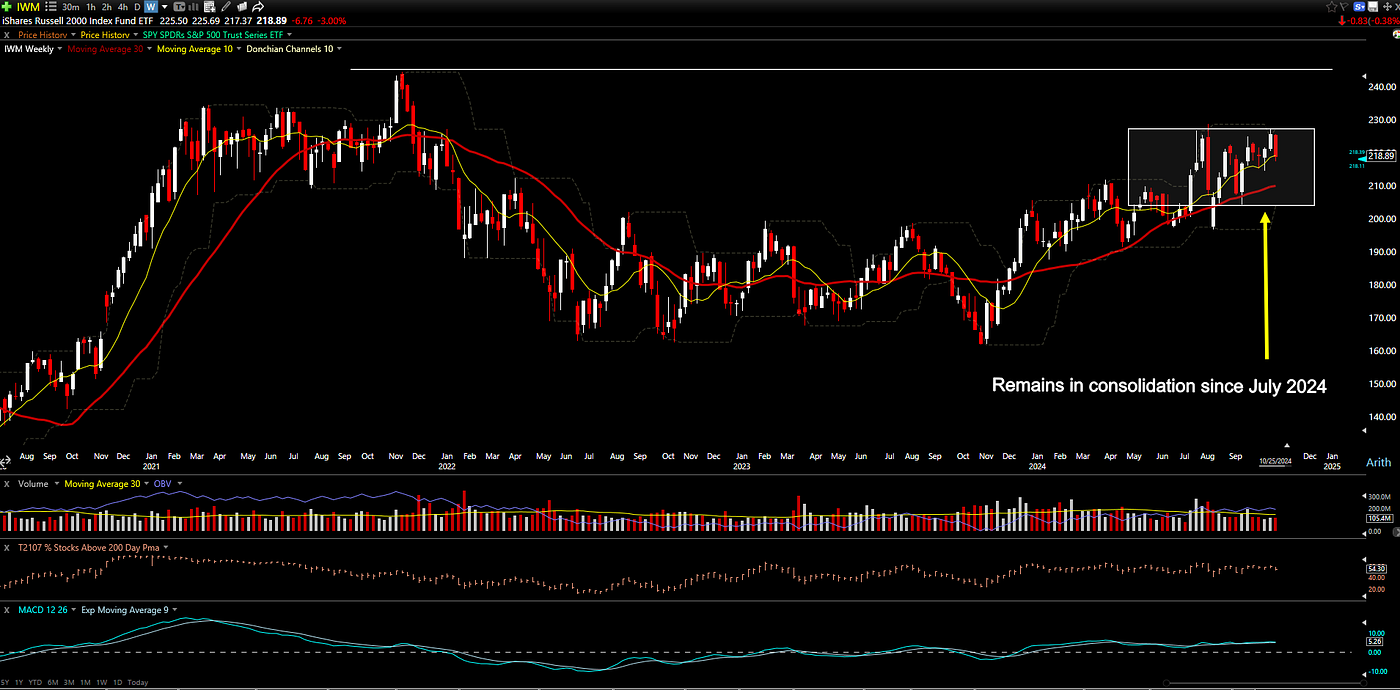
Russell 2000 remains in a consolidation
Performance Metrics:
- Weekly Performance: -3.00%
- Year-to-Date Performance: 8.93%
Technical Indicators:
- Despite significant back-and-forth movement since July 24, the market remains range-bound
- Based on market analysis, small-cap companies are currently less favored compared to mega-cap stocks
- Investment opportunities continue to emerge in well-established companies, and we should capitalize on these opportunities as they present themselves
Market Sector Rotation: Weekly and YTD Return
A Quick Takeaway:
- All sectors declined this week except consumer discretionary — The shoe manufacturer Deckers Outdoor’s stellar earnings report boosted the sector, driving the stock up 10.5%
- Consumer staples faced pressure, notably McDonald’s 3% decline amid food safety concerns
Performance sorted by YTD return.
Outperforming Sectors
- Utilities: -1.92% | YTD: 26.92%
- Communication Services: -0.38% | YTD: 25.03%
- Financial Services: -2.06% | YTD: 24.02%
- Technology: -0.25% | YTD: 19.64%
- Industrial: -2.76% | YTD: 18.78%
- Consumer Staple: -1.41% | YTD: 12.54%
Underperforming Sectors
- Consumer Discretionary: 0.66% | YTD: 12.30%
- Real Estate: -1.48% | YTD: 10.01%
- Basic Material: -3.76% | YTD: 9.84%
- Healthcare: -2.95% | YTD: 8.95%
- Energy: -0.61% | YTD: 7.07%
Key Economic Events and Market Catalysts for This Week
- PCE Inflation Data Release (Thursday) — Date: 31Oct24 — The Personal Consumption Expenditures Price Index will provide crucial inflation insights.
- October Jobs Report (Friday) — Date: 01Nov2024 — Economists expect 125,000 new jobs added in October. — The report will offer vital clues about labor market strength and wage inflation pressures.
- Magnificent Seven Earnings Week — Date: 29Oct24 (Tuesday) : Alphabet (Google) — Date: 30Oct24 (Wednesday): Microsoft (MSFT) & Meta Platforms (META) — Date: 31Oct24 (Thursday): Amazon (AMZN) & Apple (AAPL)
- These high-impact tech earnings could significantly influence market direction in the coming week.
Buy Recommendation
ResMed (RMD) — Buy
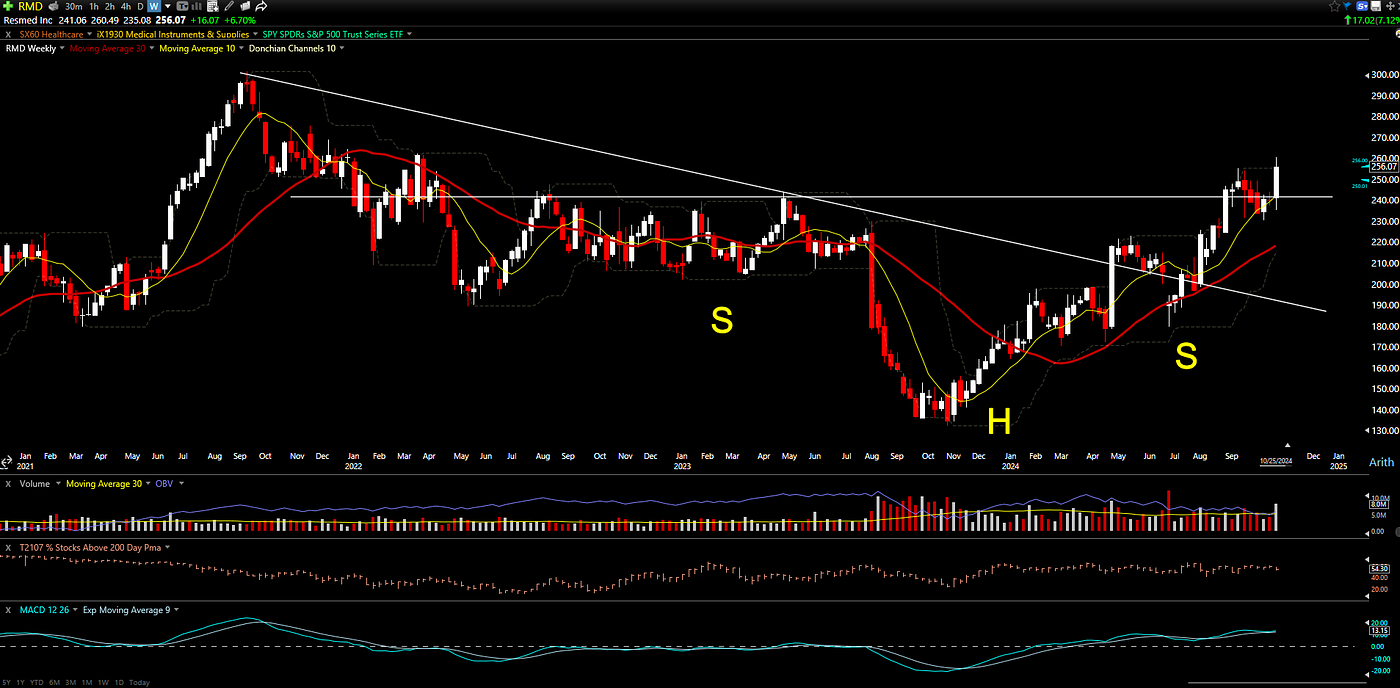
RMD breakout from a head and shoulders pattern
Who are they?
- RedMed is a leading medical equipment company that specializes in developing and manufacturing devices and software solutions for sleep apnea, chronic obstructive pulmonary disease (COPD), and other respiratory conditions.
Technical Analysis:
- A successful breakout from a head-and-shoulders pattern, currently trading at its 52-week high
- The breakout resulted from Q4 earnings exceeding expectations on October 24, 2024 — ResMed surpassed market sales estimates by 11%
- This presents a second entry opportunity following our initial failed entry in August 2024
Trade Outline: This is what’s working for me. Please do your own risk management.
- Entry: $256.07 (or current price)
- Initial stop (depending on how aggressive you are, here are some suggestions): — The low of the breakout week: $235.08 — Below the support level at: $230.00 — 30% from the current price: $179.25
For the trade layout, we will risk 2% of the portfolio:
- Risk 2% of the portfolio (based on a $100,000 account): $2,000
- Stop loss: $179.25
- Risk per share: $256.07 — $179.25 = $76.82
- Number of shares allowed for this trade: $2,000 / $76.82 ≈ 26 shares
- Total cost for the trade: $256.07 * 26 = $6,657.82
Deckers Outdoor (DECK) — Buy
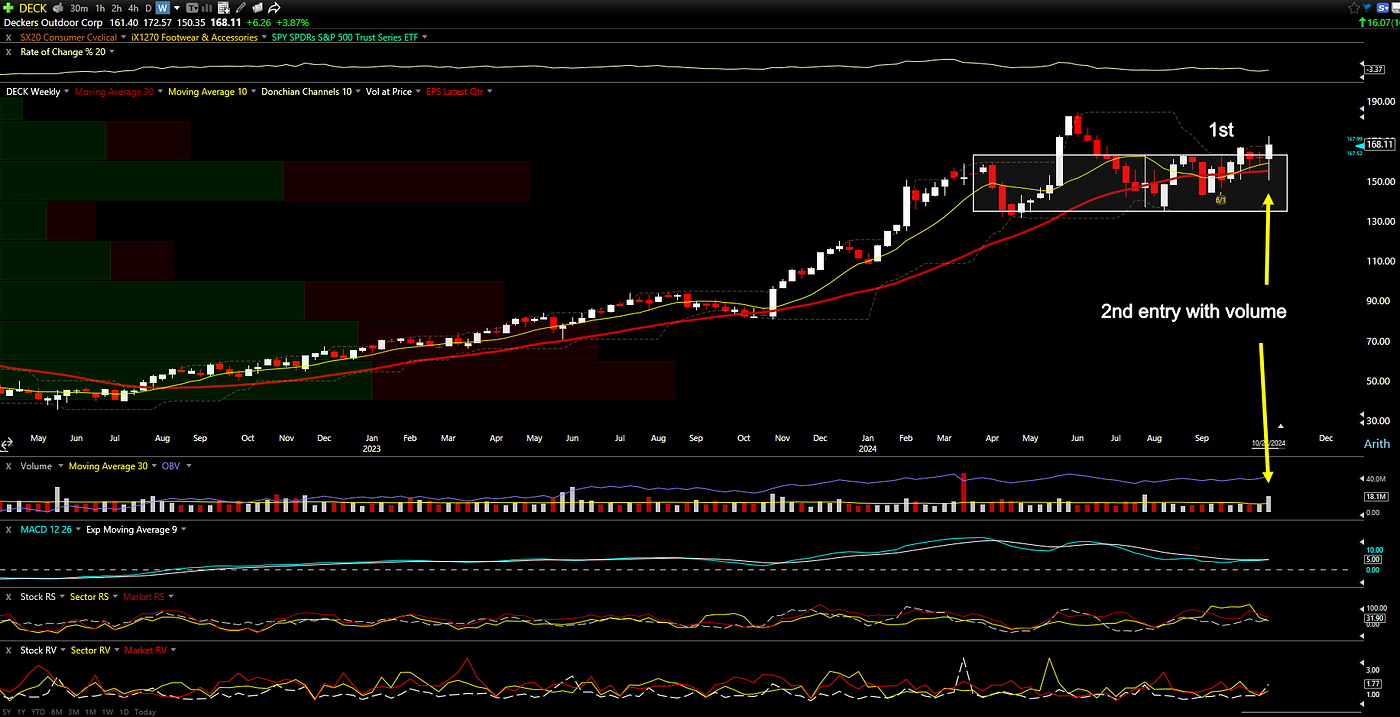
DECK breakout the 2nd time in one month
Who are they?
- Deckers Outdoor (DECK) is a footwear and apparel company that designs, markets, and distributes popular brands like UGG, Teva, and Hoka One One.
Technical Analysis:
- Q4 earnings report is complete
- The stock has broken out of consolidation for the second time
- This breakout is confirmed by strong volume
- Price remains above both short-term and long-term moving averages
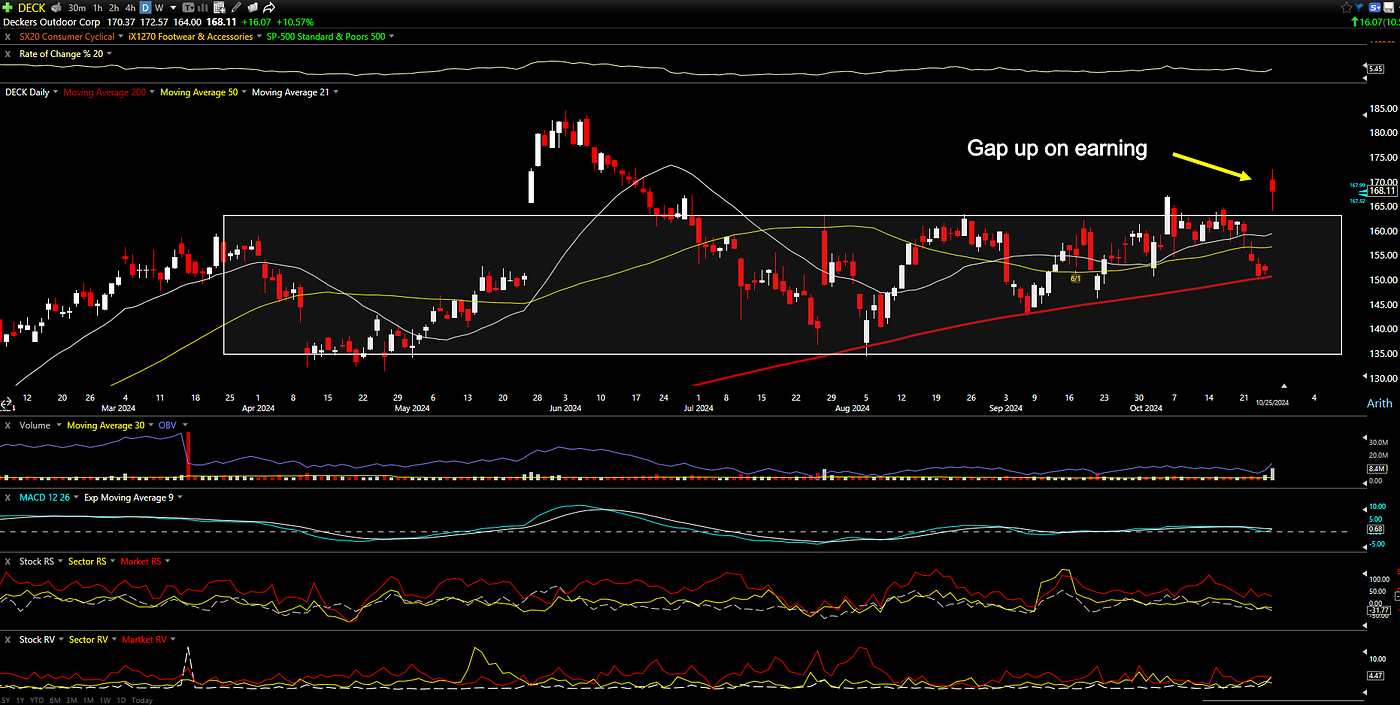
DECK closed lower than the open on the breakout day
Points of Concern:
- Despite gapping up on earnings, the stock closed with a red candle — Price closed below the opening level — Uncertainty exists regarding potential gap fill
- For short term trader, waiting for a more favorable entry point is prudent
- For position traders, the weekly setup remains actionable
Trade Management: Please apply the same position sizing methodology as outlined in the RMD analysis to determine your appropriate risk level and position size.
Watchlist
Celestica (CLS) — Watch
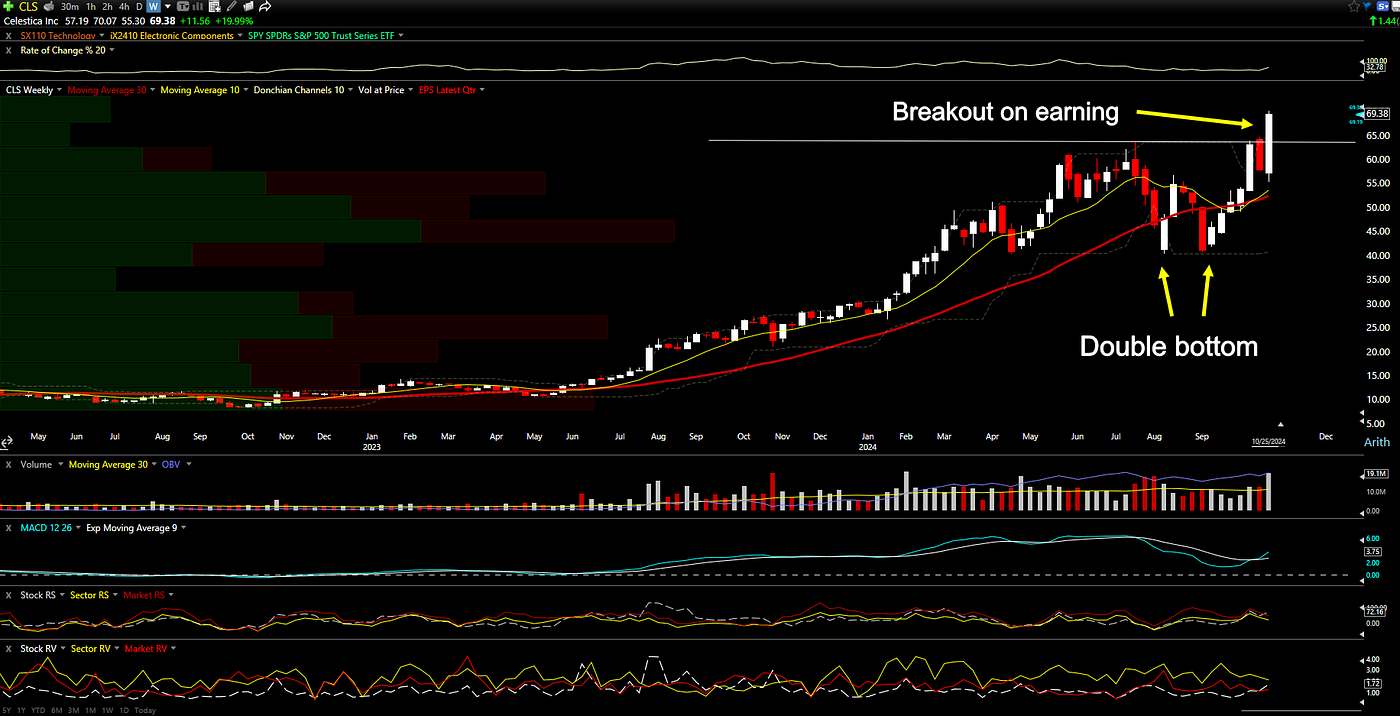
CLS breakout on the weekly chart
Who are they?
- Celestica (CLS) is a multinational electronics manufacturing services company that provides end-to-end supply chain solutions, including product manufacturing, design and engineering services, and after-market support for various industries, with a growing focus on AI and cloud technologies.
Technical Analysis:
- CLS broke out from a consolidation and double bottom pattern, reaching a 12-year high
- The breakout received strong volume confirmation
- During this month, the stock retraced to the moving average before establishing a bounce. This is a good sign.
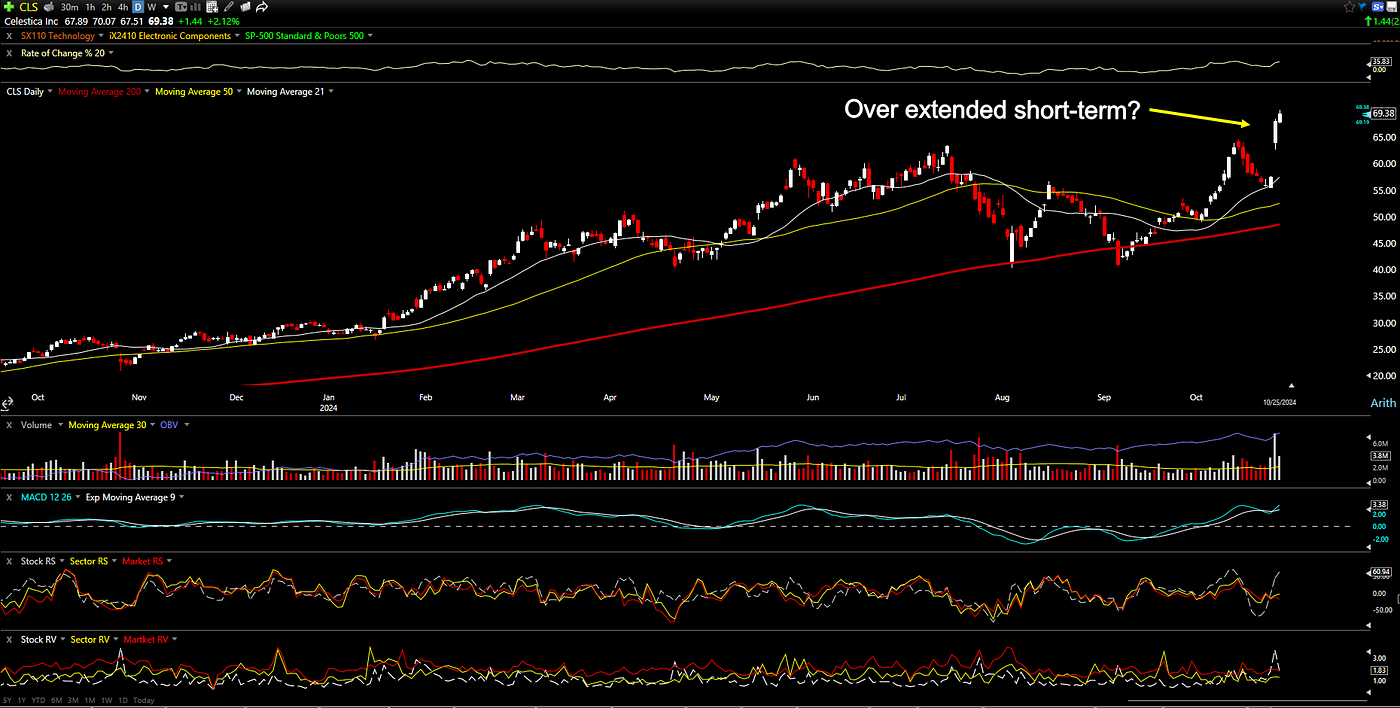
CLS gained ~20% in one week
Points of Concern:
- The stock advanced approximately 20% this week
- Based on daily chart analysis, price appears overbought in the short term
- We’ll monitor this stock for a more favorable entry point
Bottom Line
Last week’s market action demonstrated selective resilience, as the Nasdaq defied rising bond yields to reach new highs while broader markets retreated. The 10-year Treasury yield’s surge to 4.20% tested market resolve, yet strong consumer sentiment and tech sector stability suggested underlying economic strength. As investors navigate the week ahead, attention turns to crucial inflation data and a slate of high-profile tech earnings that could define market direction.
Thank you for joining me this week. Best wishes for everything that you do. Have an enjoyable week, ladies and gents.
If you like what present here, do consider my substack: datnguyenwrite.substack.com
메타데이터
- post_id
- 2d6af4a19aff
- slug
- stock-market-weekly-wrap-nasdaq-hits-new-high-amid-mixed-performance-2d6af4a19aff
- url
- https://medium.com/@datng8/stock-market-weekly-wrap-nasdaq-hits-new-high-amid-mixed-performance-2d6af4a19aff
- canonical_url
- https://medium.com/@datng8/stock-market-weekly-wrap-nasdaq-hits-new-high-amid-mixed-performance-2d6af4a19aff
- author_url
- https://medium.com/@datng8
- status
- ok
- fetched_at
- 2026-07-22 09:41:37




