Intel VTune for Windows : Analyzing Whisper.cpp Performance
Introduction
Intel VTune for Windows : Analyzing Whisper.cpp Performance
Introduction
Running Large Language Models (LLMs) and Speech-to-Text models locally is becoming the standard for privacy and performance. whisper.cpp is a masterpiece of high-performance C++ optimization, utilizing AVX intrinsics and custom tensor operations. But to understand why it’s fast—or where it bottlenecks—you need to look under the hood.
Enter Intel VTune Profiler, the industry standard for analyzing CPU performance, threading, and vectorization.
While Linux setups are well-documented, profiling on Windows can be tricky. In this guide, I’ll walk you through building whisper.cpp with the correct debug symbols, setting up the VTune CLI, and visualizing the results.
1. The Build Strategy: Choosing the Right Mode
Before we profile, we need to compile the application. Using CMake on Windows offers us three distinct build configurations, and choosing the right one is critical for accurate profiling.
The Three Modes:
- Release (
-O3): The fastest version. It strips out all debug symbols.
- Pros: Maximum speed.
- Cons: VTune cannot map instructions back to source code lines.
- Debug (
-O0): The development version.
- Pros: Full symbol visibility; perfect for stepping through code.
- Cons: Extremely slow (often 10x slower). It disables optimizations, meaning the data you profile won’t reflect real-world performance.
3. RelWithDebInfo (-O2 with symbols): The "Goldilocks" zone.
- Pros: Optimizations are enabled (AVX, loop unrolling) and debug symbols (
.pdbfiles) are generated. - Verdict: Always use this for profiling.
The Build Commands
Here is how to build whisper.cpp specifically for profiling:
Command prompt
# Create a build directory
mkdir build
cd build
# Generate build files for RelWithDebInfo
cmake -DCMAKE_BUILD_TYPE=RelWithDebInfo ..# Compile
cmake --build . --config RelWithDebInfoOnce built, your executable will be located here: C:\Users\main\whisper.cpp\build\bin\RelWithDebInfo\whisper-bench.exe
2. Setting Up the Environment
Even after installing the Intel oneAPI Base Toolkit, the vtune command isn't automatically added to your PATH in PowerShell.
You have two options:
- Temporary: Run the
setvars.batscript provided by Intel. - Permanent (Recommended): Add the binary folder to your System PATH variables:
C:\Program Files (x86)\Intel\oneAPI\vtune\latest\bin64\
To verify it works, simply run:
Command prompt
vtune --version3. Capturing the Profile
Now for the fun part. We will use the CLI to collect “Hotspots” — functions where the CPU spends the most time.
Crucial Tip: When running VTune, always use absolute paths for your model files. Relative paths often resolve incorrectly depending on where the profiler executes the binary.
The Command
Run this in your terminal:
Command prompt
vtune -collect hotspots
C:\Users\main\whisper.cpp\build\bin\RelWithDebInfo\whisper-bench.exe
-m "C:\Users\main\whisper.cpp\models\ggml-base.en.bin"**vtune**: The CLI tool.**-collect hotspots**: Tells VTune to sample the CPU instruction pointer.**whisper-bench.exe**: We use the benchmark tool instead of the CLI for consistent metrics.**-m ...**: The path to the Whisper model.
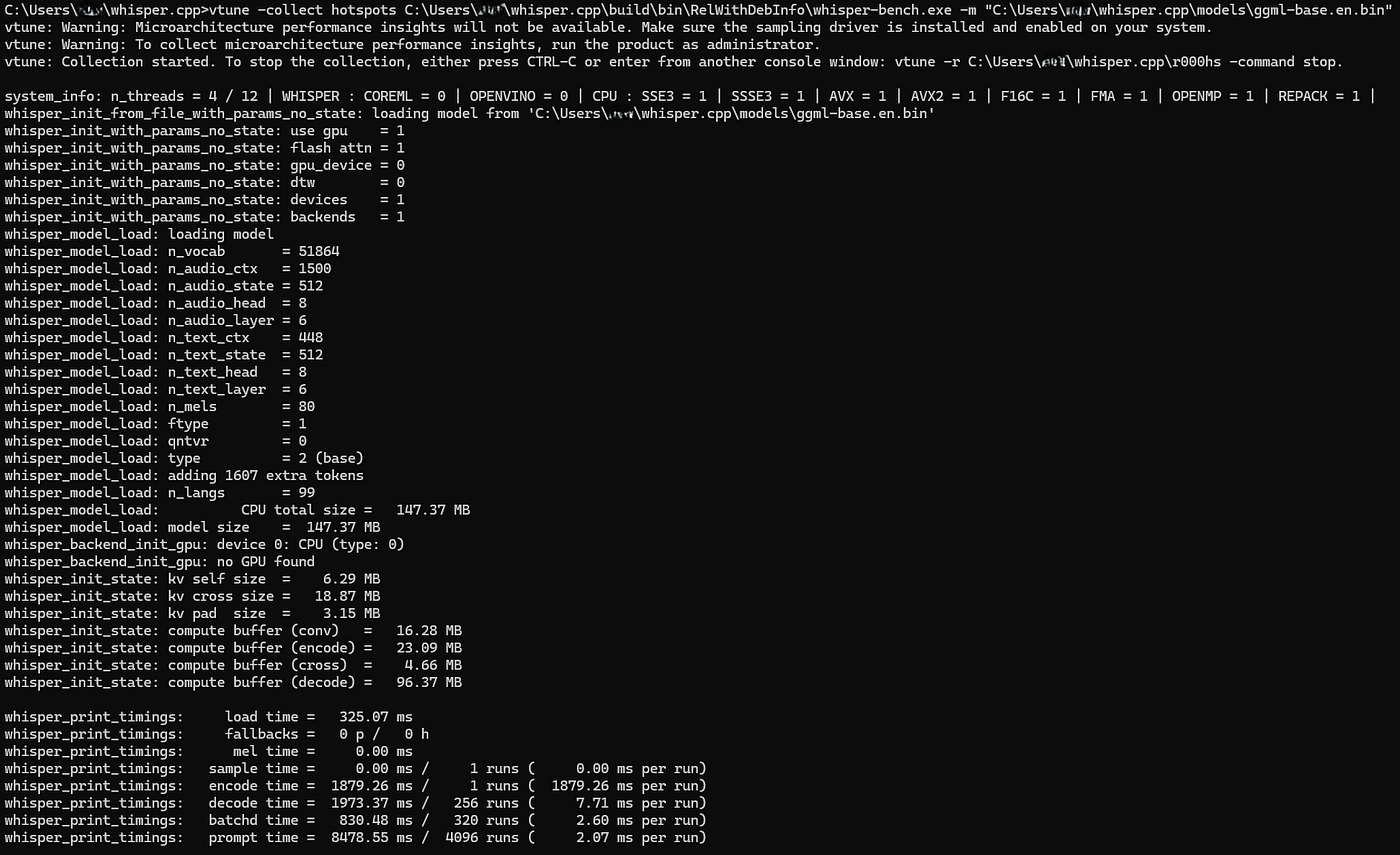
Running vtune in cmd prompt
4. Visualizing the Results
Once the collection finishes, VTune creates a result directory (usually named r000hs, r001hs, etc.). You can analyze this data in two ways.
Option A: The GUI (Visual Analysis)
To open the full graphical interface and see the Summary, Bottom-up, Caller/Callee, Top-down tree, Flame Graph:
Command prompt
vtune-gui r000hsThis launches the VTune window where you can drill down into the Bottom-up tab to see exactly which C++ functions (like ggml_compute_forward or whisper_decode) are consuming your CPU cycles.


Vtune window with summary and other reports
Option B: The CLI (CSV Export)
If you prefer data analysis or need to automate reports, you can export the results to CSV:
command prompt
vtune -report hotspots -format=csv -csv-delimiter=comma -r r000hs -report-output hotspots.csv
Conclusion
Profiling is the first step toward optimization. By setting up RelWithDebInfo and mastering the vtune CLI, we can now see exactly how whisper.cpp utilizes our hardware.
Happy Profiling!
메타데이터
- post_id
- 2dcfc2b10beb
- slug
- high-performance-profiling-on-windows-analyzing-whisper-cpp-with-intel-vtuneintroduction-2dcfc2b10beb
- url
- https://medium.com/@tr13301/high-performance-profiling-on-windows-analyzing-whisper-cpp-with-intel-vtuneintroduction-2dcfc2b10beb
- canonical_url
- https://medium.com/@tr13301/high-performance-profiling-on-windows-analyzing-whisper-cpp-with-intel-vtuneintroduction-2dcfc2b10beb
- author_url
- https://medium.com/@tr13301
- status
- ok
- fetched_at
- 2026-06-10 09:45:17