Global Market Regime Turns HIGH on FX Stress: A Systematic Read
Global market regime analysis flipped to HIGH this week even as the VIX held at 15.4 — a divergence that says more about where the stress…
Global Market Regime Turns HIGH on FX Stress: A Systematic Read
Global market regime analysis flipped to HIGH this week even as the VIX held at 15.4 — a divergence that says more about where the stress is concentrated than about broad investor fear. Every region in the GMRO framework closed lower, and the only central bank still easing sits in the region carrying the highest local volatility.
This analysis covers the week ending June 5, 2026, across regional performance, the volatility regime, the central-bank policy map, the selection model, and the resulting allocation — grounded in the GMRO v2.7 systematic methodology.
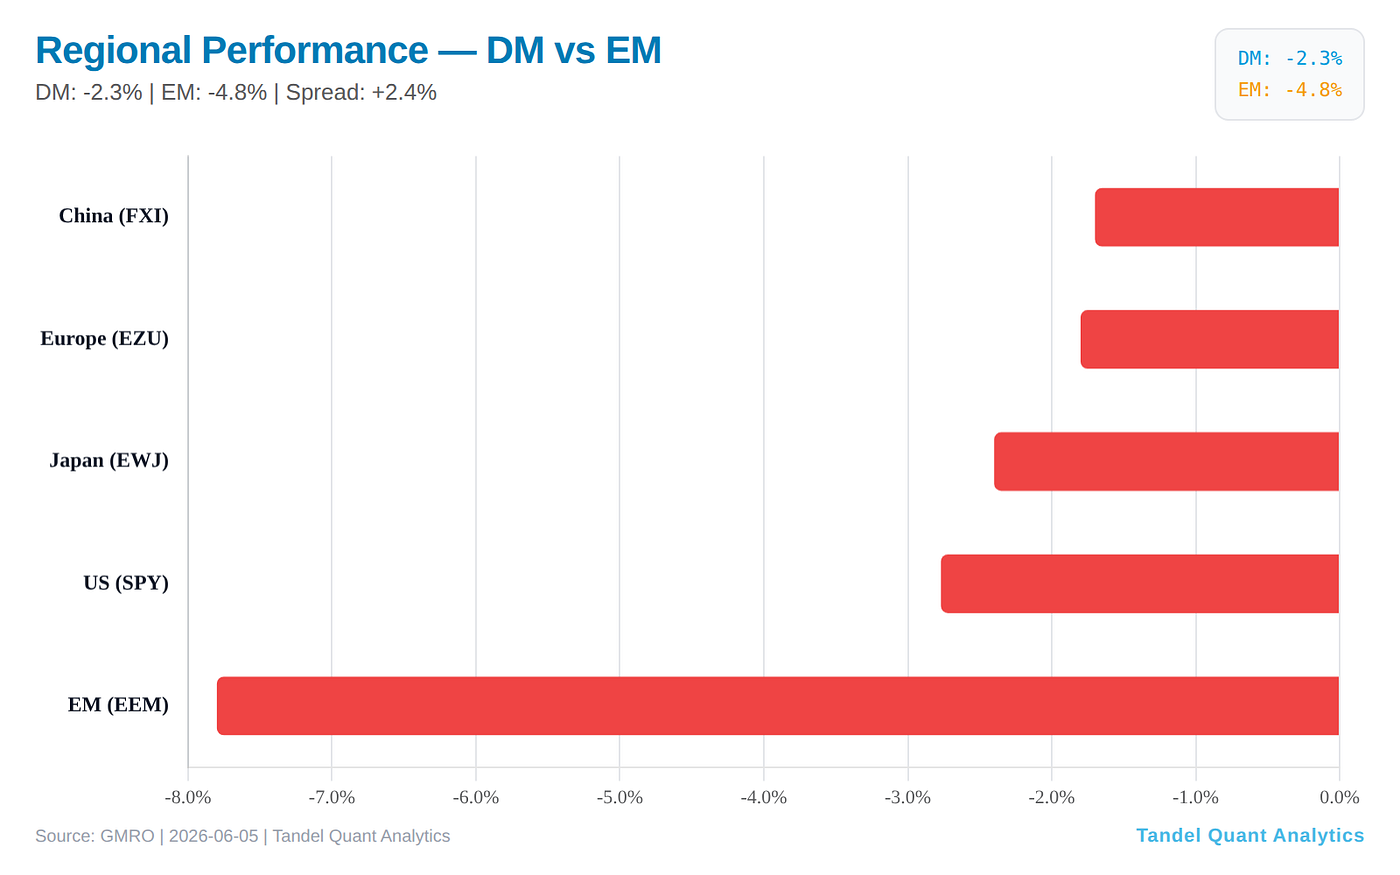
Every region fell on the week; EM gave back the most while holding the widest YTD lead.
Every Region Fell, but the Ranking Inverts Year-to-Date
The five-region performance matrix was uniformly negative. EM (EEM) led the decline at -7.80% on the week, followed by US (SPY) -2.77%, Japan (EWJ) -2.40%, Europe (EZU) -1.80%, and China (FXI) -1.70%. Developed markets fell -2.32% against -4.75% for emerging markets — a +2.43% spread favoring DM.
The year-to-date picture nearly reverses that order. EM still leads everything at +18.06%, Japan holds +12.36%, the US +8.45%, Europe +5.51%, and China sits alone in the red at -9.25%. The week was a give-back concentrated in the assets that had run the furthest into the year.
Why the Volatility Regime Reads HIGH When the VIX Is Calm
The headline reading is HIGH, but the inputs are split three ways. VIX at 15.4 is NORMAL. VSTOXX at 18.56 is NORMAL. The HIGH classification is carried almost entirely by VHSI at 28.37 — Hong Kong volatility is the outlier. This is a regional stress signal rather than a broad fear spike, and the synthesis layer treats it accordingly.
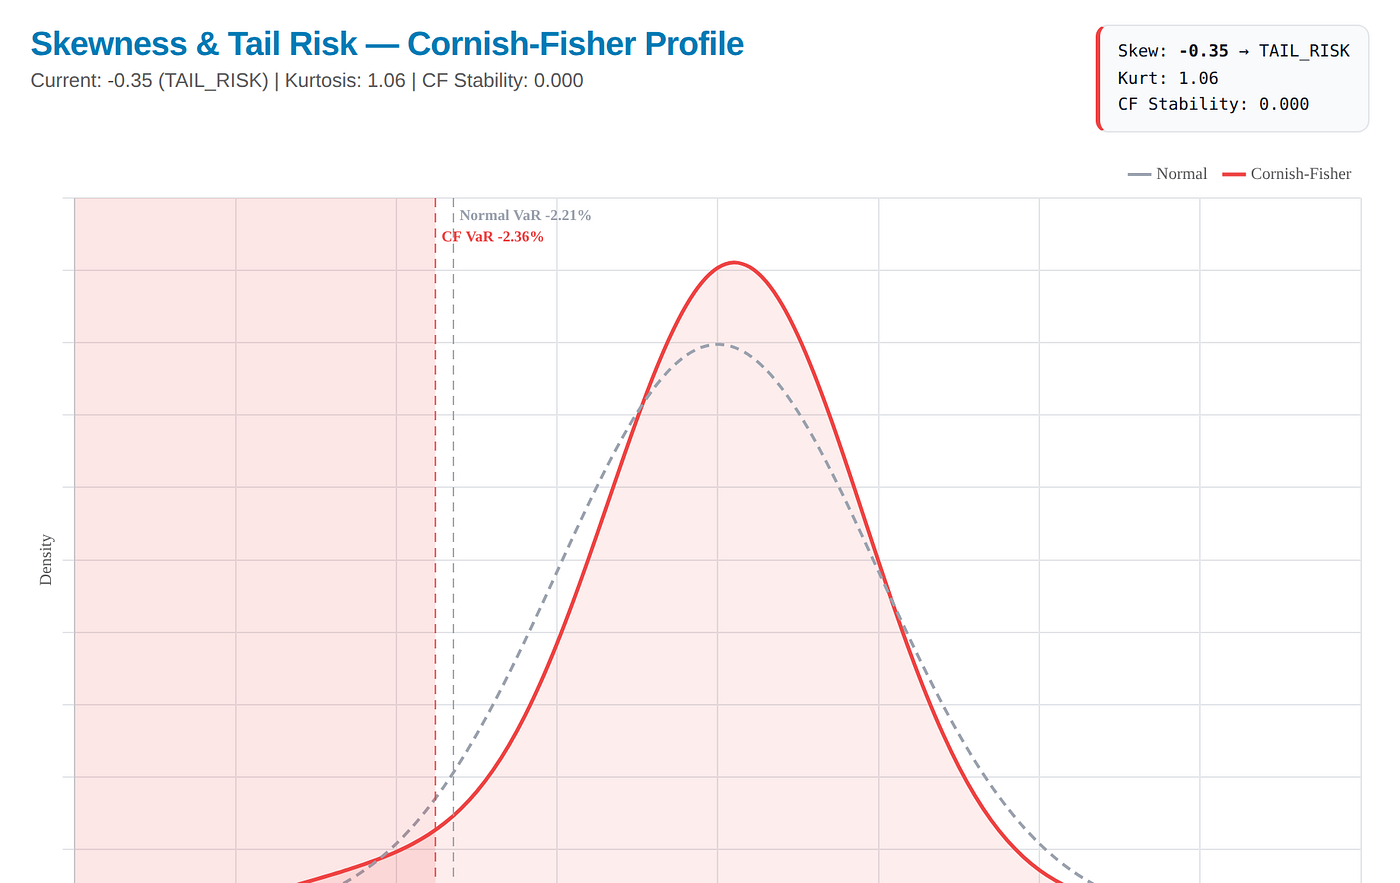
The global hidden-Markov-model synthesis reinforces the fracture: cross-region tail-stability of 0.622, a 37.8% regime-shift probability, and DIVERGENT regional alignment. Skewness splits cleanly — Europe (+0.30) and APAC (+0.24) carry positive tails while the US (-0.19) and EM (-0.44) carry negative ones, netting to a global skew of exactly 0.00.
The out-of-sample walk-forward blend across all four regional engines produces a global probability-weighted trend-confidence score of +0.169 and a 0.920x position-size multiplier, with mixed alignment and average confidence of 0.69. The signal is mildly constructive but explicitly de-risked.
Every region fell on the week; EM gave back the most while holding the widest YTD lead.
The Policy Map Has One Easer Left
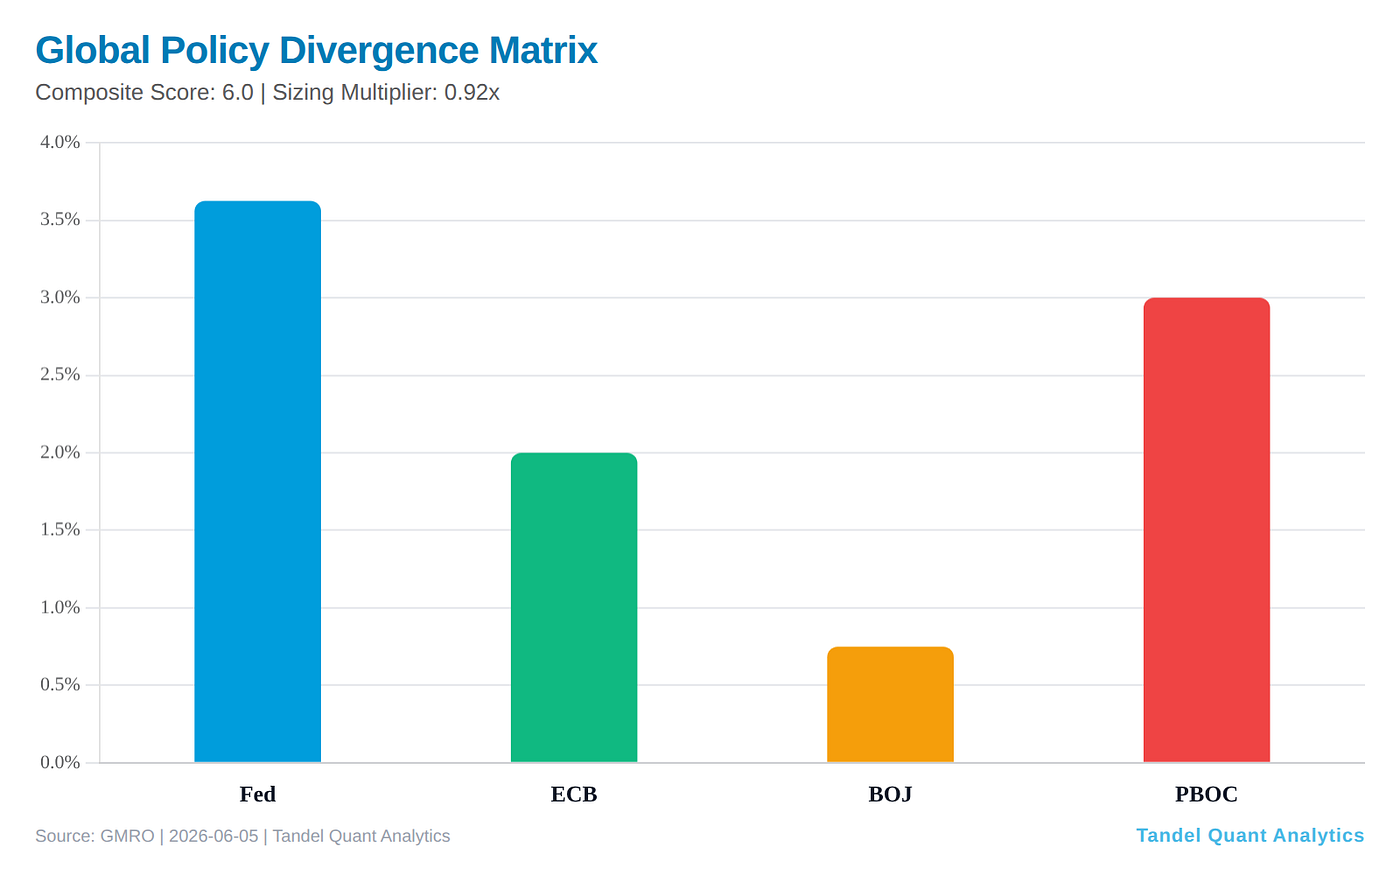
Three of four major central banks read hawkish: the Fed at 3.625%, the ECB at 2.00%, and the BOJ at 0.75%. The PBOC at 3.00% is the only dovish stance on the board. The widest gap is BOJ–Fed at -288bp, with ECB–Fed at -162bp and PBOC–Fed at -62bp, for a total divergence score of 6.
That single easer sitting in the highest-volatility region is the central tension of the report. China is the only place receiving policy support — and simultaneously the worst year-to-date performer with elevated local volatility.
Where the Selection Model Points
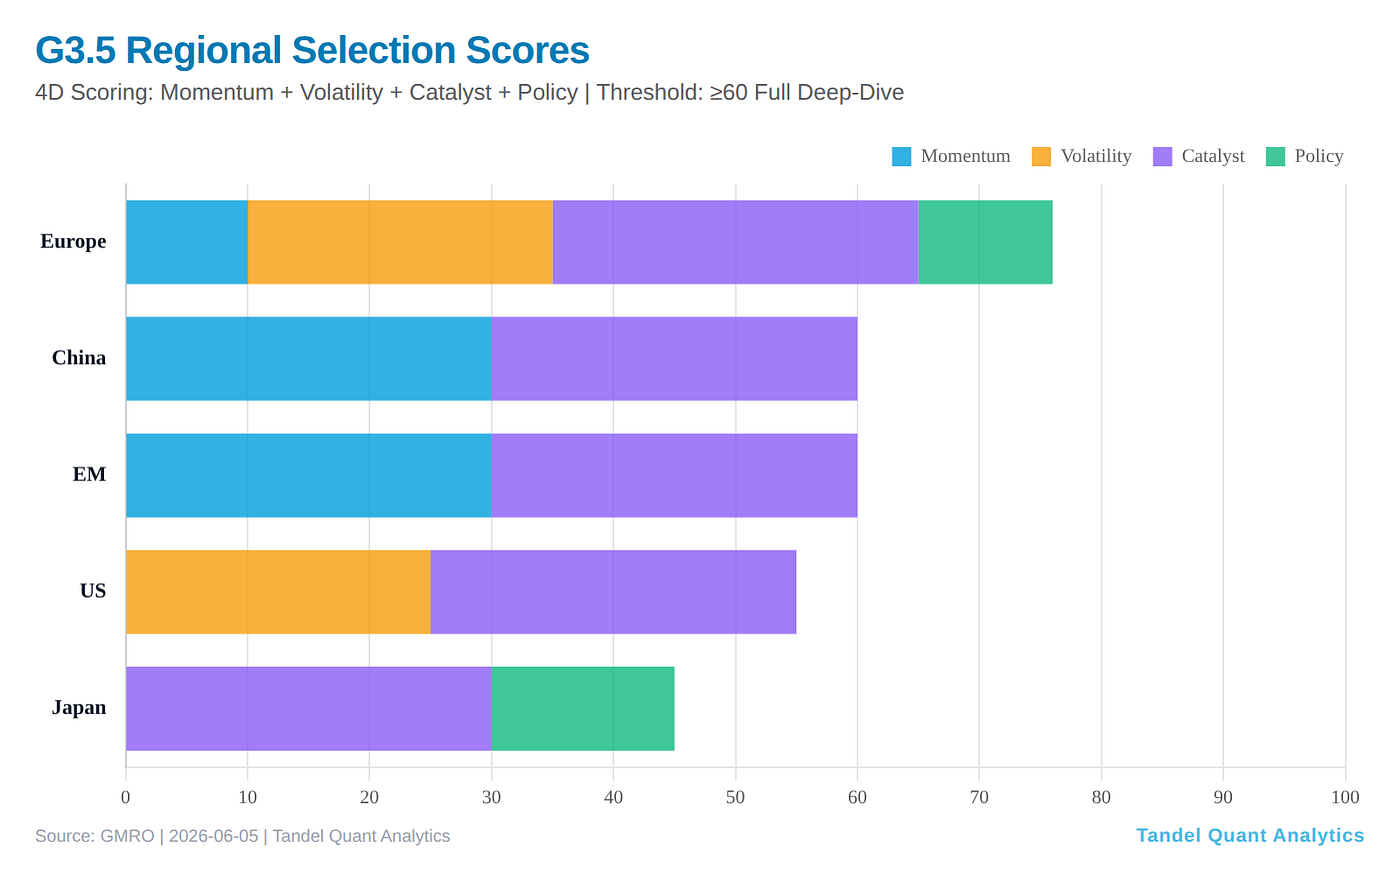
Europe leads the four-dimension selection score on balance rather than a single dominant input.
The G3.5 selection layer scores four dimensions: momentum, volatility, catalyst, and policy. Europe ranks first at 19.9, China and EM tie at 18.0, the US follows at 15.2, and Japan trails at 11.2. All five regions cleared the threshold to route to the scorecard, with Europe leading on a balanced profile rather than one outsized input.
FX Is the Pressure Point
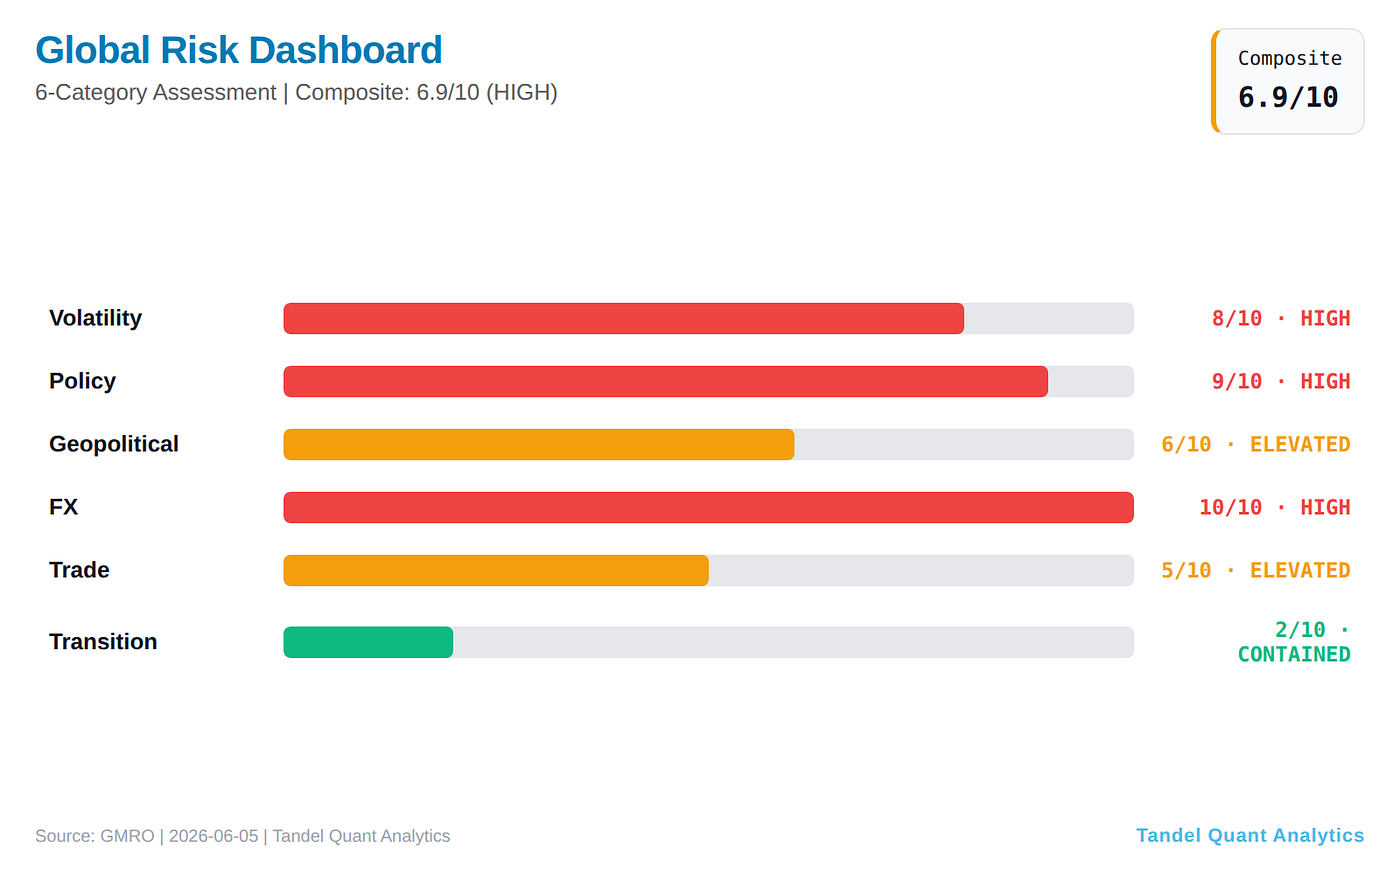
FX risk is maxed at 10/10 — the currency channel, not equity volatility, is the dominant vector.
The composite risk reading is HIGH at 6.9/10. FX risk is maxed at 10/10, Policy at 9/10, and Volatility at 8/10 — all HIGH. Geopolitical (6/10) and Trade (5/10) register ELEVATED. Transition risk is the lone calm category at 2/10, CONTAINED. The currency channel, not equity volatility, is the dominant risk vector this week.
How the Allocation Model Responds
The proprietary allocation engine, running the HMM walk-forward method, reads the dominant regime as MODERATE (54.3% probability) with the trend above its 200-day moving average. The regime probability vector is 28.9% risk-on, 54.3% moderate, 0.3% risk-cautious, and 16.5% risk-off.
Final regional weights come out at US 49.7%, Europe 23.4%, APAC 16.7%, and EM 10.2%. The US weight was lifted from a 36.9% regime-base by an applied policy tilt; the EM weight was cut from 16.9% by a 0.65x risk-dampening overlay. The SMA-200 overlay is inactive because the trend sits above the line. The model leans into US quality and trims EM exposure precisely because EM carries the week’s drawdown and the FX stress. Engine confidence on the run is 0.97.
Key Takeaways
- Every region fell on the week (DM -2.32%, EM -4.75%), but EM still leads year-to-date at +18.06%.
- The volatility regime reads HIGH on VHSI (28.37) alone — VIX and VSTOXX are both NORMAL.
- The PBOC is the only major central bank still easing, and it sits in the highest-volatility region.
- FX risk is the dominant vector at 10/10, ahead of policy (9/10) and volatility (8/10).
- The allocation model tilts to US quality (49.7%) and dampens EM (10.2%) while the trend stays above its moving average.
The single most important read: a trend still above its moving average is keeping the regime MODERATE and the allocation tilted toward equities, even as the risk dashboard flashes HIGH on FX and policy. The next move hinges on whether Hong Kong volatility normalizes or drags the global composite higher.
For weekly systematic global analysis, subscribe to Tandel Quant Analytics on Substack. All charts and methodology are freely available to subscribers.
About the Author
Tandel publishes systematic market analysis using quantitative frameworks including EMRA, EEMRA, EAPMRA, GMRO, and U-VCT. Subscribe on Substack for weekly reports.
메타데이터
- post_id
- 2e42663d939f
- slug
- global-market-regime-turns-high-on-fx-stress-a-systematic-read-2e42663d939f
- url
- https://medium.com/@tandel/global-market-regime-turns-high-on-fx-stress-a-systematic-read-2e42663d939f
- canonical_url
- https://medium.com/@tandel/global-market-regime-turns-high-on-fx-stress-a-systematic-read-2e42663d939f
- author_url
- https://medium.com/@tandel
- status
- ok
- fetched_at
- 2026-06-12 07:40:50