How we track Iranian crude oil exports using Sentinel-1 SAR satellite imagery
How SAR radar shadows reveal Kharg Island crude storage levels — 4–7 weeks before EIA or JODI data is published
How we track Iranian crude oil exports using Sentinel-1 SAR satellite imagery
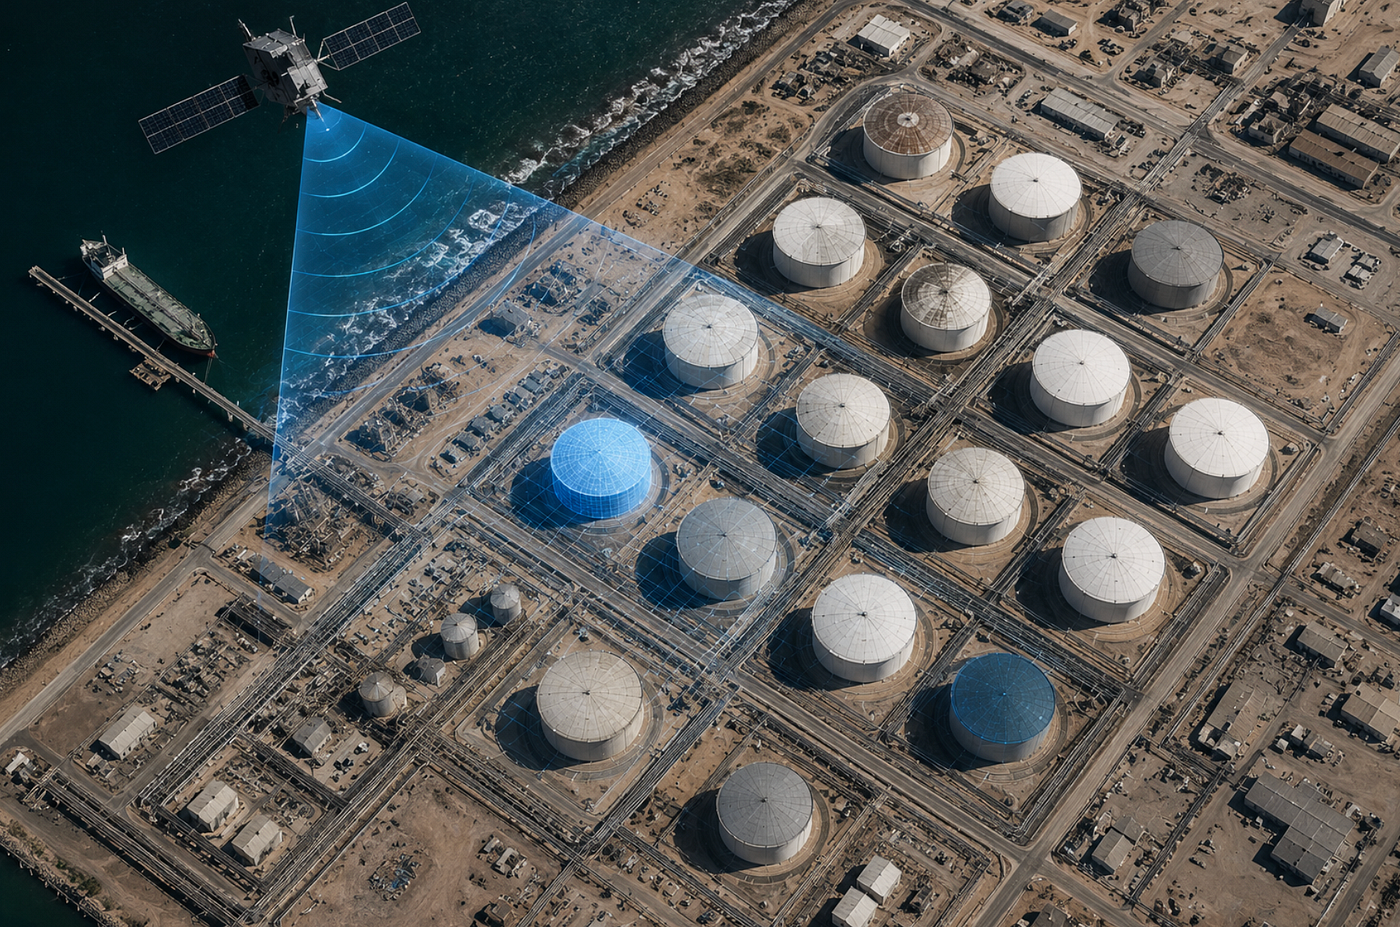
How SAR radar shadows reveal Kharg Island crude storage levels — 4–7 weeks before EIA or JODI data is published
Official Iranian crude export data does not exist in any reliable form. Iran does not report to JODI. EIA estimates are survey-based and lag 4–8 weeks. AIS transponders on tankers loading at Kharg Island are frequently disabled or manipulated by shadow fleet operators.
This creates a gap — and a signal opportunity. If you cannot track the tankers, track what the tankers are loading from.
Why Kharg Island
Kharg Island handles approximately 90% of Iranian crude oil exports. It is a single, fixed, observable location. The terminal has been operational for decades and its tank farm infrastructure is well-documented in public satellite imagery archives.
Any change in Iranian crude supply to the global market must pass through Kharg Island’s storage tanks before it reaches a tanker. This makes the terminal a natural chokepoint — not just physically, but informationally.
The physical principle
Oil storage tanks at major export terminals use floating roofs — large metal discs that sit directly on the oil surface and rise or fall as the tank fills or empties. This design exists to minimize evaporation and vapor accumulation.
The implication for remote sensing: the roof position is a direct proxy for the fill level.
Sentinel-1 is a European Space Agency radar satellite operating in C-band (5.4 GHz). Unlike optical satellites, SAR (Synthetic Aperture Radar) transmits its own microwave signal and measures the reflection. It operates through clouds and at night.
When the SAR signal hits a floating roof tank, the geometry of the return depends on the roof’s vertical position. A low roof (near-empty tank) produces a different radar backscatter signature than a high roof (full tank). Specifically, the internal cylindrical wall of the tank becomes exposed as the roof drops — and that wall creates a measurable radar reflection pattern.

This is a passive, physical measurement. The tank either has oil in it or it doesn’t.
Volume estimation
Tank geometry at Kharg Island is measurable from publicly available satellite imagery. For a cylindrical floating roof tank, the volume relationship is straightforward:
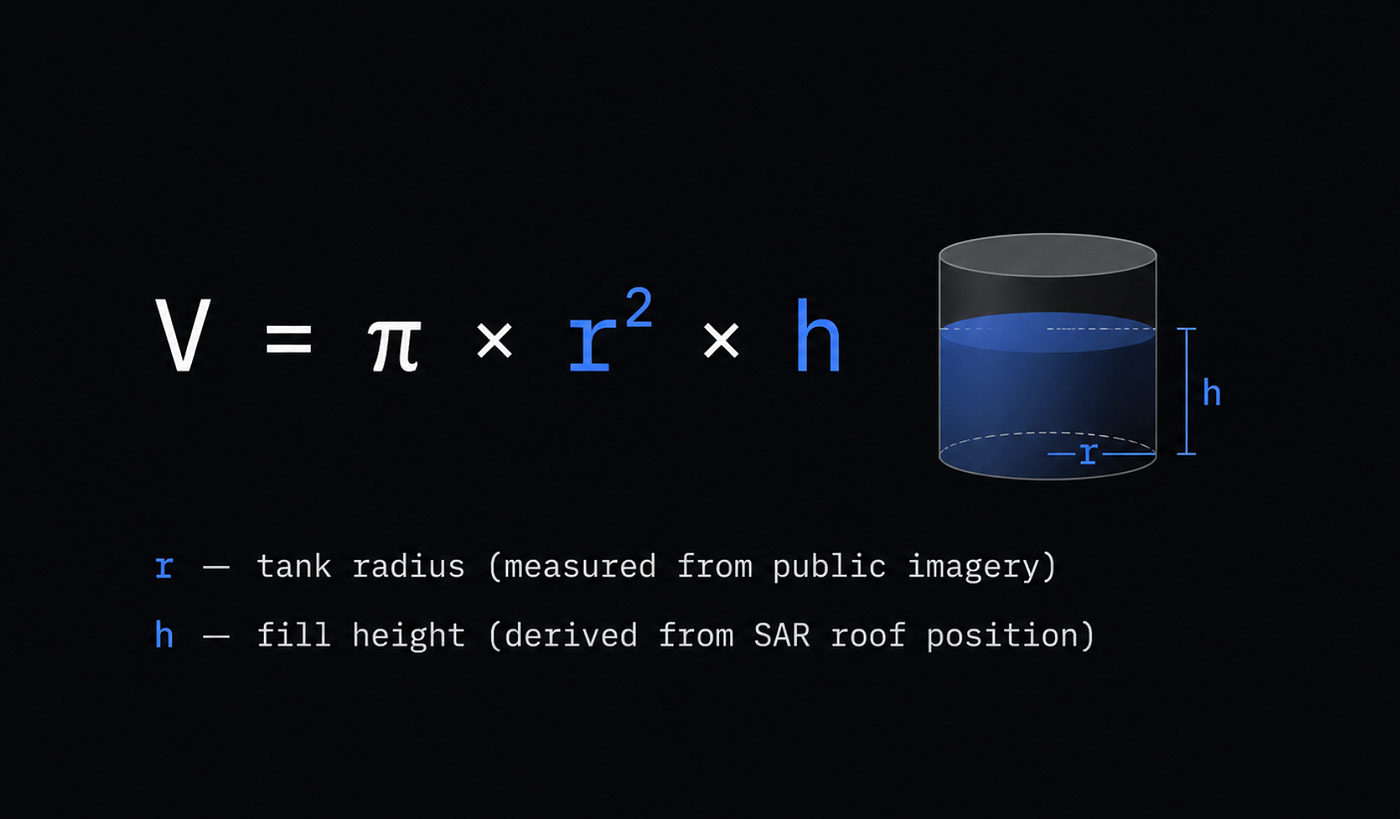
Where r is the tank radius (fixed, measured from imagery) and h is the fill height derived from the SAR-observed roof position.
Individual tank readings are aggregated across the terminal to produce a total storage level in million barrels.
Sentinel-1 covers Kharg Island on a regular revisit cycle — typically 2–3 passes per week, depending on the acquisition mode and orbital geometry. Each pass produces an independent reading.
Calibration
This is the section most satellite analytics providers skip. We won’t.
SAR-based volume estimates carry inherent uncertainty. Roof position inference from radar backscatter is an indirect measurement, and the relationship between signal and fill level is not perfectly linear across all tank conditions and radar incidence angles.
We calibrate and validate the signal using several reference points:
- AIS cross-reference. When tanker AIS data is available for Kharg (which is not always the case, but occurs with enough frequency to be useful), we cross-reference observed loading events against storage drawdown signatures in the SAR record. A confirmed tanker loading window should correspond to a measurable storage decrease. This gives us directional ground truth.
- JODI and EIA historical alignment. Monthly aggregate export data from JODI and EIA, despite their lag, provides a reference for cumulative directional trends. We do not use these sources as real-time signals — but over rolling 60–90 day windows, a sustained SAR-observed storage draw should correlate with a confirmed export increase in subsequent official data.
- Internal consistency checks. Physically impossible readings — such as storage levels exceeding known tank capacity or implying fills faster than any pump rate could achieve — are flagged and excluded.
What this gives us: high confidence in the direction and relative magnitude of storage changes. Absolute precision in million barrels is less reliable and should not be treated as exact inventory accounting. The signal is: is storage building or drawing, and at what pace?
That distinction — direction and pace, not precision — is what drives the market signal.
What the signal looks like in practice
A sustained storage build at Kharg Island — measured over multiple consecutive SAR passes — indicates one of three conditions: Iranian production is outpacing tanker loading, tankers are delayed (weather, sanctions pressure, insurance issues), or export volumes are intentionally being withheld.
A storage drawdown indicates active loading. Oil is moving from tanks to tankers. Supply is entering the market.

This dynamic appears in the SAR record 4–7 weeks before the corresponding supply change shows up in official EIA or JODI statistics. The tanker still needs to sail, discharge, and be reported — but you see the loading signal at source before any of that happens.
Historical analysis of our dataset since March 2023 shows:
- When pre-event storage was rising at Kharg, a subsequent geopolitical shock caused a confirmed export bottleneck in 86% of observed cases
- Insurance premium spikes are the hardest-hitting systemic factor — average +0.41 million barrel storage accumulation within 5 weeks
- Shadow fleet sanctions take approximately 7 weeks to reach the exporter’s berths in the observed data
Conclusions
- Sentinel-1 SAR satellite imagery enables direct physical measurement of crude oil storage at Kharg Island, independent of official reporting or AIS data
- The signal is based on floating roof tank geometry — a passive, physical measurement immune to transponder manipulation
- Volume estimates carry uncertainty; the reliable output is directional signal (build vs. drawdown) and relative pace of change
- Calibration relies on AIS cross-reference where available, historical JODI/EIA alignment over 60–90 day windows, and internal consistency checks
- The export signal appears 4–7 weeks ahead of official data — sufficient lead time to be actionable for physical oil market participants.
For questions or discussion, reach out on LinkedIn. Live Kharg Island storage data is available at oilradar.io/monitor.
메타데이터
- post_id
- 2e550a114d90
- slug
- how-we-track-iranian-crude-oil-exports-using-sentinel-1-sar-satellite-imagery-2e550a114d90
- url
- https://medium.com/@somewho/how-we-track-iranian-crude-oil-exports-using-sentinel-1-sar-satellite-imagery-2e550a114d90
- canonical_url
- https://medium.com/@somewho/how-we-track-iranian-crude-oil-exports-using-sentinel-1-sar-satellite-imagery-2e550a114d90
- author_url
- https://medium.com/@somewho
- status
- ok
- fetched_at
- 2026-07-14 17:26:50