Technical Analysis vs Price Action: What Is the Difference?
Introduction
Technical Analysis vs Price Action: What Is the Difference?
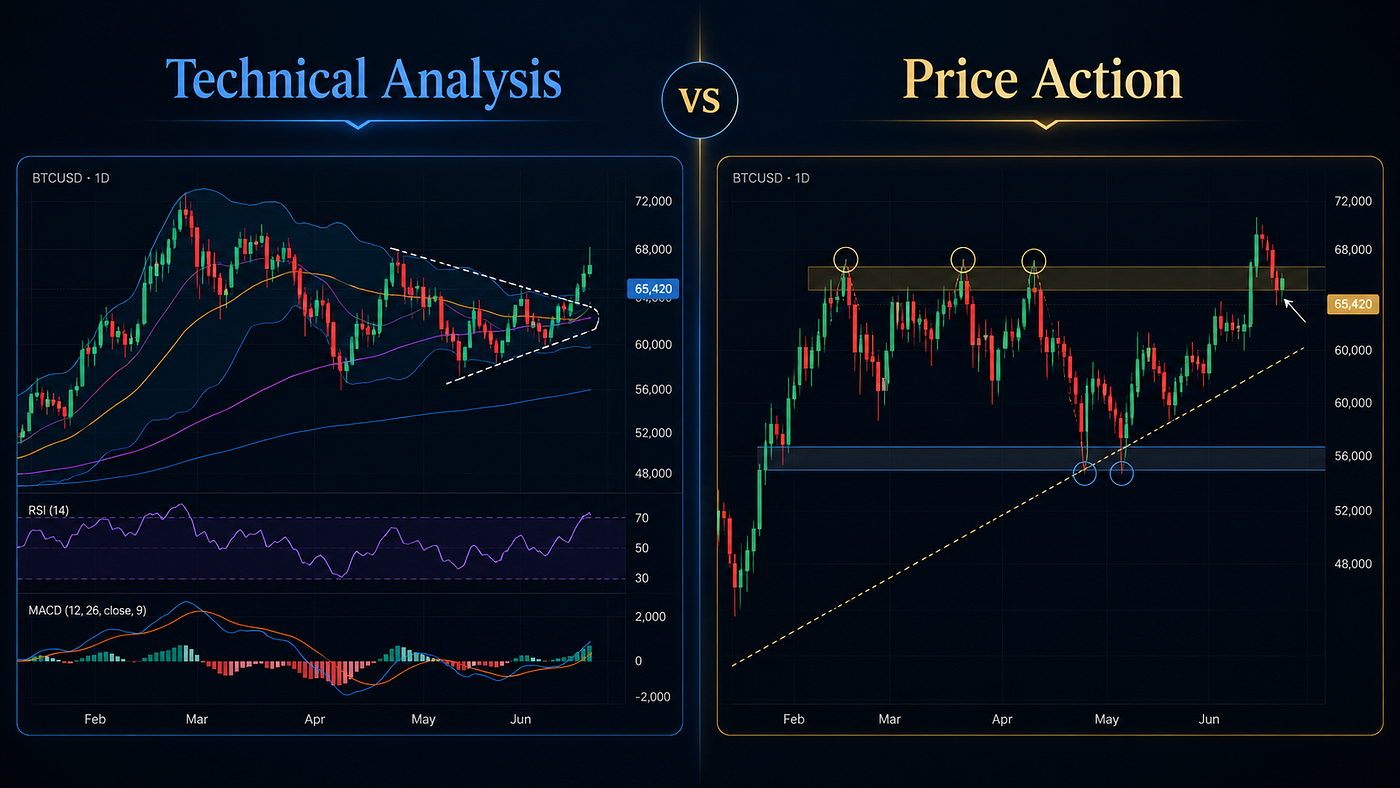
Technical Analysis Vs price Action
Introduction
Technical analysis vs price action is one of the most common comparisons new traders face when they start learning charts. Both methods help traders study market behavior, but they do it in different ways. Technical analysis often uses indicators, overlays, oscillators, chart patterns, and mathematical tools. Price action focuses more directly on raw price movement, candlestick behavior, support, resistance, trend structure, and market psychology.
Many traders treat these two approaches as opposites. That is not always correct. Price action is actually a part of technical analysis. However, in practical trading, people often use the term “technical analysis” to describe indicator-based trading and the term “price action” to describe clean chart reading without too many indicators.
Understanding the difference matters because every trader needs a method that fits their personality, time frame, and risk tolerance. Some traders prefer moving averages, RSI, MACD, Bollinger Bands, and volume indicators. Others prefer naked charts, trendlines, candlestick patterns, and support-resistance zones. Some of the best traders combine both approaches.
In this article, we will explain technical analysis vs price action in a simple and practical way. You will learn how each method works, where each one performs well, where each one fails, and how traders can combine them with the Financial Astrology Terminal at finance.rajeevprakash.com for better market timing, chart study, watchlists, global stocks, indices, commodities, and financial astrology-based timing insights.
What Is Technical Analysis?
Technical analysis is the study of price charts, volume, indicators, patterns, and historical market behavior to make trading decisions. Traders use technical analysis because markets often move in trends, repeat certain patterns, and react around important price levels.
A technical trader may use moving averages to identify trend direction. They may use RSI to study momentum. They may use Bollinger Bands to read volatility. They may use MACD to track momentum shifts. They may also use chart patterns to find breakouts and reversals.
The core idea behind technical analysis is that price reflects available market information. Instead of studying only company earnings, economic data, or news, technical traders study how the market reacts to all that information.
For example, if a stock keeps making higher highs and higher lows, a technical trader may view it as an uptrend. If price stays below a falling moving average, the trader may see weakness. If volume increases during a breakout, the trader may see stronger participation.
This makes technical analysis useful for stocks, indices, commodities, forex, crypto, ETFs, and futures.
For traders who want to study volatility-based tools, the guide on Bollinger Bands in Technical Analysis gives a helpful starting point.
What Is Price Action?
Price action is the study of raw price movement. It focuses on what price is doing now compared with what it did earlier. Price action traders usually rely on candles, swings, support, resistance, trendlines, breakouts, failed breakouts, pullbacks, and market structure.
A price action trader may ask simple questions.
Is price making higher highs and higher lows?
Is price respecting support?
Is price rejecting resistance?
Is the breakout strong or weak?
Are buyers defending a key level?
Are sellers losing control?
Price action traders often use fewer indicators. Some may trade with no indicators at all. They believe price itself gives the clearest signal. Indicators can help, but they can also lag because most indicators are calculated from past price data.
For example, a trader may see price reject the same support zone three times. The trader may not need an oscillator to understand that buyers are active in that area. If price later breaks above resistance, the trader may treat it as a sign of strength.
This makes price action simple, flexible, and useful across markets. However, it also requires skill and experience because the trader must interpret structure without relying too much on indicator signals.
Technical Analysis vs Price Action: The Main Difference
The main difference in technical analysis vs price action is the source of decision-making.
Technical analysis often uses tools derived from price, volume, and mathematical calculations. Price action uses the raw chart itself. Technical analysis may include moving averages, RSI, MACD, Bollinger Bands, Fibonacci levels, trend indicators, volatility bands, and chart patterns. Price action focuses more on support, resistance, candles, breakouts, pullbacks, and trend structure.
In simple terms, technical analysis asks, “What do the indicators and chart tools say?”
Price action asks, “What is price actually doing?”
Both questions matter. Indicators can simplify complex data. Price action can keep traders close to real market behavior. The best approach depends on the trader.
A beginner may find indicators helpful because they provide structure. An experienced trader may prefer price action because it feels cleaner and faster. A swing trader may combine both. A day trader may depend heavily on price action around key levels but use moving averages for trend direction.
Why Traders Use Technical Analysis
Traders use technical analysis because it gives structure. Markets can feel chaotic. Indicators help organize price movement into clearer signals.
Moving averages smooth price data and show trend direction. RSI helps traders read momentum and overbought or oversold conditions. Bollinger Bands show volatility expansion and contraction. Volume indicators help traders judge participation. Chart patterns help identify breakouts and reversals.
Technical analysis also helps traders create rules. A trader may decide to buy only when price closes above the 50-day moving average and RSI stays above 50. Another trader may enter only when price breaks resistance with high volume.
Rules reduce emotional decision-making. They also make backtesting easier. Traders can test whether a strategy worked in the past. While past results do not guarantee future performance, testing can help traders avoid random decisions.
The article on Moving Average Crossover Strategy explains how traders use moving averages to build rule-based systems.
Why Traders Use Price Action
Traders use price action because it keeps the chart clean. Instead of waiting for indicators to confirm what price has already done, price action traders focus on the current battle between buyers and sellers.
Price action helps traders understand market psychology. A long bullish candle from support may show strong demand. A failed breakout above resistance may show buyer exhaustion. A series of higher lows may show accumulation. A sharp rejection from resistance may show aggressive selling.
Price action also adapts quickly. Indicators may lag during sudden reversals. Price action traders may spot weakness earlier through candle structure, failed highs, or support breaks.
For example, if price forms a double top near resistance and then breaks below the neckline, a price action trader may see a bearish shift. They may not need MACD or RSI to confirm the move. However, they may still use those tools for extra confidence.
Price action works well for traders who like simplicity, patience, and direct chart reading.
Strengths of Technical Analysis
Technical analysis has several strengths. First, it helps traders create repeatable systems. Clear indicator rules can reduce emotional decisions. This is useful for beginners and systematic traders.
Second, technical analysis can process different market conditions. Trend indicators help in trending markets. Volatility indicators help during expansion and compression. Momentum indicators help measure strength. Volume tools help confirm participation.
Third, technical analysis works across time frames. A trader can use moving averages on daily charts, RSI on hourly charts, and Bollinger Bands on intraday charts.
Fourth, technical analysis supports screening. Traders can scan hundreds of stocks for specific signals. For example, they can search for stocks above the 200-day moving average or stocks breaking out of a range.
However, technical analysis can become too complex. Many traders add too many indicators and receive conflicting signals. A chart filled with tools can create confusion instead of clarity.
Strengths of Price Action
Price action also has powerful strengths. First, it is direct. Traders study price itself, not a delayed calculation of price.
Second, price action helps traders understand context. A support level, rejection candle, breakout, or failed breakdown often tells a clear story about market behavior.
Third, price action works well around key levels. Many important trading decisions happen near support, resistance, previous highs, previous lows, trendlines, and breakout zones.
Fourth, price action keeps traders flexible. Instead of waiting for a rigid indicator signal, traders can respond to changing market structure.
However, price action is not easy. It can feel subjective. Two traders may look at the same chart and draw different support levels. One may see a breakout. Another may see a trap. Experience matters.
This is why price action traders need strong discipline, clean rules, and consistent journaling.
Weaknesses of Technical Analysis
The first weakness of technical analysis is lag. Most indicators use past price data. By the time an indicator gives a signal, part of the move may already be over.
The second weakness is over-optimization. Traders may adjust settings until a strategy looks perfect on old data. But that same strategy may fail in live markets.
The third weakness is indicator conflict. One indicator may show a buy signal while another shows weakness. This can lead to hesitation.
The fourth weakness is false confidence. A trader may believe that a complex system is more accurate simply because it has many indicators. Complexity does not always improve performance.
Technical analysis works best when traders use a few reliable tools and understand what each tool measures.
Weaknesses of Price Action
The biggest weakness of price action is subjectivity. A trader may misread candles, force patterns, or draw levels incorrectly. Without clear rules, price action can become guesswork.
Price action also requires patience. A trader must wait for structure, confirmation, and clean risk-reward. Beginners often enter too early because they think they see a setup before it confirms.
Another weakness is emotional bias. If a trader wants to buy, they may interpret a weak candle as bullish. If they want to sell, they may see resistance everywhere.
Price action works best when traders create a written plan. They should define what counts as support, what confirms a breakout, where the stop-loss goes, and when the trade idea becomes invalid.
Technical Analysis vs Price Action for Beginners
For beginners, the debate around technical analysis vs price action can feel confusing. The best starting point is not to choose one side blindly. Instead, beginners should learn both in a simple way.
A beginner can start with support and resistance, trend direction, candlestick structure, and basic chart patterns. Then they can add one or two indicators, such as a moving average and RSI.
This balanced approach prevents chart overload. It also teaches the trader to respect price first. Indicators should support the reading, not replace it.
For example, a beginner may identify an uptrend through higher highs and higher lows. Then they may use a 50-day moving average to confirm the trend. If price pulls back to support and holds, the trader may look for an entry. RSI can help judge whether momentum remains healthy.
This method combines the clarity of price action with the structure of technical analysis.
Technical Analysis vs Price Action for Swing Trading
Swing traders usually hold trades for several days or weeks. They can benefit from both methods.
Technical analysis helps swing traders identify trends, momentum shifts, and volatility conditions. Moving averages can show whether price is in a bullish or bearish phase. Bollinger Bands can show whether volatility is expanding or contracting. RSI can help spot momentum strength or divergence.
Price action helps swing traders find better entries. A trader may wait for a pullback to support, a breakout from a rectangle, or a rejection candle near a key level.
For swing trading, the best approach often combines both. Price action gives the setup. Technical analysis gives confirmation. Risk management controls the outcome.
The guide on Chart Patterns Every Technical Trader Should Know can help traders understand how pattern structure supports swing trading decisions.
Technical Analysis vs Price Action for Intraday Trading
Intraday traders need speed and precision. Price action is often very useful here because short-term price movement can change quickly.
An intraday trader may watch opening range breakouts, support retests, resistance rejections, VWAP reactions, and candle strength. Price action helps them react to the live market.
Technical indicators can still help. Moving averages may show intraday trend direction. Volume can confirm breakouts. Bollinger Bands can help identify volatility expansion. However, too many indicators can slow decision-making.
For intraday trading, clean charts often work better. Traders should focus on key levels, liquidity zones, volume, and risk control.
How to Combine Technical Analysis and Price Action
The strongest trading process often combines both methods.
Start with price action. Identify trend structure, support, resistance, breakout levels, and key zones. Then use technical indicators for confirmation.
For example, suppose a stock forms a higher low near support. Price then breaks above short-term resistance. A moving average may confirm that the trend is rising. RSI may confirm momentum. Volume may confirm participation.
Now the trader has more than one reason for the trade.
Another example could involve a Bollinger Band squeeze. The technical indicator shows low volatility. Price action shows a tight range. If price breaks resistance with strong volume, the trader may consider a bullish breakout.
This combination avoids the weakness of using either method alone. Price action keeps traders close to the market. Technical analysis adds structure and confirmation.
Risk Management in Both Methods
Risk management matters more than the method itself. A trader can use technical analysis and still lose money without discipline. A trader can use price action and still fail without stop-loss rules.
Every trade should have a planned entry, stop-loss, target, and position size. The stop-loss should sit where the trade idea becomes invalid.
In a breakout trade, the stop may sit below the breakout level. In a support bounce, the stop may sit below support. In a moving average strategy, the stop may depend on trend failure.
Position sizing should match risk. If the stop is wide, the position size should be smaller. If volatility is high, traders should reduce risk.
Good traders protect capital first. Profit comes second.
How the Financial Astrology Terminal Adds a Timing Layer
The Financial Astrology Terminal at finance.rajeevprakash.com helps traders combine technical charts, price action, market data, watchlists, global stocks, indices, commodities, and financial astrology-based timing insights in one place.
This matters because both technical analysis and price action show what is happening on the chart. But traders also need to think about timing. A good setup can fail if entered too early. A breakout can take longer than expected. A support zone can hold for days before price moves.
The Financial Astrology Terminal adds a timing perspective to traditional chart analysis. Traders can study watchlists, market behavior, global assets, and timing windows together. This can help them prepare for volatility, avoid impulsive entries, and plan trades with more discipline.
For example, a trader may see price action forming a breakout pattern in gold, Nifty, Nasdaq, crude oil, or a major stock. Technical indicators may confirm momentum. The terminal can then help the trader study timing conditions and broader market context before acting.
This does not replace price confirmation. It adds another layer to the decision-making process.
Common Mistakes Traders Should Avoid
The first mistake is treating technical analysis and price action as enemies. They can work together.
The second mistake is using too many indicators. A cluttered chart can confuse traders and delay decisions.
The third mistake is trading price action without rules. Clean charts are useful only when the trader has a clear process.
The fourth mistake is entering without confirmation. A support zone is not enough. A breakout line is not enough. A moving average signal is not enough. Traders need context.
The fifth mistake is ignoring risk-reward. A trade can look good and still be poor if the potential reward is too small compared with the risk.
The sixth mistake is not reviewing trades. Traders should journal entries, exits, reasons, emotions, and outcomes. This helps improve both technical analysis and price action skills.
Which Method Is Better?
The question is not whether technical analysis or price action is better. The better question is which method helps the trader make clearer decisions.
Technical analysis works well for traders who want structure, rules, scans, and indicator confirmation. Price action works well for traders who want clean charts, direct market reading, and flexible interpretation.
Most traders benefit from a combination. Price action can define the setup. Technical indicators can confirm the setup. Risk management can protect the account. Timing tools can improve patience and planning.
A trader who understands both methods has an advantage. They can read the chart, confirm the signal, and manage risk with greater confidence.
Conclusion: Technical Analysis vs Price Action Is About Process, Not Ego
Technical analysis vs price action should not become a debate about which method is superior. Both methods help traders understand the market. Technical analysis gives structure through indicators, volatility tools, moving averages, and chart patterns. Price action gives direct insight into support, resistance, trend structure, candles, and market psychology.
The strongest traders often combine both. They read price first. Then they use selected tools to confirm what they see. They avoid clutter. They respect risk. They wait for confirmation. They manage trades with discipline.
A trader does not need a perfect system. A trader needs a repeatable process. That process should include market context, clean chart reading, confirmation tools, stop-loss placement, position sizing, and emotional control.
메타데이터
- post_id
- 2eae37e2de0b
- slug
- technical-analysis-vs-price-action-what-is-the-difference-2eae37e2de0b
- url
- https://medium.com/@astroamazing/technical-analysis-vs-price-action-what-is-the-difference-2eae37e2de0b
- canonical_url
- https://medium.com/@astroamazing/technical-analysis-vs-price-action-what-is-the-difference-2eae37e2de0b
- author_url
- https://medium.com/@astroamazing
- status
- ok
- fetched_at
- 2026-06-09 15:37:30