Deploying a Netflix Clone: 🍿CI/CD Pipeline with Jenkins | Docker | Kubernetes | Monitoring |…
Hey techies! I’m excited to share a project where we’ll deploy a Netflix clone using Jenkins for CI/CD, running on Docker and a Kubernetes…
Deploying a Netflix Clone: 🍿CI/CD Pipeline with Jenkins | Docker | Kubernetes | Monitoring | DevSecOps 🌻

Hey techies! I’m excited to share a project where we’ll deploy a Netflix clone using Jenkins for CI/CD, running on Docker and a Kubernetes cluster. We’ll also monitor everything using Grafana, Prometheus, and Node Exporter to keep tabs on Jenkins and Kubernetes metrics. 📊 I hope this detailed blog is useful.
Workflow Diagram of my Project-

So let’s get started 🏃♀
Below is the code for Netflix, the Jenkinsfile, and everything else you will need, including the Dockerfile, all of which play a crucial role in today’s project. Visit for more information.
Prerequisite-
Before we embark on our DevSecOps journey, let’s ensure we have the necessary setup in place. Here are the prerequisites:
- Launch an EC2 Instance — Begin by launching an EC2 instance on the Ubuntu image of T2.Large. Allocate a storage capacity of at least 35GB to ensure smooth operations throughout the deployment process.
- Install Jenkins- Install Jenkins on your EC2 instance. Jenkins serves as the cornerstone of our CI/CD pipeline, facilitating automated building, testing, and deployment of our software projects.
- Install Docker- Docker is essential for containerizing our applications, providing consistency and portability across different environments. Install Docker on your EC2 instance to leverage its powerful containerization capabilities.
- Install SonarQube- SonarQube, integrated with Jenkins, automates code quality analysis and security vulnerability detection in the CI/CD pipeline. It identifies bugs, code smells, and security threats, aiding in technical debt management.
- Install Trivy Image- Trivy Image is a security tool used primarily for scanning container images for vulnerabilities. It analyzes Docker images and other container artifacts to detect known security issues within the software components and libraries they contain. Trivy helps ensure that containerized applications are free from common vulnerabilities, enhancing overall security posture in containerized environments.
Install Prometheus and Grafana on the new Instance-
- Launch an EC2 Instance — Begin by launching an EC2 instance on the Ubuntu image of T2.medium. Allocate a storage capacity of at least 12GB.
- Install Prometheus
- Install Node Exporter as Prometheus Style
- Install Grafana
- Now that’s all, let’s move on to the setup and get ready to create the project.
Follow Steps-
Write name and choose Ubuntu AMI

then scroll down and choose Instance Type- t2.large

Choose t2.large type instance
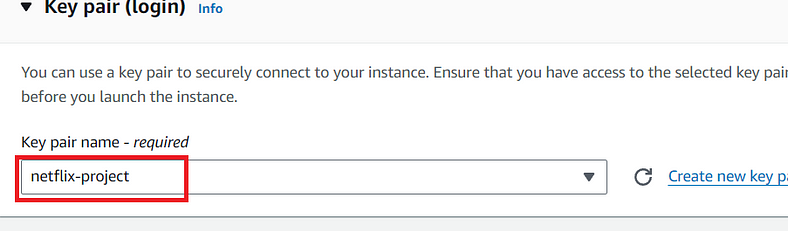
create a key pain if you don’t have

Edit the Network setting and give it to all traffic

now do this

and choose the storage 40 GB.

and then click on the launch instance
Connect to Ec2 Instance via ssh-
Now install Jenkins using these steps-
Firstly create file using vim jenkin.sh
vim jenkins.sh#!/bin/bash
sudo apt update -y
wget -O - https://packages.adoptium.net/artifactory/api/gpg/key/public | sudo tee /etc/apt/keyrings/adoptium.asc
echo "deb [signed-by=/etc/apt/keyrings/adoptium.asc] https://packages.adoptium.net/artifactory/deb $(awk -F= '/^VERSION_CODENAME/{print$2}' /etc/os-release) main" | sudo tee /etc/apt/sources.list.d/adoptium.list
sudo apt update -y
sudo apt install temurin-17-jdk -y
/usr/bin/java --version
curl -fsSL https://pkg.jenkins.io/debian-stable/jenkins.io-2023.key | sudo tee /usr/share/keyrings/jenkins-keyring.asc > /dev/null
echo deb [signed-by=/usr/share/keyrings/jenkins-keyring.asc] https://pkg.jenkins.io/debian-stable binary/ | sudo tee /etc/apt/sources.list.d/jenkins.list > /dev/null
sudo apt-get update -y
sudo apt-get install jenkins -y
sudo systemctl start jenkins
sudo systemctl status jenkins
now save this script
then execute Jenkins.sh
chmod +x ./jenkins.shthen run the script for jenkins
./jenkins.sh
It automatically starts installing Jenkins; it takes a few seconds.

As you can see the Jenkins status is “active” Now click “ctrl+C” to exit
Now Install Docker using these commands-
sudo apt installsudo apt update -ysudo apt install docker.io -ysudo usermod -a -G docker $USERIt is used in the current Docker group for permissions.
newgrp dockerIt switches the primary group to Docker for the current session.
sudo chmod 777 /var/run/docker.sockIt is granting universal read, write, and execute permissions to Docker socket.
Now, copy your EC2 instance’s IP address and paste it into your browser with port 8080, as shown in the figure below. 👇
<ec2-public-ip:8080>


sudo cat /var/lib/jenkins/secrets/initialAdminPasswordNow for Administrator Password copy that and paste it on the terminal by using “sudo cat”.

Now copy that and paste it on “Administrator Password”

and then click continue

Press on “Install suggested plugins”

wait for it..

Fill this out and remember the username and password whatever you put & press “save and continue”.

Save and Finish

Jenkins is ready! now “start using Jenkins”

Now your Jenkins is ready
Now we are creating SonarQube because, It identifies bugs, code smells, and security threats, aiding in technical debt management. Customizable quality gates ensure high-quality code deployment. Historical reporting tracks improvements, fostering continuous improvement and collaboration among development teams. And don’t forget to run it to port :9000
docker run -d --name sonar -p 9000:9000 sonarqube:lts-community
After download of this use the public IP with port:9000 in your browser
<ur-ec2-public-ip:9000>

Write “admin” in login and type also “admin” in password and then click on login

type “admin” in old password and then set ur new password and remember and then click on “update”
This is the sonarqube dashboard-

Now install Trivy following these steps-
vim trivy.shsudo apt-get install wget apt-transport-https gnupg lsb-release -y
wget -qO - https://aquasecurity.github.io/trivy-repo/deb/public.key | gpg --dearmor | sudo tee /usr/share/keyrings/trivy.gpg > /dev/null
echo "deb [signed-by=/usr/share/keyrings/trivy.gpg] https://aquasecurity.github.io/trivy-repo/deb $(lsb_release -sc) main" | sudo tee -a /etc/apt/sources.list.d/trivy.list
sudo apt-get update
sudo apt-get install trivy -y
save this script
chmod +x ./trivy.sh./trivy.sh
That’s all now Install Prometheus and Grafana On the new Server-
Launch other instance of t2.medium with 15 GB of storage

Write your instance name with “Ubuntu” ami and the instance type is “t2.medium” and then choose key pair name

Edit inboud rule and storage take at least of “15gb”
and then launch instance-

Connect to Ec2 Instance via SSH-
Then, execute the commands below one by one.
First, create a dedicated Linux user for Prometheus and download Prometheus:
sudo useradd --system --no-create-home --shell /bin/false prometheus
wget https://github.com/prometheus/prometheus/releases/download/v2.47.1/prometheus-2.47.1.linux-amd64.tar.gz
system — Will create a system account.
no-create-home — We don’t need a home directory for Prometheus or any other system accounts in our case.
shell /bin/false — It prevents logging in as a Prometheus user.
Prometheus — Will create a Prometheus user and a group with the same name.
Extract Prometheus files, move them, and create directories:
tar -xvf prometheus-2.47.1.linux-amd64.tar.gz
sudo mkdir -p /data /etc/prometheus
cd prometheus-2.47.1.linux-amd64/
sudo mv prometheus promtool /usr/local/bin/
sudo mv consoles/ console_libraries/ /etc/prometheus/
sudo mv prometheus.yml /etc/prometheus/prometheus.yml
Set ownership for directories:
sudo chown -R prometheus:prometheus /etc/prometheus/ /data/Now delete the archive and a Prometheus folder when you are done.
cd
rm -rf prometheus-2.47.1.linux-amd64.tar.gz
Verify that you can execute the Prometheus binary by running the following command:
prometheus --versionTo get more information and configuration options, run Prometheus Help.
prometheus --helpCreate a systemd unit configuration file for Prometheus:
sudo vim /etc/systemd/system/prometheus.serviceAdd the following content to the prometheus.service file:
[Unit]
Description=Prometheus
Wants=network-online.target
After=network-online.target
StartLimitIntervalSec=500
StartLimitBurst=5
[Service]
User=prometheus
Group=prometheus
Type=simple
Restart=on-failure
RestartSec=5s
ExecStart=/usr/local/bin/prometheus \
--config.file=/etc/prometheus/prometheus.yml \
--storage.tsdb.path=/data \
--web.console.templates=/etc/prometheus/consoles \
--web.console.libraries=/etc/prometheus/console_libraries \
--web.listen-address=0.0.0.0:9090 \
--web.enable-lifecycle[Install]
WantedBy=multi-user.targetHere’s a brief explanation of the key parts of this prometheus.service file:
UserandGroupspecify the Linux user and group under which Prometheus will run.ExecStartis where you specify the Prometheus binary path, the location of the configuration file (prometheus.yml), the storage directory, and other settings.web.listen-addressconfigures Prometheus to listen on all network interfaces on port 9090.web.enable-lifecycleallows for the management of Prometheus through API calls.
Enable and start Prometheus:
sudo systemctl enable prometheus
sudo systemctl start prometheusVerify Prometheus’s status:
sudo systemctl status prometheusThe easiest way to find the problem is to use the journalctl command and search for errors.
journalctl -u prometheus -f --no-pagerNow try to access it via browser with port:9090
http://<your-ec2-public-ip>:9090
As you can see, Prometheus is running, but there is nothing inside Prometheus after installing and setting up Node Exporter. However, after some time, you can see Node Exporter and Jenkins.
Install Node Exporter on Ubuntu 22.04
First, let’s create a system user for Node Exporter:
sudo useradd --system --no-create-home --shell /bin/false node_exporterwget command to download Prometheus:
wget https://github.com/prometheus/node_exporter/releases/download/v1.6.1/node_exporter-1.6.1.linux-amd64.tar.gzExtract the node exporter from the archive:
tar -xvf node_exporter-1.6.1.linux-amd64.tar.gzMove binary to the /usr/local/bin:
sudo mv node_exporter-1.6.1.linux-amd64/node_exporter /usr/local/bin/Clean up, and delete node_exporter archive and a folder:
rm -rf node_exporter*Verify that you can run the binary:
node_exporter --versionNode Exporter has a lot of plugins that we can enable. If you run Node Exporter help you will get all the options:
node_exporter --helpNext, create a similar systemd unit file:
sudo vim /etc/systemd/system/node_exporter.service[Unit]
Description=Node Exporter
Wants=network-online.target
After=network-online.target
StartLimitIntervalSec=500
StartLimitBurst=5
[Service]
User=node_exporter
Group=node_exporter
Type=simple
Restart=on-failure
RestartSec=5s
ExecStart=/usr/local/bin/node_exporter \
--collector.logind
[Install]
WantedBy=multi-user.targetTo automatically start the Node Exporter after reboot, enable the service:
sudo systemctl enable node_exporterThen start the Node Exporter:
sudo systemctl start node_exporterCheck the status of Node Exporter with the following command:
sudo systemctl status node_exporterIf you have any issues, check logs with journalctl
journalctl -u node_exporter -f --no-pagerTo create a static target, you need to add job_name with static_configs.
sudo vim /etc/prometheus/prometheus.yml- job_name: node_export
static_configs:
- targets: ["localhost:9100"]
you have to add like this.
By default, Node Exporter will be exposed on port 9100.
Before, restarting check if the config is valid.
promtool check config /etc/prometheus/prometheus.yml
Here, ‘success’ means everything is going well. Let’s go to the next step-
Then, you can use a POST request to reload the config.
curl -X POST http://localhost:9090/-/reloadCheck the targets section
http://<ur-ec2-public-ip>:9090/targets
then press enter

As you can see, earlier there was no Node Exporter here, but now Node Exporter is present (1/1). 🤩
Install Grafana on Ubuntu 22.04
To visualize metrics we can use Grafana. There are many different data sources that Grafana supports, one of them is Prometheus.
First, let’s make sure that all the dependencies are installed:
sudo apt-get install -y apt-transport-https software-properties-commonNext, add the GPG key:
wget -q -O - https://packages.grafana.com/gpg.key | sudo apt-key add -Add this repository for stable releases:
echo "deb https://packages.grafana.com/oss/deb stable main" | sudo tee -a /etc/apt/sources.list.d/grafana.listAfter you add the repository, update and install Garafana:
sudo apt-get updatesudo apt-get -y install grafanaTo automatically start the Grafana after reboot, enable the service.
sudo systemctl enable grafana-serverStart Grafana:
sudo systemctl start grafana-serverStatus of Grafana:
sudo systemctl status grafana-serverNow try to access it via browser with port:3000
<ur-ec2-public-ip:3000>
Grafana is loading

Now, write adminin the username column and also adminin the password column. Then, click on log inand proceed to set a new password.

and then press submit
and then go to the data source -

then choose prometheus -

then paste the prometheus ip address-

then scroll down and click on press & test -

now click on save & test

now according to the above screenshot you have to choose the import dashboard and then press on dashboards on the left side

now click on new and then import -

now type 1860 and then click on load
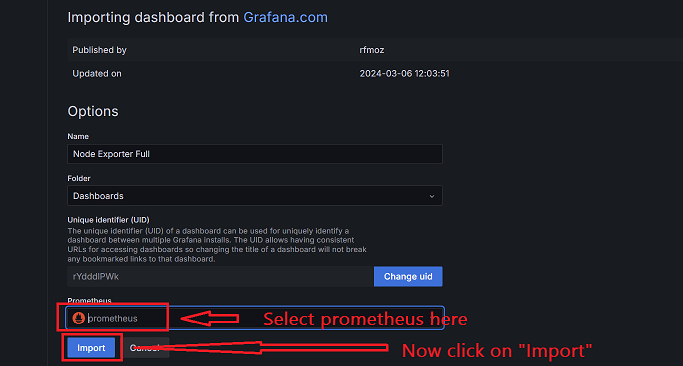
Choose prometheus and then click on Import
After that you will see this type of output-

Now Install the Prometheus Plugin in Jenkins and Integrate it with the Prometheus server-
Follow the following steps in the below-
Firstly we have to create the Prometheus metrics in Jenkins-
Goto Manage Jenkins –> Plugins –> Available Plugins
Search for Prometheus and install it

Press on Manage Jenkins because all the plugins will get here-

then click on Plugins

then install the Prometheus metrics and then restart the Jenkins -
go to that location in jenkins — `manage jenkins > System``

Nothing to change just click on apply and save
now create a static target, you need to add job_name with static_configs. go to Prometheus server-
sudo vim /etc/prometheus/prometheus.ymlPaste the below code-
- job_name: 'jenkins'
    metrics_path: '/prometheus'
    static_configs:
      - targets: ['<jenkins-ip>:8080']
Add like this and edit with your jenkins ip
Before, restarting check if the config is valid:
promtool check config /etc/prometheus/prometheus.yml
Here, ‘success’ means everything is going well. Let’s go to the next step-
Then, you can use a POST request to reload the config.
curl -X POST http://localhost:9090/-/reloadNow check the targets section
http://<ur-ec2-public-ip>:9090/targets
then press enter

Let’s add Dashboard for a better view in Grafana
Now we will add another thing in Grafana-
dashboard > import dashboard

This time we have to use another id is 9964 and then click on load
now select the data source that is Prometheusand click on Import

Choose Prometheus and then import
Now you will see the Detailed overview of Jenkins

Now you can see everything is showing the executor as 2, and when you run any job in Jenkins, you can see it in Grafana. During the job run, any failures will be visible on this dashboard. You can find everything you need here as we continue our work.
Now, Email Integration With Jenkins and Plugin Setup
Install Email Extension Plugin in Jenkins using this plugins we can integrate with Jenkins-
Download the Email Extension Templates

Install and then restart the safe jenkins
Now go to your Email and create a token where we use in credentials for mail-

Click on manage you google account > Security

remember that your 2-step-verification must be enabled

Now search appand then click on App `App passwords``-
After clicking on it they ask for your Laptop pin if didn’t then No Problem.

Then write name of your “App name” then click on create -

Copy that password and save it on your laptop because we are using the same password credentials in Jenkins, which is why our email is integrated successfully.
Once the plugin is installed in Jenkins, click on manage Jenkins –> configure system there under the E-mail Notification section configure the details as shown in the below image
Manage jenkins > Credentials
Now go to- manage jenkins > Credentials

Click on Credentials

Go to add credentials

and then click on create -
This is to just verify the mail configuration
Now under the Extended E-mail Notification section configure the details as shown in the below screenshots-
Now go to the → Manage Jenkins > System

Now go there and scroll down-


Then scroll down

and then click on Default Triggers

Now go to the E-mail Notification Section-


Click on Apply and Save
Now Install Plugins -
Eclipse Temurin InstallerSonarQube ScannerNodeJSOWASP Dependency-CheckDockerDocker commonsDocker PipelineDocker APIDocker-build-step

After click on Install Restart the jenkins
Now Configure Java And Node Js-
Go to → Manage Jenkins > Tools

Now Scroll Down-

Now apply and save
Now we are setting up OWASP Dependency-
Now goto → Manage Jenkins > Tools -

Now Apply and Save
Now we are configuring Sonarqube to Jenkins-
Goto your Sonarqube Dashboard

Now press on Administration > Security > Users

Click on this and then

Now click on Generate

Now copy that token and safely save this and then click on done
Now go to Jenkins dashboard
goto → Manage Jenkins > Credentials

Now do according to the above screenshot and then click on Create
now Goto → Manage Jenkins > System

Now click on Apply and Save
now, Goto → Manage Jenkins > Tools

now do like above screenshots and then click on Apply and Save
Now add Webhook in Sonarqube Server so go the Sonar server-

now, click on Administration > Configuration > Webhooks

Now click on Create

now click on create
now we are adding the credentials of Docker-
Goto → Manage Jenkins > Credentials

then click on Create
Now goto Manage Jenkins > Tools
and scroll down

and then click on apply and save
Now let’s come on Jenkins Dashboard-

Create a job

Type name and choose pipeline and then click on ok

and then scroll down, write script for pipeline-
That’s my whole pipeline script here i will also give you the script below and also in my github repository.
pipeline{
    agent any
    tools{
        jdk 'jdk17'
        nodejs 'node16'
    }
    environment {
        SCANNER_HOME=tool 'sonar-scanner'
    }
    stages {
        stage('clean workspace'){
            steps{
                cleanWs()
            }
        }
        stage('Checkout from Git'){
            steps{
<<<<<<< HEAD
                git branch: 'main', url: 'https://github.com/sachin2815/DevSecOps-CICD-Pipeline-NetflixClone.git'
=======
                git branch: 'main', url: 'https://github.com/sachin2815/Netflix-clone-DevSecOps.git'
>>>>>>> 26f4be5e7f7b660bddd872e2b4fed1623e31f3b3
            }
        }
        stage("Sonarqube Analysis "){
            steps{
                withSonarQubeEnv('sonar-server') {
                    sh ''' $SCANNER_HOME/bin/sonar-scanner -Dsonar.projectName=Netflix \
                    -Dsonar.projectKey=Netflix '''
                }
            }
        }
        stage("quality gate"){
           steps {
                script {
                    waitForQualityGate abortPipeline: false, credentialsId: 'Sonar-token'
                }
            }
        }
        stage('Install Dependencies') {
            steps {
                sh "npm install"
            }
        }
        stage('OWASP FS SCAN') {
            steps {
                dependencyCheck additionalArguments: '--scan ./ --disableYarnAudit --disableNodeAudit', odcInstallation: 'DP-Check'
                dependencyCheckPublisher pattern: '**/dependency-check-report.xml'
            }
        }
        stage('TRIVY FS SCAN') {
            steps {
                sh "trivy fs . > trivyfs.txt"
            }
        }
        stage("Docker Build & Push"){
            steps{
                script{
                   withDockerRegistry(credentialsId: 'docker', toolName: 'docker'){
                       sh "docker build --build-arg TMDB_V3_API_KEY=ca86fe14eca3e76864bc17f59d319b92 -t netflix ."
                       sh "docker tag netflix sachin2815/netflix:latest "
                       sh "docker push sachin2815/netflix:latest "
                    }
                }
            }
        }
        stage("TRIVY"){
            steps{
                sh "trivy image sachin28/netflix:latest > trivyimage.txt"
            }
        }
        stage('Deploy to container'){
            steps{
<<<<<<< HEAD
                sh 'docker run -d --name netflix -p 8081:80 sachin28/netflix:latest'
=======
                 sh 'docker run -d --name netflix -p 8081:80 sachin2815/netflix:latest'
>>>>>>> 26f4be5e7f7b660bddd872e2b4fed1623e31f3b3
            }
        }
    }
    post {
     always {
        emailext attachLog: true,
            subject: "'${currentBuild.result}'",
            body: "Project: ${env.JOB_NAME}<br/>" +
                "Build Number: ${env.BUILD_NUMBER}<br/>" +
                "URL: ${env.BUILD_URL}<br/>",
            to: 'sachin.singh.professional@gmail.com',
            attachmentsPattern: 'trivyfs.txt,trivyimage.txt'
        }
    }
}
and then click on apply and then save.

Then press on build now- and after clicking on build you have to see here a stage view of Pipeline-

It will take 30 minutes to complete this. After successfully completing the build process, you will need to search for your Netflix EC2 IP with port 8081.
<ur-netflix-ec2-public-ip:8081>
According to your correct TMDB here you will find the final output.
Feel free to reach out if you run into any challenges during the project — I’m always available on LinkedIn, Discord, or via email. Don’t forget to check out my GitHub, where I post fresh DevOps content daily! 😊
Also, here’s the YouTube video I recommend for you to explore — 👇
[embed]
If this Article was helpful, please do follow and click the clap 👏 button below to show your support 😄
_Thank you for reading 🤍
메타데이터
- post_id
- 2f3ee4f758fe
- slug
- deploying-a-netflix-clone-ci-cd-pipeline-with-jenkins-docker-kubernetes-monitoring-2f3ee4f758fe
- url
- https://medium.com/@sachin28/deploying-a-netflix-clone-ci-cd-pipeline-with-jenkins-docker-kubernetes-monitoring-2f3ee4f758fe
- canonical_url
- https://medium.com/@sachin28/deploying-a-netflix-clone-ci-cd-pipeline-with-jenkins-docker-kubernetes-monitoring-2f3ee4f758fe
- author_url
- https://medium.com/@sachin28
- status
- ok
- fetched_at
- 2026-07-22 18:19:10




