The N=1 Lab (Personal Health Sensing) Ch1: I pushed as hard as I could. My heart said no.
What 81 workouts taught me about the invisible wall between “trying hard” and “going fast.”
The N=1 Lab (Personal Health Sensing) Ch1: I pushed as hard as I could. My heart said no.
What 81 workouts taught me about the invisible wall between “trying hard” and “going fast.”
There’s a moment on the elliptical I’ve come to dread.
I’m sweating. Legs are burning. I’m pushing as hard as I did two days ago. But my heart rate is stuck at 138 and won’t budge. Two days ago, same machine, same effort, I hit 175 no problem. Today? 138. Flatlined. Like my heart put up a “closed for business” sign.
This kept happening. Good days and bad days, with no obvious reason why. So I did what any obsessive PhD student would do. I pulled six months of data and went looking for answers.
(For context: I study hearts for a living. Pediatric cardiology, wearables, the whole deal. So when my own heart starts acting weird, it becomes a research project whether I want it or not.)
First, the obvious question
Maybe the “bad” days were just lazy days? Maybe I wasn’t actually trying that hard?
Nope.
I tracked 81 elliptical sessions on my Apple Watch, with Bevel and Bevel Intelligence crunching recovery and strain scores from the data Apple Health collects. When I sorted sessions by calories burned, something jumped out.
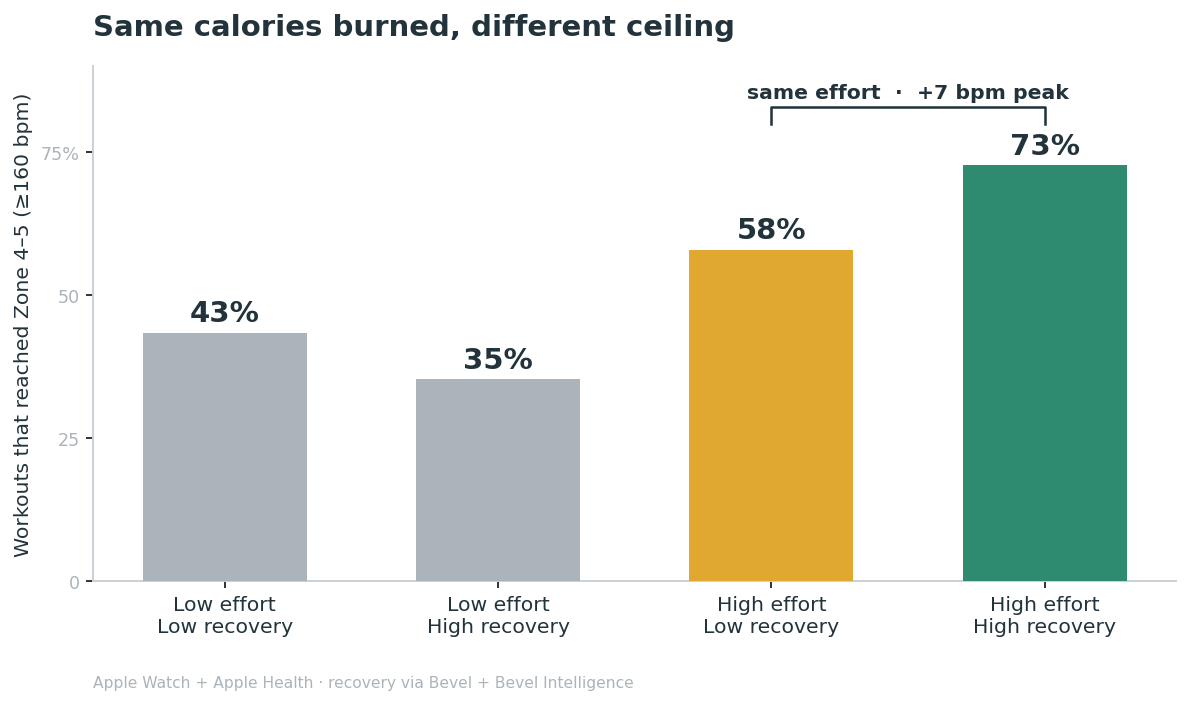
Look at the two green-and-gold bars on the right. Those workouts burned almost identical calories, about 1,420 vs 1,430. Same work. But on well-recovered days, I hit Zone 4–5 heart rates (above 160 bpm) about 73% of the time. On poorly recovered days? Only 58%. My peak heart rate was 7 beats lower.
Same gas pedal. Different speed limit.
So if effort wasn’t the problem… what was?
Your heart has a brake pedal (and most people don’t know about it)
OK, one minute of biology. I promise this will click.
Your heart doesn’t just have a gas pedal. It has a brake too. Two nerves control your heart rate, and they fight each other all day long.
The vagus nerve is the brake. It’s the reason your resting heart rate is 60 instead of 100. It literally slows your heart down. It’s part of your “rest and digest” system, the parasympathetic nervous system.
The sympathetic nerves are the gas. They dump adrenaline on your heart and speed it up. This is your “fight or flight” system.
When you exercise, here’s what happens in order:
- First, the brake comes off (gets you to ~100 bpm)
- Then the gas kicks in (pushes you past 100)
- Around 140 bpm, brake and gas are about equal
- Above 160, it’s all gas, pure sympathetic drive

See those two curves? The green one is what happens when both systems are working well. The red one is what happens when they’re not. The tired body hits a ceiling way before the rested one.
That red curve? That was me on my bad days. I could feel it.
The answer was hiding in my sleep
Here’s where it gets wild.
The thing that predicted whether I’d have a “good heart rate day” or a “bad heart rate day” wasn’t anything about the workout. It was measured hours earlier. While I was asleep.
Two numbers told the story:
Heart rate variability (HRV): the tiny wobble between heartbeats. More wobble = stronger brake = a heart that’s flexible and ready to go. Bevel measures this during sleep using a method called RMSSD, which specifically picks up vagal (brake) activity.
Resting heart rate: lower is better. It means the brake is winning at rest, which is exactly what you want.

When my overnight HRV was high (around 70 ms) and my resting heart rate was low (around 60 bpm), my heart could hit 159+ on the elliptical. When my HRV was low (around 51) and resting rate was high (around 68), my average peak dropped to 149. Eleven beats, decided before I even woke up.
This is exactly what Bevel’s Recovery Score captures. It takes your sleep quality, your overnight HRV, and your resting heart rate, compares them to your own 60-day baseline, and gives you a single number. Green means your brake is strong and your gas tank is full. Red means neither is ready.
I used to think of that score as a suggestion. Now I think of it as a forecast.
The scatter plot that changed how I train
This one’s my favorite.

Every dot is one workout. Bigger dots = harder effort. Green dots hit Zone 4–5. Grey dots didn’t.
See the bottom left? Big dots, hard effort, but grey. They couldn’t break through. Those are my worst-recovery days. On two of them I pushed real effort and my heart peaked at 125 and 108. It would. not. climb.
Now look at the top right. Big green dots everywhere. High recovery, high peak. The ceiling was gone.
The “fatigue fingerprint” (this blew my mind)
Sports scientists have a name for what I was seeing. It’s the classic sign of overreaching, pushing harder than your body has recovered for, and it has a weirdly specific pattern:
Your heart rate is too HIGH when you want it low (elevated resting rate). Your heart rate is too LOW when you want it high (suppressed peak).
You can’t get it up when you need it. It sits too high when you don’t.
Look at the difference. On green-recovery days, my heart had a working range of 99 beats, from a resting 60 all the way up to 159. On red days? That range collapsed to 81 beats. The floor rose and the ceiling dropped. The whole instrument compressed.
In cardiology we have a term for a heart that can’t raise its rate to meet demand: chronotropic incompetence. What I was seeing was a mild, temporary, self-inflicted version of the same thing. Not disease. Just fatigue. And the exact same numbers that flag it in a clinic (resting HR and HRV) were flagging it on my wrist every morning.
What I actually do differently now
Here’s the practical bit.

When I wake up to a red recovery score, I don’t chase intensity anymore. I used to think “push through it.” Now I know there’s a ceiling up there that effort alone can’t break. The wall is real, and my body decided it was there before my alarm went off.
On green mornings? That’s when I go after Zone 5. The brake is off, the gas tank is full, and my heart has the full range to work with.
One sentence version: effort aims the arrow. Recovery sets the ceiling.
The part I keep coming back to: a number measured from nothing but the spacing of my heartbeats, while I was unconscious, quietly forecasts what my heart can do twelve hours later. We all carry that readout every night. I just finally started reading mine.
How I analyzed this: n = 1 (me), 81 logged elliptical sessions. I compared matched-effort workouts across recovery states and fit a regression to isolate recovery’s effect on peak heart rate. Observational — associations and mechanisms, not proof of cause. My own body, so treat the exact numbers as illustrative.
The N=1 Lab — Personal Health Sensing
- Ch1: I pushed as hard as I could. My heart said no. (you’re here)
- Ch2: My watch knew I was sick two days before I did
Ch2 is live: the one overnight number that predicted my recovery better than HRV — and flagged that I was getting sick before I felt it.
Prefer your inbox? Each chapter also goes out on Substack: The N=1 Lab on Substack →
Tracked on Apple Watch, stored in Apple Health, with recovery, strain, and trend intelligence from Bevel and Bevel Intelligence.
Sources: White & Raven, autonomic control of HR during exercise (J Physiol, 2014); APS review on the cardiac vagus (Physiology, 2018); Kreher & Schwartz on overtraining syndrome (2012).
메타데이터
- post_id
- 2f4c58eacad2
- slug
- personal-health-sensing-ch1-i-pushed-as-hard-as-i-could-my-heart-said-no-2f4c58eacad2
- url
- https://medium.com/@kathanvyas/personal-health-sensing-ch1-i-pushed-as-hard-as-i-could-my-heart-said-no-2f4c58eacad2
- canonical_url
- https://medium.com/@kathanvyas/personal-health-sensing-ch1-i-pushed-as-hard-as-i-could-my-heart-said-no-2f4c58eacad2
- author_url
- https://medium.com/@kathanvyas
- status
- ok
- fetched_at
- 2026-08-11 02:11:41