Cloud Monitoring-Part 1
Amazon CloudWatch and CloudWatch logs
Cloud Monitoring-Part 1
Amazon CloudWatch and CloudWatch logs
Hello everyone, today I came up with a new topic called Amazon CloudWatch. Before getting into this topic first let us discuss in which situation this Amazon CloudWatch will help us.
Let’s take an example you have deployed an application on cloud and you have set of questions like
- How does your website’s traffic look like?
- How is the performance of your application on the cloud?
- How to do some immediate action if something happens in your application?
- Are customers satisfied with the current features of your application or do you have to make any improvements?
But you don’t have answers to any of the above questions since you are not using any kind of monitoring platform. So you have no idea if your application needs any improvement or not.
To answer all of these questions Amazon provides a versatile monitoring tool called Amazon CloudWatch that enables robust monitoring of AWS infrastructure for us. Now let us explore CloudWatch in detail.
Amazon Cloudwatch
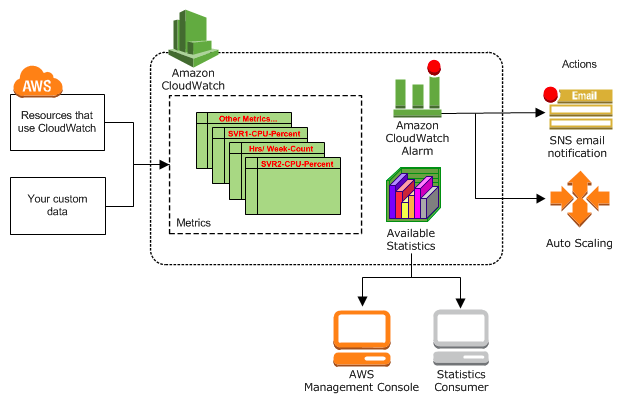
Amazon CloudWatch is a monitoring and management service that provides data and actionable insights for AWS, hybrid, and on-premises applications and infrastructure resources. With CloudWatch, you can collect and access all your performance and operational data in form of logs and metrics from a single platform.
Amazon CloudWatch allows developers, system architects, and administrators to monitor their AWS applications in the cloud, in near-real-time. CloudWatch is automatically configured to provide metrics on request counts, latency, and CPU usage. Users also can send their own logs and custom metrics to CloudWatch for monitoring.
The data and reports CloudWatch provides lets users keep track of application performance, resource use, operational issues, and constraints. This helps organizations resolve technical issues and operations.
CloudWatch is most commonly used with Elastic Compute Cloud (EC2) instances, and can also monitor Amazon Elastic Block Store (EBS) volumes, Elastic Load Balancers (ELBs), and instances of Amazon Relational Database Service (RDS). It also can extend beyond these core services to intake custom data from external sources.
Source: Google images
Metrics
Metrics represents a time-ordered set of data points that are published to CloudWatch. An example is the CPU utilization of an EC2 instance. You can relate metric to a variable that is being monitored and data points to the value of that variable over time. Metrics are uniquely defined by a name, a namespace, and zero or more dimensions. Each data point has a time-stamp.
Statistics
Statistics are metric data aggregations over specified periods of time. Aggregations are made using the namespace, metric name, dimensions within the time period you specify. Few available statistics are maximum, minimum, sum, average, and sample count.
Dimensions
A dimension is a name/value pair that uniquely identifies a metric. Dimensions can be considered as categories of characteristics that describe a metric. Because dimensions are unique identifiers for a metric, whenever you add a unique name/value pair to one of your metrics, you are creating a new variation of that metric.
Alarm
An alarm can be used to automatically initiate actions. It watches a single metric over a specified time period and performs one or more specified actions. The action is simply like a notification that is sent to Amazon SNS topic.
Alarms have three states:
- INSUFFICIENT: Not enough data to judge the state? alarms often start in this state.
- ALARM: The alarm threshold has been breached (e.g., > 90% CPU).
- OK: The threshold has not been breached.
Alarms have a number of key components:
- Metric: The data points over time being measured.
- Threshold: Exceeding this is bad (static or anomaly)
- Period: How long the threshold should be bad before an alarm is generated
- Action: What to do when an alarm triggers(SNS, Auto Scaling, EC2)
Benefits of Amazon CloudWatch
- Amazon CloudWatch allows you to access all your data from a single platform.
- It provides real-time insights so that you can optimize operational costs and AWS resources.
- Provides complete visibility across your applications, infrastructure stack, and AWS services.
Use cases of Amazon CloudWatch
- Infrastructure monitoring and troubleshooting.
- Mean-time-to-resolution improvement.
- Proactive resource optimization.
- Application monitoring.
- Log analytics.
CloudWatch is responsible for gathering data points and metrics from both AWS services and as well as custom sources. But CloudWatch logs is a specific subset of CloudWatch that's designed to collect and store log data.
CloudWatch Logs
CloudWatch Logs provides functionality to store, monitor, and access logs from EC2, on-premises servers, Lambda, CloudTrail, Route 53, VPC Flow Logs, custom applications, and much more. Metric filters can be used to analyze logs and create metrics (e.g., failed SSH logins).
CloudWatch logs are a subset of CloudWatch these can be used to collect and store the log data. This centralizes the data from all the AWS resources, our custom data altogether. When everything is in one place we can easily find out the specific error codes and extract some of the featured data based on the specific fields. This enabled us to access all our logs regardless fo their sources. We can query them and sort them based on their dimensions and group by specific fields.
Rather than storing data points and metrics, CloudWatch logs is designed to store log events.
1. Log Event
A log event is a timestamp so a year, month, hour, minute, second, and that together with the raw message.
2. Log Stream
Log events groups into a log stream so a log stream is a sequence of log events with the same source. Each separate source of logs in CloudWatch Logs makes up a separate log stream.
3. Log Group
A log group is a container for log streams. It controls retention, monitoring, and access control. You can define log groups and specify which streams to put into each group. There is no limit on the number of log streams that can belong to one log group.
I hope this article helped you to understand better about Amazon CloudWatch and CloudWatch logs. If you want to know more about any other AWS services for your applications, we as developers at Vitwit are here to help you. If you need an AWS Solutions Architect, don’t hesitate to contact Vitwit.
메타데이터
- post_id
- 2fb77e6ed6b8
- slug
- cloud-monitoring-part-1-2fb77e6ed6b8
- url
- https://medium.com/@venkatesh.gopireddy1/cloud-monitoring-part-1-2fb77e6ed6b8
- canonical_url
- https://medium.com/@venkatesh.gopireddy1/cloud-monitoring-part-1-2fb77e6ed6b8
- author_url
- https://medium.com/@venkatesh.gopireddy1
- status
- ok
- fetched_at
- 2026-06-24 18:57:25