Python data journey — Day2
Today we’ll start our data science journey by diving into a project called Fake News detector, which will detect and print the number of…
Python data journey — Day2
Today we’ll start our data science journey by diving into a project called Fake News detector, which will detect and print the number of fake news from a CSV data file. The training dataset file is obtained from kaggle:https://www.kaggle.com/c/fake-news/data
It is an unique way to analyze a datasets consisting of multiple entries of real and fake news identified by a label where 1 is real and 0 is fake.
This project will use the id, title, author, name, text and label from the dataset.
Modules used:
TfIdfvectorizer is a sklearn library which can convert text data into numbers and in the same time provide a numerical representation of how important a number is for statistical analysis. So why do we need to do that?
The logic and use of this module is to convert words into computer readable number and in the same time retain the linguistic essence of the information for analysis. e.g. There can be similar words or phrases which may be different but essentially mean the same — like : “the project is going haywire” and “the project is out of control” both has the similar meaning, but has different wordings. So, we’ll use techniques which will make computers understand text-data.
Formula for tf-idf
TfIdfvectorizer:
TF or term frequency is the number is the count of a word in a sentence.
DF or document frequency means how many documents does the word appears in the collection. The formula is called inverse document frequency as the term is present in the denominator.
Sklearn uses a different formula to calculate:idf = ln[(1+N)/(1+df)]+1
Logic behind this is to sort words on the basis of abundance in a set . The Logarithmic factor in tfidf mathematically penalizes the words that are too abundant or too rare in the corpus by giving them low tfidf scores (outliers).
Below are the formula:
tf(w) = doc.count(w) / total words in the doc
idf(w) = log(total_number_of_documents / number_of-documents_containing_word_w)
Next, Tf-Idf is then computed by taking a product of Tf and Idf. More important words would get a higher tf-idf score.
tf-idf(w) = tf(w) * idf(w)
PassiveAggressiveClassifier:
Passive-Aggressive algorithm is a part of the scikit-learn library and it uses two logic to make decisions :-
passive: If any prediction is correct, don’t change the model. i.e., the train data is not enough to cause any changes in the model.
aggressive: If the prediction is incorrect, make changes to the model. i.e., some change to the model may correct it.
This kind of module is useful for working with big-data
Let’s start coding…Open a new Jupyter notebook,
Import essential modules:
pip install numpy pandas sklearn
import numpy as np
import pandas as pd
import itertools
from sklearn.model_selection import train_test_split
from sklearn.feature_extraction.text import TfidfVectorizer
from sklearn.linear_model import PassiveAggressiveClassifier
from sklearn.metrics import accuracy_score, confusion_matrix
Reading the data CSV:
Access the CSV from my google drive
url=’https://drive.google.com/file/d/1sUsPWP6_NK17P01eyxMqbu07yGabUxnr/view?usp=sharing'
url=’https://drive.google.com/uc?id=' + url.split(‘/’)[-2]
df = pd.read_csv(url)
Get shape and head
df.shape
df.head()
Get the labels
labels=df.label
labels.head()
Shape gives us the shape of the dataframe (i.e. how does the data in the CSV looks like and head gives the first few data entries)
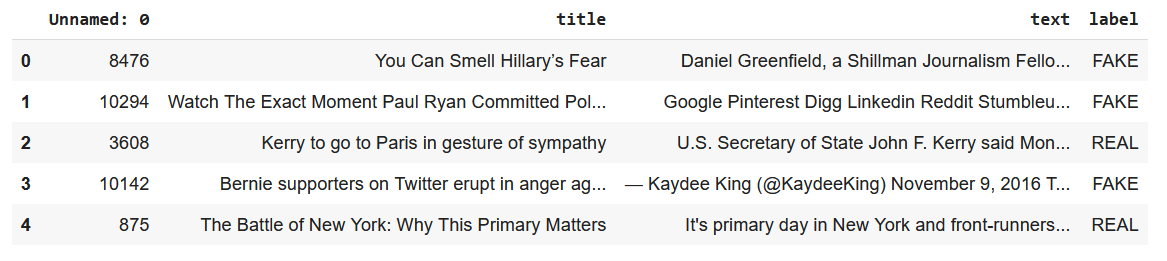
Now we can silt the data set:
x_train,x_test,y_train,y_test=train_test_split(df[‘text’], labels, test_size=0.2, random_state=7)
Sklearn’s sklearn.model_selection.train_test_split is a way to select a part of the data and split them. Here we’re splitting where the text colum occurs so that we can get the label.
Initialize the TfIdfvectorizer:
tfidf_vectorizer=TfidfVectorizer(stop_words=’english’, max_df=0.7)
Fit and transform train set, transform test set
tfidf_train=tfidf_vectorizer.fit_transform(x_train) tfidf_test=tfidf_vectorizer.transform(x_test)
Initialize a PassiveAggressiveClassifier
pac=PassiveAggressiveClassifier(max_iter=50) pac.fit(tfidf_train,y_train)
Predict on the test set and calculate accuracy
y_pred=pac.predict(tfidf_test) score=accuracy_score(y_test,y_pred) print(f’Accuracy: {round(score*100,2)}%’)
This will output a test accuracy
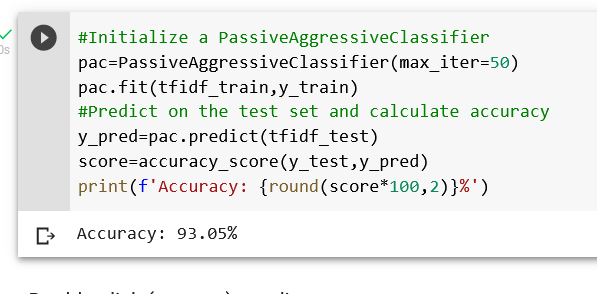
Next a confusion matrix can be used to test the performance of the algorithm:
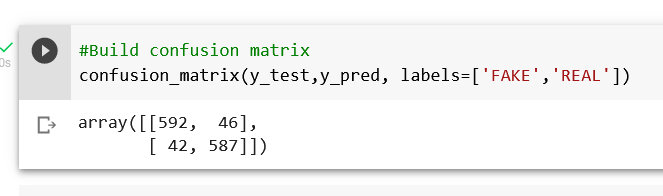
So with this model, we have 582 true positives, 587 true negatives, 42 false positives, and 46 false negatives.
We achieved an accuracy of 93.05% in training and testing the data-set.
Thanks for reading!!
메타데이터
- post_id
- 2ffd3c98781
- slug
- python-data-journey-day2-2ffd3c98781
- url
- https://medium.com/utconline-app/python-data-journey-day2-2ffd3c98781
- canonical_url
- https://medium.com/utconline-app/python-data-journey-day2-2ffd3c98781
- author_url
- https://medium.com/@udayshankarbhowal
- status
- ok
- fetched_at
- 2026-06-12 18:14:10