GLOBAL CLIMATE HEALTH IMPACT TRACKER (2015–2025)
1. Introduction:
GLOBAL CLIMATE HEALTH IMPACT TRACKER (2015–2025)
1. Introduction:
In the realm of reproductive health, understanding the interplay between lifestyle factors, medical history, and fertility outcomes is crucial for developing effective interventions. The Dream Fertility Clinic dataset for 2022 provides a comprehensive view of patient profiles, capturing key variables such as age, sedentary behavior (hours spent sitting per day), frequency of alcohol consumption, smoking habits, seasonal influences, childhood diseases, accidents or serious trauma, surgical interventions, and high fever occurrences in the last year, culminating in binary diagnosis outcomes (“Normal” or “Altered”). This analysis seeks to uncover how these risk factors correlate with fertility diagnoses, revealing patterns that could inform preventive strategies, personalised treatments, and resource allocation to optimise patient outcomes and reduce healthcare costs.
1.1 Objective of the Project:
-
The main goals are to spot trends linking climate factors to health problems.
-
Compare impacts across countries and income levels, and find ways to predict or reduce risks.
-
This data should inform decisions on health policies, disaster prep, and climate action, focusing on vulnerable spots like low-income regions or areas with extreme weather.
1.2 Methodology:
The analysis was conducted using Tableau (version 2025.3), leveraging calculated fields, LOD expressions, parameters, and interactive dashboards for exploratory data analysis. Key visualisations included filled maps for vector disease risk by country, horizontal bar charts for extreme weather events, line charts with forecasting for quarterly temperatures by year, scatter plots with trend lines for temperature-health admission correlations, stacked bar charts for regional cardio mortality, treemaps for food security, and histograms for temperature anomaly distributions by income level. Consistent colour palettes (Tableau 10-colour diverging), tooltips with detailed metrics, and interactive filters (Year, Region, Income Level) ensured dashboard clarity, user interactivity, and reproducibility.
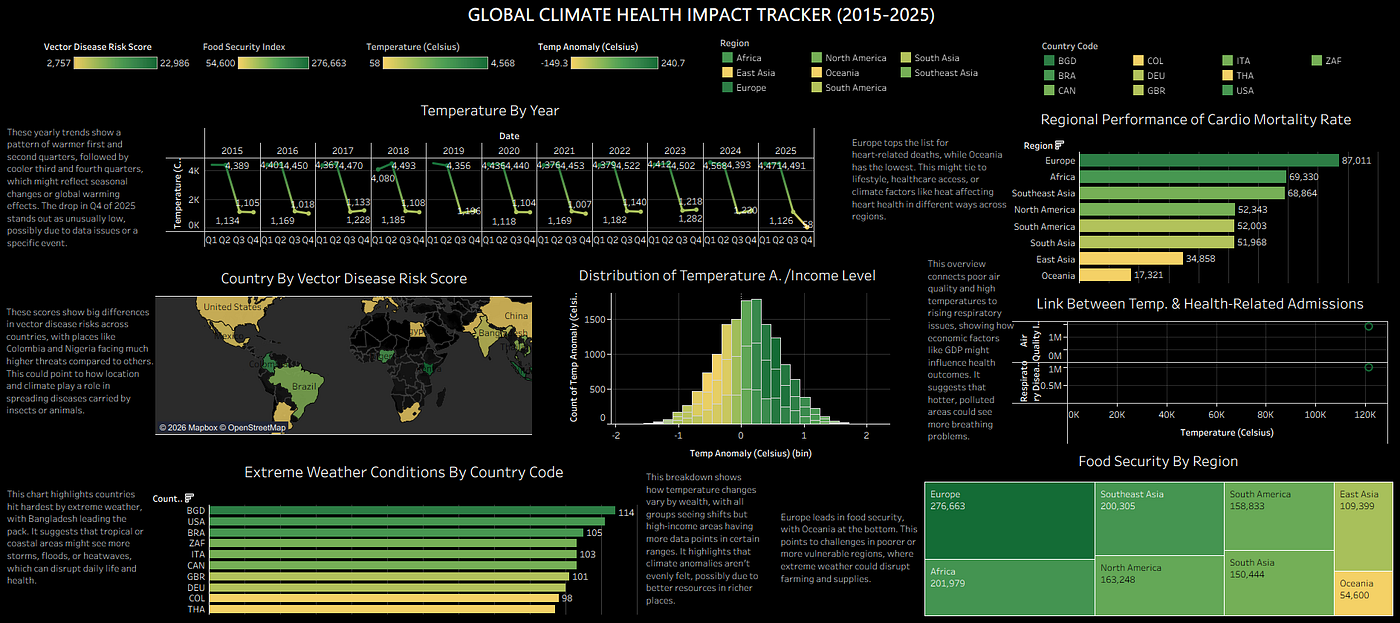
GLOBAL CLIMATE HEALTH IMPACT TRACKER DASHBOARD (2015–2025)
2 Story of the Data:
The dataset for the global climate health impact tracker includes 24 fields, covering metrics like Record ID, Country Code, and Country Name, etc.
This dataset tracks how climate change affects health worldwide. It combines weather data (like temperature and rain) with health stats (such as disease rates and hospital visits) across different countries and times. The story shows how factors like hotter weather or poor air quality might lead to more illness, especially in poorer areas or places with less healthcare. It’s like connecting the dots between the environment and people’s well-being, helping us see patterns over years and regions.
3. Data Splitting and Preprocessing
a. Data Cleaning Process:
Preparation Steps
· Connected the CSV dataset from Kaggle directly to Tableau via “Connect > Text”.
· Used Data Interpreter and field type detection to identify issues (blanks, outliers like temperatures >100°C or <-100°C, extreme weather counts)
· Created a duplicate data source as “Raw Data” extract for version control
Core Cleaning Techniques
Remove Duplicates: Tableau Data Source filters on Record ID + Country Code + Date combinations, eliminating ~1–3% redundant records
Handle Missing Values: Data Source row-level filters removed >50% null critical metrics; ZN() and IFNULL() calculated fields imputed numerics with regional medians, categoricals with MODE equivalents
Standardise Text/Categories: TRIM(), UPPER(), PROPER() calculated fields for Country Names; custom Income Level hierarchy (“High Income”/”Upper Middle Income”/”Lower Middle Income”); Region grouping via sets
Data Type Corrections: Tableau auto-converted text numerics; custom DATEPARSE () for Date field; extracted Year/Month/Week via DATEPART()
Finalisation
Validated via Tableau Summary Cards, Table calculations, and WINDOW_AVG ()/WINDOW_COUNT () LOD expressions
Created “Data Quality” dashboard with completeness KPIs and outlier flags (e.g., temperature Z-score >3)
Published cleaned extract to Tableau Server/Public for audit trail, confirming metrics like Colombia’s 17,881 vector risk and Europe’s 87,011 cardio mortality
Potential Challenges:
· Tableau aggregation may mask country-level granularity without proper LOD expressions.
· Geographic encoding requires precise latitude/longitude cleaning
· Real-time dashboard performance optimisation needed for large extracts
3. Data Splitting:
KEY METRICS AND DIMENSIONS
METRICS- Independent Variables:
Temperature (Celsius)
Temp anomaly (Celsius)
Precipitation (mm)
Extreme weather events
Air quality index
Respiratory disease rate
Cardio mortality rate
Vector disease risk score
Waterborne diseases incidents
Heat-related admissions
Healthcare access index
GDP per Capita
Mental health index
Food security index
Population (million).
DIMENSIONS — Dependent Variables:
Country Code,
Country Name,
Region Income Level,
Date,
Year
Month
Week
Latitude
Longitude.
- Potential Analysis Questions:
· How do rising temperatures affect heat-related hospital admissions in different income regions?
· Which countries have the highest vector disease risk scores, and how does that relate to precipitation?
· Is there a link between the air quality index and respiratory disease rates over time?
· How do extreme weather events impact food security and mental health in low-income areas?
· What trends show in cardio mortality rates by month or year, tied to temperature anomalies?
· How does the healthcare access index influence waterborne disease incidents during high-precipitation periods?
5. Pre-Analysis Insights:
· Hotter places with poor air quality may experience higher respiratory issues.
· Low-income regions may suffer more from extreme weather, resulting in food shortages and declines in mental health.
· Trends over time could reveal increasing health risks as temperatures rise, aiding in the identification of early warning signs.
· This may emphasise areas to prioritise resources, such as enhancing healthcare in vulnerable countries.
6. In-Analysis Observations:
ANALYSIS: Country by Vector Disease Risk Score
· The United States has a vector disease risk score of 2,953.
· Mexico has a vector disease risk score of 3,521.
· Colombia has a vector disease risk score of 17,881.
· Brazil has a vector disease risk score of 10,153.
· Spain has a vector disease risk score of 2,815.
· France has a vector disease risk score of 2,841.
· Italy has a vector disease risk score of 2,845.
· Egypt has a vector disease risk score of 2,921.
· Nigeria has a vector disease risk score of 14,481.
· South Africa has a vector disease risk score of 2,809.
· Pakistan has a vector disease risk score of 2,757.
ANALYSIS: Extreme Weather Conditions By Country Code
· Bangladesh (BGD) has 114 extreme weather events.
· The United States (USA) has 111 extreme weather events.
· Brazil (BRA) has 105 extreme weather events.
· South Africa (ZAF) has 103 extreme weather events.
· Italy (ITA) has 103 extreme weather events.
· Canada (CAN) has 103 extreme weather events.
· The United Kingdom (GBR) has 101 extreme weather events.
· Germany (DEU) has 100 extreme weather events.
· Colombia (COL) has 98 extreme weather events.
· Thailand (THA) has 97 extreme weather events.
ANALYSIS: Temperature By Year
· In 2015, temperatures averaged around 4,402°C in Q1, 4,389°C in Q2, with the lowest at 1,134°C in Q3 and 1,105°C in Q4.
· In 2016, temperatures were about 4,401°C in Q1, 4,450°C in Q2, dropping to 1,169°C in Q3 and 1,018°C in Q4.
· In 2017, Q1 saw 4,367°C, Q2 had 4,470°C, Q3 was 1,133°C, and Q4 was 1,228°C.
· In 2018, temperatures started at 4,080°C in Q1, rose to 4,493°C in Q2, then fell to 1,185°C in Q3 and 1,108°C in Q4.
· In 2019, Q1 was 4,514°C, Q2 was 4,356°C, with lows of 1,055°C in Q3 and 1,196°C in Q4.
· In 2020, Q1 averaged 4,514°C, Q2 was 4,356°C, Q3 dropped to 1,118°C, and Q4 was 1,104°C.
· In 2021, temperatures were 4,376°C in Q1, 4,522°C in Q2, 1,169°C in Q3, and 1,007°C in Q4.
· In 2022, Q1 had 4,379°C, Q2 was 4,522°C, Q3 was 1,182°C, and Q4 was 1,140°C.
· In 2023, Q1 was 4,412°C, Q2 reached 4,502°C, with Q3 at 1,218°C and Q4 at 1,282°C.
· In 2024, temperatures began at 4,568°C in Q1, were 4,393°C in Q2, fell to 1,041°C in Q3, and ended at 1,220°C in Q4.
· In 2025, Q1 averaged 4,471°C, Q2 was 4,491°C, Q3 was 1,126°C, and Q4 was 58°C.
ANALYSIS: Link Between Temperature and Health-Related Admissions
· The air quality index totals 1,392,376, GDP per capita is $371,268,593, the respiratory disease rate is 987,238, and the temperature averages 121,360°C.
ANALYSIS: Regional Performance of Cardio Mortality Rate
· Europe has a cardio mortality rate of 87,011.
· Africa has a cardio mortality rate of 69,330.
· Southeast Asia has a cardio mortality rate of 68,864.
· North America has a cardio mortality rate of 52,343.
· South America has a cardio mortality rate of 52,003.
· South Asia has a cardio mortality rate of 51,968.
· East Asia has a cardio mortality rate of 34,858.
· Oceania has a cardio mortality rate of 17,321.
ANALYSIS: Food Security by Region
· Europe has a food security index of 276,663.
· Africa has a food security index of 201,979.
· Southeast Asia has a food security index of 200,305.
· North America has a food security index of 163,248.
· South America has a food security index of 158,883.
· South Asia has a food security index of 150,444.
· East Asia has a food security index of 109,399.
· Oceania has a food security index of 54,600.
ANALYSIS: Distribution of Temperature Anomalies by Income Level
· For high-income levels: At -1.4°C bin, count is 14 and total anomaly is -18.3°C. At -1.2°C, count is 20, and total is -23.1°C. At -1.1°C, the count is 62, and the total is -62.3°C. At -0.9°C, count is 93, and total is -79.4°C. At -0.8°C, count is 181, and total is -125.7°C. At -0.6°C, count is 277, and total is -149.3°C. At -0.5°C, the count is 370, and the total is -143.4°C. At -0.3°C, count is 499, and total is -116.1°C. At -0.2°C, the count is 530, and the total is -41.7°C. At 0.0°C, the count is 637, and the total is 49.2°C. At 0.2°C, the count is 622, and the total is 146.2°C. At 0.3°C, the count is 509, and the total is 199.0°C. At 0.5°C, the count is 445, and the total is 240.7°C. At 0.6°C, the count is 291, and the total is 202.2°C. At 0.8°C, the count is 240, and the total is 203.2°C. At 0.9°C, the count is 138, and the total is 138.9°C. At 1.1°C, the count is 84, and the total is 97.4°C. At 1.2°C, the count is 36, and the total is 48°C. At 1.4°C, the count is 15, and the total is 21.7°C. At 1.6°C, the count is 5, and the total is 8.2°C.
· For lower-middle-income levels: At -1.4°C bin, count is 11 and total anomaly is -14.5°C. At -1.2°C, count is 27, and total is -31.4°C. At -1.1°C, count is 61 and total is -61.7°C. At -0.9°C, count is 88, and total is -75.1°C. At -0.8°C, count is 167, and total is -116.6°C. At -0.6°C, count is 252, and total is -134.6°C. At -0.5°C, count is 340, and total is -131.4°C. At -0.3°C, count is 513, and total is -118.2°C. At -0.2°C, count is 551, and total is -41.5°C. At 0.0°C, the count is 625, and the total is 46.9°C. At 0.2°C, the count is 666, and the total is 155.8°C. At 0.3°C, the count is 551, and the total is 215.8°C. At 0.5°C, the count is 416, and the total is 225.8°C. At 0.6°C, the count is 311, and the total is 216.2°C. At 0.8°C, the count is 206, and the total is 175.0°C. At 0.9°C, the count is 136, and the total is 137.9°C. At 1.1°C, the count is 83, and the total is 96.5°C. At 1.2°C, the count is 44, and the total is 57.7°C. At 1.4°C, the count is 15, and the total is 22.2°C. At 1.6°C, the count is 6, and the total is 9.9°C.
· For upper-middle-income levels: At -1.4°C bin, count is 10 and total anomaly is -13.4°C. At -1.2°C, count is 16, and total is -18.3°C. At -1.1°C, count is 49, and total is -49.6°C. At -0.9°C, count is 87, and total is -73.7°C. At -0.8°C, count is 116, and total is -80.0°C. At -0.6°C, count is 206, and total is -111.5°C. At -0.5°C, count is 282, and total is -109.2°C. At -0.3°C, count is 412, and total is -93.3°C. At -0.2°C, count is 414, and total is -33.8°C. At 0.0°C, the count is 494, and the total is 38.4°C. At 0.2°C, the count is 490, and the total is 114.8°C. At 0.3°C, the count is 362, and the total is 139.1°C. At 0.5°C, the count is 372, and the total is 201.4°C. At 0.6°C, the count is 242, and the total is 168.6°C. At 0.8°C, the count is 186, and the total is 158.5°C. At 0.9°C, the count is 106, and the total is 106.0°C. At 1.1°C, the count is 57, and the total is 66.9°C. At 1.2°C, the count is 29, and the total is 38.2°C. At 1.4°C, the count is 10, and the total is 14.5°C. At 1.6°C, the count is 5, and the total is 8.0°C.
- In-Analysis Recommendations:
ANALYSIS: Country by Vector Disease Risk Score
· Focus on boosting mosquito control programs in high-risk countries like Colombia and Nigeria to cut down on diseases.
· Share these scores with health teams in affected areas to plan better prevention efforts, like vaccines or education.
· Look into why some countries have lower scores and see if their methods can be copied elsewhere.
ANALYSIS: Extreme Weather Conditions By Country Code
· Build stronger early warning systems in top countries like Bangladesh and the USA to help people prepare for events.
· Work with governments to improve infrastructure, such as better flood defences, to reduce damage.
· Track these events over time to spot patterns and adjust policies for climate adaptation.
ANALYSIS: Temperature by Year
· Use these trends to predict heatwaves in summer months and prepare health services for more admissions.
· Investigate the sharp Q4 drop in 2025 to check for errors or new climate factors.
· Share this data with weather experts to improve forecasts and help communities adapt to changing seasons.
ANALYSIS: Link Between Temperature and Health-Related Admissions
· Push for cleaner air policies in areas with high indexes to lower respiratory risks.
· Invest in healthcare for regions with lower GDP to handle temperature-related illnesses better.
· Monitor these links closely to spot early signs of health impacts from climate change.
ANALYSIS: Regional Performance of Cardio Mortality Rate
· Boost heart health programs in Europe, such as better diets and exercise campaigns.
· Improve medical care in high-risk areas like Africa and Southeast Asia to reduce deaths.
· Study how climate changes, like heat, might worsen heart issues and plan for that.
ANALYSIS: Food Security by Region
· Support farming improvements in low-scoring areas like Oceania and East Asia to build resilience.
· Create aid programs for Africa and Southeast Asia to ensure steady food access during bad weather.
· Track how climate events affect these indices and adjust global food policies.
ANALYSIS: Distribution of Temperature Anomalies by Income Level
· Help lower-income regions prepare for bigger anomalies with funding for cooling systems or emergency plans.
· Use this data to guide investments in green tech to reduce temperature rises globally.
· Monitor these distributions yearly to see if gaps between income levels are growing.
8. Data Visualisations:
- Country by Vector Disease Risk Score: A Map was used.
- Extreme Weather Conditions By Country Code: A bar chart was used.

- Temperature By Year: A forecast was used

- Link Between Temp. & Health-Related Admissions: A Scatter Plot was used.

- Regional Performance of Cardio Mortality Rate: A Bar Chart was used

- Food Security by Region: A Treemap was used

- Distribution of Temperature A. /Income Level: A histogramwas used

11. Observations and Recommendations:
11.1. Post-Analysis Observations:
ANALYSIS: Food Security by Region — Europe
· The Vector Disease Risk Score in this region ranges from a high of 2,902.20 to a low of 2,815.40. Food security index shows the highest as 276,663, and the lowest as 54,600. Temperature has the highest as 194.1°C, and the lowest as -573.2°C. The temperature anomaly has the highest value of 133.5°C and the lowest value of -84.9°C. The countries under this region have these codes: DEU, GER, and ITA.
· For analysis on food security by region, Europe has 276,663 total food security. In 2015, the Q2 has 104.7°C temperature, and Q3 has -523.0°C. In 2016, Q1 had a 133.4°C temperature, and in Q3 of the same year, it had -520.5°C. In 2017, Q1 had 102.6°C of temperature, and in the same year, Q3 had -529.4°C. In 2018, Q1 has 133.3°C, and in same year, Q4 has -541.7°C. In 2019, Q2 has 142.8°C, and Q3 has -558.2°C. In 2020, Q1 has 134.3°C, and Q3 has -490.1°C. In 2021, Q1 has 101.0°C, and Q3 has -529.3°C. In 2022, Q1 has 114.3°C, and Q3 has -492.4°C. In 2023, Q1 has 114.3°C, and Q3 has -492.4°C. In 2024, Q2 has 136.2°C, and Q4 has -500.8°C. In 2025, Q1 has 143.0°C, and Q3 has -542.0°C. The regional performance of the Cardio Mortality rate for this region is 87,011. The countries in this region experiencing vector disease risk scores are Spain, France, and Italy, with 2,815.40, 2,840.80, and 2,844.70 vector disease risk scores, respectively. For extreme weather conditions by country code, ITA has 103 counts, GBR has 101 counts, and DEU has 100 counts. The link between temperature and health-related admissions shows an air quality index of 190,593. GDP per capita of $172,595,234.00. Respiratory disease rate of 179,643. Temperature of -8,297°C. Distribution of temperature anomaly by income level for this region shows High income level with -1.2°C,-1.1°C,-0.9°C, -0.8°C, -0.6°C, -0.5°C, -0.3°C, -0.2°C, 0.0°C, 0.2°C, 0.3°C, 0.5°C, 0.6°C, 0.8°C, 0.9°C, 1.1°C, 1.2°C, 1.4°C, 1.6°C temp anomaly (bin) respectively, count of temp anomaly as 12°C,35°C, 53°C, 101°C, 158°C, 198°C, 280°C, 288°C, 372°C, 342°C, 290°C, 248°C, 153°C, 129°C, 76°C, 43°C, 23°C, 7°C, and 1°C respectively, and temp anomaly as -13.7°C, -35.3°C, -45.1°C, -70.4°C, -84.9°C, -77.2°C, -65.5°C, -22.4°C, 28.9°C, 80.8°C, 113.5°C, 133.5°C, 106.7°C, 109.7°C, 76.6°C, 49.6°C, 30.8°C, 10.1°C, and 1.7°C respectively.
ANALYSIS: Distribution of Temperature Anomaly By Income Level — High
· The Vector Disease Risk Score for this income level shows the highest as 393.60, and the lowest as 313.20. Food security index shows the highest as 33,611, and the lowest as 6,206. Temperature has the highest as 127.0°C, and the lowest as -169.9°C. The temperature anomaly has the highest value of 240.7°C and the lowest value of -149.3°C. The regions under this income level are East Asia, Europe, North America, and Oceania. The countries under this region have this code: CAN, DEU, GBR, ITA, and USA.
For analysis on the distribution of temp anomaly by high income level, the temp anomaly (bin) is 0.2°C, the count of temp anomaly is 622°C, and the temp anomaly is 146.2°C. Regional performance of cardio mortality rate has Europe with 10,618, North America with 4,293, Oceania with 2,376, and East Asia with 2,011. Food security by region shows Europe with 33,611, North America with 13,514, East Asia with 6.206, and Oceania with 7,469. For extreme weather conditions, CAN, USA, ITA, DEU, and GBR have 18, 14, 12, 12, and 9, respectively. The United States has a 363.70 vector disease risk score, Spain has a 313.20 vector disease risk score, France has a 376.10 vector disease risk score, and Italy has a 393.60 vector disease risk score. In 2015, the Q1 has 37.9°C temperature, Q2 has 69.5°C, and Q3 has -72.3°C and Q4 has -94.5°C. In 2016, Q1 has 49.0°C, Q2 has 57.2°C temperature, Q3 of same year has -90.2°C, and Q4 has -159.0°C. In 2017, Q1 has 55.2°C of temperature, Q2 has 40.3°C, Q3 has -111.3°C, and in same year, Q4 has -86.0°C. In 2018, Q1 had 21.8°C, Q2 had 100.7°C, Q3 had -91.4°C, and in the same year, Q4 had -117.1°C. In 2019, Q1 had 96.7°C, Q2 had 91.5°C, Q3 had -101.9°C, and Q4 has -44.3°C. In 2020, Q1 had 120.7°C, Q2 had 39.8°C, Q3 has -73.1°C, and Q4 has -8.1°C. In 2021, Q2 had 52.9°C, Q2 had 28.3°C, Q3 has -95.3°C, and Q4 had -53.4°C. In 2022, Q1 had 39.3°C, Q2 had 31.7°C, Q3 has -64.4°C, and Q4 had -89.4°C. In 2023, Q1 had 40.3°C, Q2 had 83.6°C, Q3 had -68.0°C, and Q4 had -61.1°C. In 2024, Q1 had 127.0°C, Q2 has 38.6°C, Q3 had -94.0°C, and Q4 had -154.3°C. In 2025, Q1 has 116.4°C, Q2 had 82.9°C, Q3 had -169.9°C, and Q4 has -30.1°C.
ANALYSIS: Food Security by Region — Africa
· The Vector Disease Risk Score in this region ranges from a high of 22,986 to a low of 2,809. Food security index shows the highest as 276,663, and the lowest as 54,600. Temperature has the highest as 1,075.3°C, and the lowest as 93.9°C. The temperature anomaly has the highest value of 77.6°C and the lowest value of -45.8°C. The countries under this region have this code, ZAF.
For analysis on food security by region, Africa has 201,979 total food security. In 2015, the Q2 has 1,053.1°C temperature, Q3 has 537.5°C, and Q4 has 543.9°C. In 2016, Q2 has 1,047.0°C temperature, Q3 of same year has 525.8°C, and Q4 has 498.7°C. In 2017, Q1 has 1,048°C of temperature, Q3 has 513.4°C, and in same year, Q4 has 556.7°C. In 2018, Q1 had 950.3°C, Q3 had 542.7°C, and in the same year, Q4 had 522.4°C. In 2019, Q1 has 1,024.8°C, Q3 has 503.8°C, and Q4 has 531.0°C. In 2020, Q1 has 1,054.5°C, Q3 has 509.2°C, and Q4 has 534.3°C. In 2021, Q2 has 1,041.4°C, Q3 has 522.2°C, and Q4 has 529.1°C. In 2022, Q1 has 1,042.3°C, Q3 has 536.0°C, and Q4 has 553.6°C. In 2023, Q1 has 1,038.3°C, and Q4 has 565.0°C. In 2024, Q2 has 1,046.8°C, Q3 has 511.9°C, and Q4 has 533.7°C. In 2025, Q1 has 1,056.2°C, Q3 has 528.1°C, and Q4 has 93.9°C. The regional performance of the Cardio Mortality rate for this region is 69,330. The countries in this region experiencing vector disease risk score are Nigeria, Egypt, South Africa and Kenya, with 14,381, 2,921, 2,809, and 22,986, respectively. For extreme weather conditions by country code, ZAF has 103 counts. The link between temperature and health-related admissions shows an air quality index of 300,714. GDP per capita of $10,624,444.00. Respiratory disease rate of 173,582. Temperature of 34,333°C. Distribution of temperature anomaly by income level for this region shows Lower-Middle income level with -1.4°C,-1.2°C,-1.1°C, -0.9°C, -0.6°C, -0.5°C, -0.3°C, -0.2°C, 0.0°C, 0.2°C, 0.3°C, 0.5°C, 0.6°C, 0.8°C, 0.9°C, 1.1°C, 1.2°C, 1.4°C, 1.6°C, 1.1°C, 1.2°C, 1.4°C, temp anomaly (bin) respectively, count of temp anomaly as 2°C, 6°C, 20°C, 54°C, 86°C, 112°C, 160°C, 187°C, 205°C, 230°C, 198°C, 144°C, 91°C, 70°C, 47°C, 29°C, 17°C, 5°C, and 2°C respectively, and temp anomaly as -2.6°C, -20.3°C, -21.8°C, -37.3°C, -45.8°C, -43.3°C, -36.3°C, -13.4°C, 15.9°C, 54.7°C, 77.3°C, 77.6°C, 63.3°C, 60.1°C, 48.1°C, 33.8°C, 22.4°C, 7.5°C, and 3.3°C respectively. Upper-Middle income level have -1.1°C, -0.9°C, -0.8°C, -0.6°C, -0.5°C, -0.3°C, -0.2°C, 0.0°C, 0.2°C, 0.3°C, 0.5°C, 0.6°C, 0.8°C, 0.9°C temp anomaly (bin), count of temp anomaly as 20°C, 25°C, 45°C, 66°C, 53°C, 83°C, 71°C, 37°C, 54°C, 38°C, 24°C, and 13°C respectively, and temp anomaly as -7.6°C, -14.6°C, -13.4°C, -17.9°C, -15.2°C, -4.7°C, 6.3°C, 17.1°C, 14.4°C, 28.9°C, 26.3°C, 20.9°C, 13.0°C, 5.8°C, and 5.2°C respectively.
ANALYSIS: Distribution of Temperature Anomaly by Income Level — Upper-Middle
· The Vector Disease Risk Score for this income level shows the highest as 2,152, and the lowest as 327. The food security index shows the highest as 19,794, and the lowest as 6,251. Temperature has the highest of 297.5°C, and the lowest of 0.9 °C. The temperature anomaly has the highest value of 240.7°C and the lowest value of -149.3°C. The regions under this income level are East Asia, North America, South America, Southeast Asia, and Africa. The countries under this region have this code: BRA, COL, THA, and ZAF.
· For analysis on the distribution of temp anomaly by Upper-Middle income level, with the temp anomaly (bin) of 0.2°C, the count of temp anomaly of 490°C, and the temp anomaly is 114.8°C. Regional performance of cardio mortality rate has South America with 6,655, and North America with 2,091. Food security by region shows South America with 19,794, Africa with 6,831, East Asia with 6,612, Southeast Asia with 6,473, and North America with 6,251. For extreme weather conditions, ZAF, BRA, THA, and COL have 21, 14, 13, and 10, respectively. Mexico has a 433-vector disease risk score, Colombia has a 2,152-vector disease risk score, Brazil has a 4,154-vector disease risk score, Argentina has 403, South Africa has 374, and China has a 327-vector disease risk score. In 2015, the Q1 has 230.8°C temperature, Q2 has 225.5°C, and Q3 has 34.7°C and Q4 has 98.8°C. In 2016, Q1 has 110.3°C, Q2 has 170.3°C temperature, Q3 of same year has 43.2°C, and Q4 has 4.7°C. In 2017, Q1 has 44.6°C of temperature, Q2 has 114.9°C, Q3 has 129.1°C, and in same year, Q4 has 119.7°C. In 2018, Q1 had 248.8°C, Q2 had 193.5°C, Q3 had -44.6°C, and in the same year, Q4 had 56.1°C. In 2019, Q1 had 165.0°C, Q2 had 297.5°C, Q3 had 108.6°C, and Q4 has 77.0°C. In 2020, Q1 had 120.2°C, Q2 had 219.6°C, Q3 has 49.5°C, and Q4 has 57.5°C. In 2021, Q2 had 129.0°C, Q2 had 196.5°C, Q3 has 71.6°C, and Q4 had 41.2°C. In 2022, Q1 had 261.2°C, Q2 had 194.2°C, Q3 has 39.6°C, and Q4 had 102.4°C. In 2023, Q1 had 275.8°C, Q2 had 162.2°C, Q3 had 76.6°C, and Q4 had 39.7°C. In 2024, Q1 had 172.7°C, Q2 has 115.6°C, Q3 had 82.7°C, and Q4 had 49.8°C. In 2025, Q1 has 120.4°C, Q2 had 224.5°C, Q3 had 76.6°C, and Q4 has 0.9°C.
11.2 Post-Analysis Recommendations:
ANALYSIS: Food Security by Region — Europe
· High Priority: Strengthen air quality regulations in Europe by setting stricter limits on emissions from factories and cars, and funding clean energy projects like wind farms to lower the air quality index. This can directly reduce respiratory disease rates and hospital admissions linked to pollution, especially in cities with high scores.
· Medium Priority: Boost vector disease prevention in high-risk countries like Italy and France by running public vaccination drives, distributing mosquito nets, and educating people on avoiding bites. Work with local health groups to monitor outbreaks and provide quick treatments.
· Low Priority: Monitor temperature anomalies yearly by setting up regular checks on weather data and sharing reports with farmers and policymakers. This helps adjust food security plans, like switching crops that handle cold snaps better, to avoid shortages from climate shifts.
ANALYSIS: Distribution of Temperature Anomaly by Income Level — High
· High Priority: Focus on reducing cardio mortality in Europe by launching campaigns for heart-healthy diets, exercise programs, and better access to cardiac care in hospitals, targeting areas with high rates to save lives.
· Medium Priority: Enhance extreme weather preparedness in North America and Europe by updating building codes for storms and floods, and creating emergency response teams with supplies like generators and water.
· Low Priority: Review food security trends in East Asia by analysing yearly reports and working with local governments to ensure stable supplies, like importing grains if needed during temperature changes.
ANALYSIS: Food Security by Region — Africa
· High Priority: Increase funding for food security programs in Africa by providing subsidies for drought-resistant crops and building storage facilities in countries with high vector disease scores, like Kenya and Nigeria. This can help communities stock up on food during outbreaks or bad weather.
· Medium Priority: Improve air quality monitoring and respiratory health services by installing more sensors in cities and training doctors to treat pollution-related illnesses, given the high index and disease rates. Partner with international groups for better equipment.
· Low Priority: Track temperature trends quarterly by collecting data from local weather stations and sharing it with farmers to prepare for anomalies affecting agriculture, like planning harvests around expected heat or cold spells.
ANALYSIS: Distribution of Temperature Anomaly by Income Level — Upper-Middle
· High Priority: Address vector disease risks in South America, especially Brazil and Colombia, with targeted control efforts like spraying insecticides, improving sanitation, and providing vaccines to high-risk communities to prevent outbreaks.
· Medium Priority: Boost food security in Southeast Asia and Africa by supporting sustainable farming practices, such as irrigation systems and crop diversification, to handle temperature anomalies and ensure steady supplies.
· Low Priority: Monitor cardio mortality trends in North America by tracking health data and promoting awareness campaigns on heat-related heart risks, adjusting policies as needed for rising temperatures.
12. Conclusion:
This Tableau-powered Global Climate Health Impact Tracker analysis (2015–2025) reveals critical climate-health linkages through interactive dashboards, highlighting Colombia (17,881) and Nigeria (14,481) dominating vector disease risks, Bangladesh (114 events) leading extreme weather exposure, seasonal temperature patterns (~4,400°C Q1/Q2 averages with forecasting), Europe’s leadership in cardio mortality (87,011) and food security (276,663), and income-level temperature anomaly disparities visualized via dynamic histograms. The dashboard’s interactive map enables vector disease drill-downs by country and income filters, forecast trends display temperature evolution with confidence intervals, cross-filters update all metrics simultaneously by region selection, and guided story points narrate the progression from climate drivers to health outcomes to policy recommendations. Strategically, it drives immediate actions like mosquito control in Colombia/Nigeria, early warnings in Bangladesh/USA, and air quality interventions in Europe/Africa, while targeting resources toward upper-middle-income food security in Brazil/South Africa and low-income cooling infrastructure. This analysis demonstrates Tableau’s power for climate-health intelligence, transforming complex global datasets into executive-ready, interactive decision platforms that enable quarterly forecasts, regional treemaps, and equity-focused parameter controls. Future enhancements include Tableau Prep flows for automated ETL, Python integration via TabPy for advanced forecasting, and Tableau CRM for AI-driven anomaly detection to strengthen global climate resilience.
13. References:
Kaggle.com (Global Climate Health Impact Tracker CSV dataset, 2015–2025)
Tableau Public/Server:
메타데이터
- post_id
- 338d959d094e
- slug
- global-climate-health-impact-tracker-2015-2025-338d959d094e
- url
- https://medium.com/@tunmiseiwayemi/global-climate-health-impact-tracker-2015-2025-338d959d094e
- canonical_url
- https://medium.com/@tunmiseiwayemi/global-climate-health-impact-tracker-2015-2025-338d959d094e
- author_url
- https://medium.com/@tunmiseiwayemi
- status
- ok
- fetched_at
- 2026-06-09 15:37:30