A/B TESTING
Based on statistics, its main purpose is to compare the outputs and changes of design and content samples at an ideal level by performing…
A/B TESTING

Based on statistics, its main purpose is to compare the outputs and changes of design and content samples at an ideal level by performing pairwise comparisons. It is on hypothesis theses in statistics and on the principle of whether the data output of two different situations is significantly different from each other.
- Comparing Two Group Means (Independent Two Sample T-Test) It is used when it is desired to make a comparison between the mean of two groups. First of all, assumption check is done, normality assumption and variance homogeneity check. If the assumptions are met in both cases and our p value is less than 0.05, the Parametric test -T test- is applied. If the assumptions are not met, the nonparametric test -mannwhitneyu- is applied.
2 )Two Group Ratio Comparison (Two Sample Ratio Test) 3 ) Mean Comparison of More than Two Groups
Now let’s observe practically through a scenario. A/B Test Variations
Groups
Test Group: Using Maximum bidding
Control Group: Using Average bidding
Variables
Impression: Variables such as the number of ad views
Click: The number of clicks ,
Purchase: The number of purchases of the product in the ad
Earning: Income
Hypothesis — As a result of using two different bidding methods It is desired to investigate whether there is a significant difference on the basis of purchase (purchase).
The H0 and H1 hypotheses are constructed as follows: H0: There is no statistically significant difference between the amount of sales realized as a result of using the Maximum bidding method and the amount of sales realized as a result of using the Average bidding method. H1: There is a statistically significant difference between the amount of sales realized as a result of using the Maximum bidding bid method and the amount of sales realized as a result of using the Average bidding bid method.
Let’s move on to the code:

Required libraries are imported
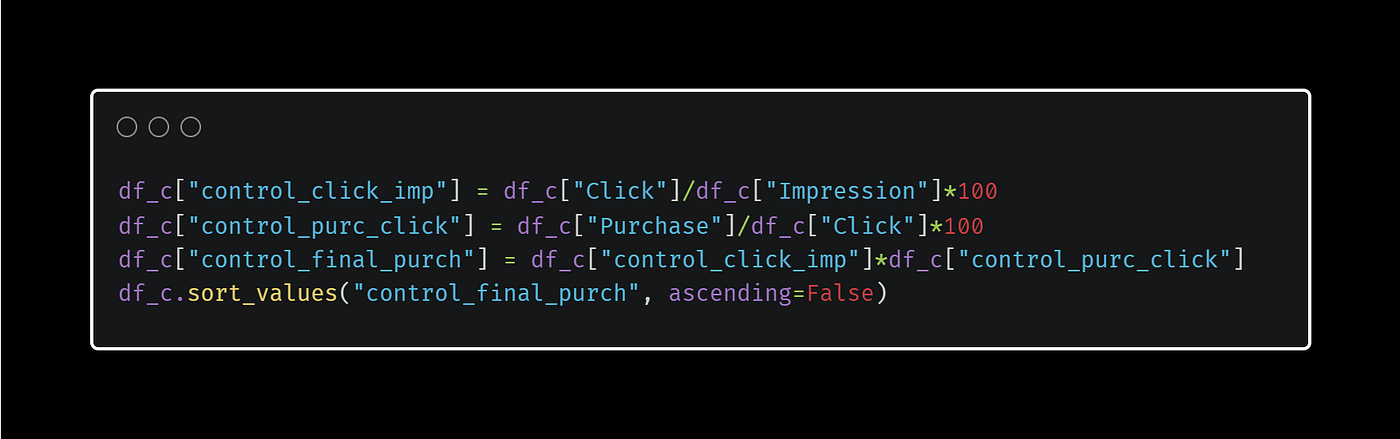
impression-click and click-purchase ratio for the control (doing same thing on test group, too).
# H0: Control Group Normal distribution assumption is provided.
# H1:Control Group Normal distribution assumption is not provided.
# If p-value < 0.05 to HO REJECTED.
# 0.05 H0 CANNOT BE REJECTED unless p-value <.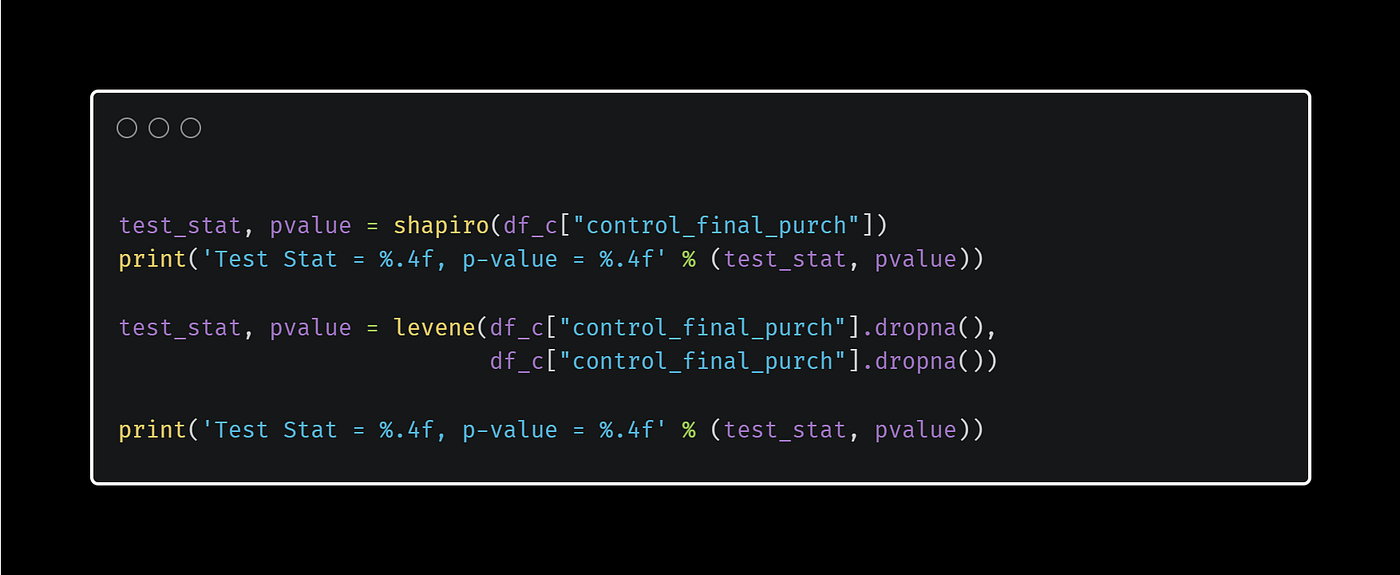
# Assumption of Normality
# Variance Homogeneity
Since two assumptions are made, an independent two-sample t-test is used.(parametric test)
# If p-value < 0.05 to H0 REJECTED.
# If p-value > 0.05 H0 CANNOT BE REJECTED.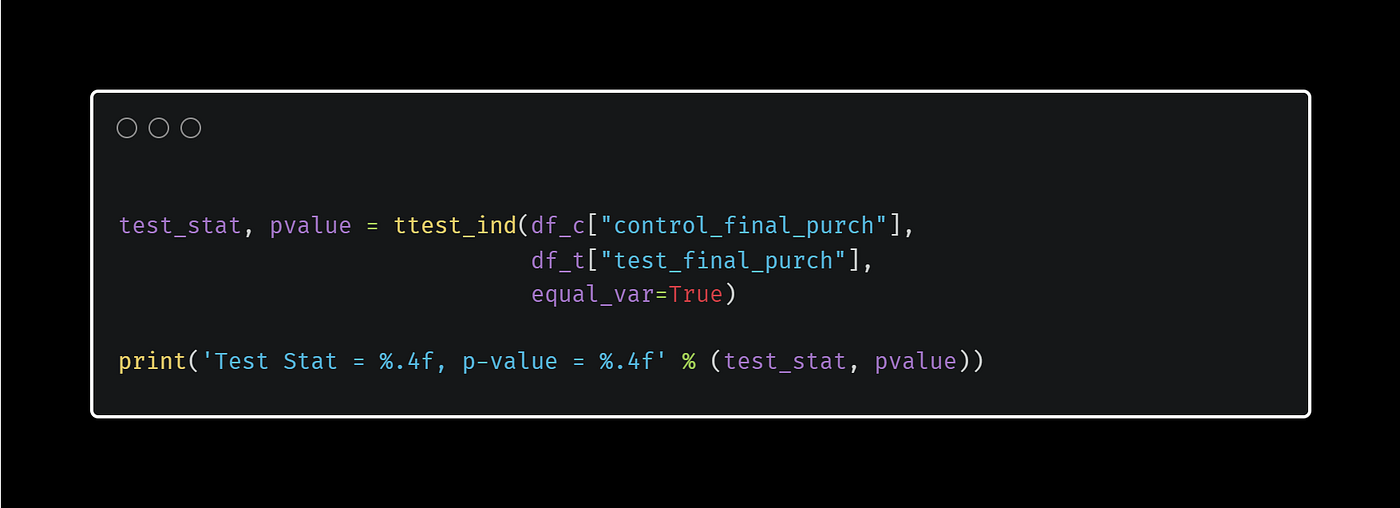
Output P value is higher than 0.05. H0 CANNOT be rejected. As a result, there is no statistically significant difference between the purchase in the Control Group and the purchase in the Test Group, with 95% confidence. Our analysis is based on the number of purchases. There is no statistical significance between the number of purchases. However, when the total revenues generated as a result of these acquisitions are compared, Test Group stands out with a positive difference of 31.77%.
Suggestions We need more data to measure the effect of the Average bidding bidding method more precisely. Rather than getting an idea of whether there is a significant difference between the number of purchases of the company, an AB Test is required to find out if there is a significant difference between revenues (Earning).
You can find dataset HERE in github.
This work has been done with the support of VBO, Vahit Keskin, Oğuz Erdoğan, handey, Mehmet Tuzcu, Burak Doğrul.
See you in other articles.
You can reach my ***LinkedIn *and [git.hub](https://github.com/zeyland)** accounts that we can communicate with.
Another article that may be useful to you:
메타데이터
- post_id
- 33d425ded404
- slug
- a-b-testing-33d425ded404
- url
- https://medium.com/@zeyland/a-b-testing-33d425ded404
- canonical_url
- https://medium.com/@zeyland/a-b-testing-33d425ded404
- author_url
- https://medium.com/@zeyland
- status
- ok
- fetched_at
- 2026-07-27 16:14:39