Per-project LLM cost attribution with OTel spans: the wiring
How we tag spans at the gateway, roll cost up by team in Grafana, and page when a team’s output tokens double
Per-project LLM cost attribution with OTel spans: the wiring
How we tag spans at the gateway, roll cost up by team in Grafana, and page when a team’s output tokens double
TL;DR. If your LLM bill is one line item on a cloud invoice, you cannot answer “which team spent that?” We fixed this by tagging every gateway span with team.id, project.id, and feature.id, plus the OpenInference token-count attributes, shipping those spans through an OTel collector into Tempo, and rolling cost up per team with TraceQL in Grafana.
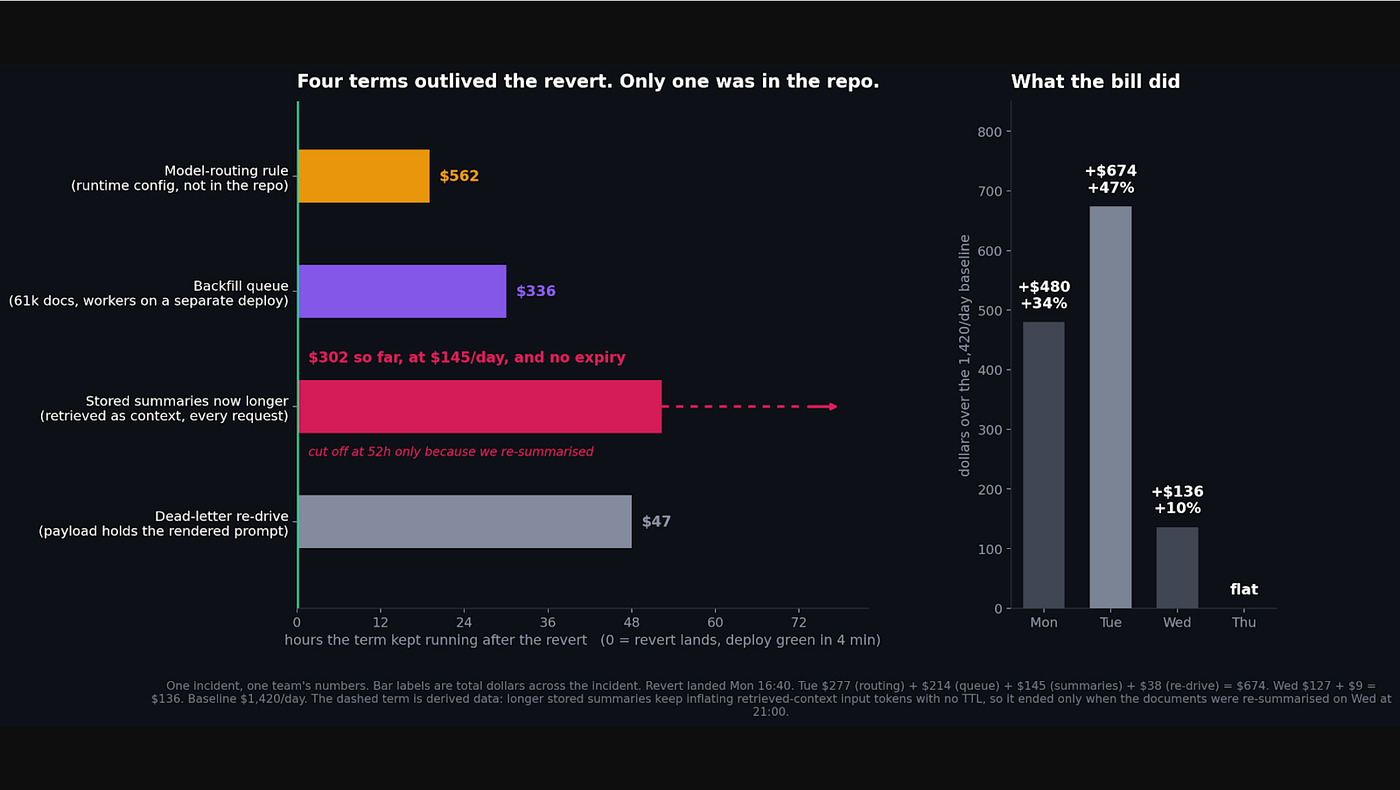
The payoff that sold it internally: one team’s monthly spend quietly went from a few hundred dollars to over a thousand because of a retry loop, and the org-level dashboard never flinched. The per-team view caught it in a day.
Below is the wiring, the collector config, the rollup query, the alert, and the attributes I tried and threw away.
1. The Problem Is Attribution, Not Collection
Most teams already collect LLM telemetry. Spans exist, tokens get counted, traces land somewhere. What is missing is the dimension that finance and engineering leaders actually ask about: who owns this spend.
The provider invoice gives you one number per month per API key. If you share keys across services (most people do at some point), that number is useless for chargeback. You cannot tell the platform team’s spend from the support-bot team’s spend.
So the design goal was narrow:
Every LLM call has to carry enough labels that I can group spend by team, by project under that team, and by feature inside that project.
Three levels. No more, because deeper than feature and nobody reads the dashboard.
I standardized the whole pipeline on OpenTelemetry and OpenInference. One opinion I’ll state plainly: I want the labels, wire format, and storage to be things I can swap without rewriting instrumentation. We tag spans with open semantic conventions so the day we change a backend or dashboard tool, the gateway code does not move.
That is a portability decision, not a verdict on anyone’s product.
2. Which Attributes Get Tagged, and Where
Tag at the gateway, not in each service. We run an LLM gateway (every call to every provider goes through it), so it is the one place that sees model, token counts, and request context together. A new service gets attribution for free as long as it routes through the gateway and forwards the three context headers.
The cost-math group comes straight from OpenInference semantic conventions: llm.model_name, llm.token_count.prompt, llm.token_count.completion. The attribution group is custom, set from request headers: team.id, project.id, feature.id. Cost is not a span attribute. I compute it at query time from token counts and a small price lookup, because prices change and I do not want last quarter’s spans frozen at last quarter’s rates.

3. The Collector Config
OTLP in, batch, set anything the gateway missed, Tempo out.The one processor worth calling out is transform.
I use it to backfill team.id with a sentinel when a service forgets the header, so unlabeled spend shows up as unattributed instead of vanishing.
Cost with no label is cost you will never find.
receivers:
  otlp:
    protocols:
      grpc:
        endpoint: 0.0.0.0:4317
      http:
        endpoint: 0.0.0.0:4318
processors:
  batch:
    timeout: 5s
    send_batch_size: 1024
  transform/attribution:
    trace_statements:
      - context: span
        statements:
          - set(attributes["team.id"], "unattributed") where attributes["team.id"] == nil
          - set(attributes["project.id"], "unknown") where attributes["project.id"] == nil
          - set(attributes["feature.id"], "unknown") where attributes["feature.id"] == nil
exporters:
  otlp/tempo:
    endpoint: tempo:4317
    tls:
      insecure: true
service:
  pipelines:
    traces:
      receivers: [otlp]
      processors: [transform/attribution, batch]
      exporters: [otlp/tempo]
Two notes from running this:
- Put
transformbeforebatchso the backfill happens per span while the data is still cheap to touch. - Keep the price table out of the collector.
I tried encoding per-model rates as collector attributes once. Every price change became a config deploy, and the rates drifted out of sync with what we were actually billed.
Pricing lives next to the query now.
4. Rolling Cost Up by Team in Grafana
Tempo stores spans, not dollars.
So the rollup is two steps:
- TraceQL pulls token sums grouped by attribution attributes.
- A small price map turns tokens into cost downstream.
I start from this query, which aggregates output-token counts (the number I watch most because completion tokens are usually where the money and the runaways are):
{ .team.id = "support-platform" && .llm.token_count.completion > 0 }
| select(
    .project.id,
    .feature.id,
    .llm.model_name,
    .llm.token_count.prompt,
    .llm.token_count.completion
  )
| by(.team.id, .project.id, .llm.model_name)
| sum(.llm.token_count.completion)
Drop the team.id filter and group by it instead for the all-teams board.
The grouping by llm.model_name matters:
A mini-tier model and a frontier model can differ by more than an order of magnitude per token, so summing raw tokens across models hides which team is expensive because of volume versus model choice.
The dollar step is deliberately dumb:
- Look up model pricing.
- Multiply prompt tokens by input rates.
- Multiply completion tokens by output rates.
- Sum per team.
Keeping it external lets me re-price history whenever a provider changes rates.
5. The Alert: Page When a Team’s Output Tokens Jump
Cost attribution is reporting.
The thing that earns its keep is the page.
The rule I run is:
If this week’s completion-token total for any team is more than 2× the same window last week, page.
Output tokens, not input tokens.
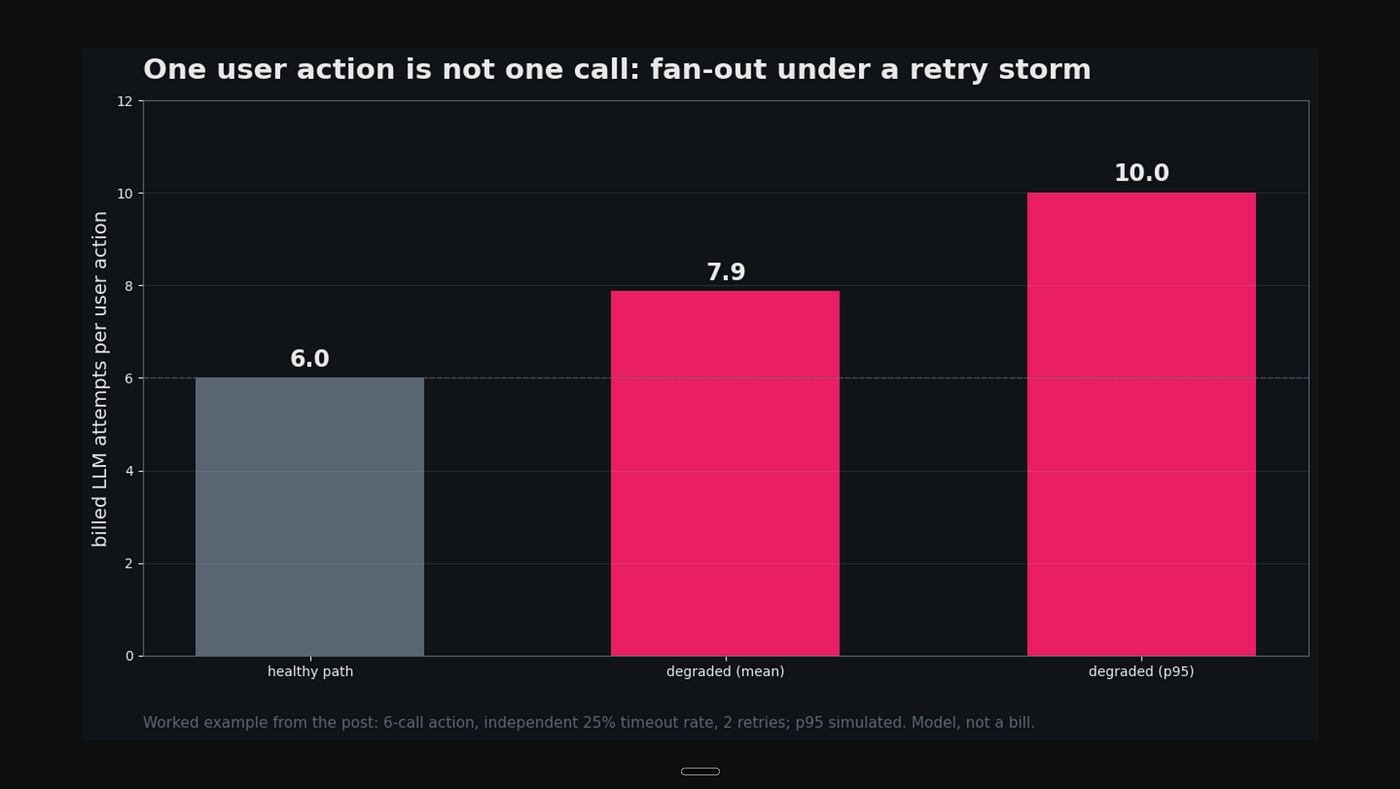
The runaway failure modes — retry storms, agent loops, prompt-chaining bugs — show up as generation volume first.
Why 2× week-over-week instead of a fixed dollar ceiling?
A fixed ceiling either:
- Pages constantly for big teams.
- Never fires for small teams.
A relative jump normalizes across team size automatically.
The team whose spend doubled in the story above would have tripped a 2× rule on day one.
It did not trip our org-wide dollar alert because the absolute number was still small against the company total.
Small against the org. Doubled for the team.
That is exactly the blind spot per-team attribution exists to close.
Route the alert to whoever owns the team’s budget, not a shared channel where it gets ignored.
6. What I Tagged and Then Dropped
user.id
Per-user spend sounds useful and is occasionally requested.But putting a user identifier on every span means every trace is now PII, and your tracing backend inherits the retention, access, and deletion obligations that come with that.The attribution win did not come close to justifying the compliance surface.Dropped it. Have not missed it.
request.id
Pure redundancy.A trace already has a trace ID and every span has a span ID.Anywhere I thought I wanted it, the trace ID was already there and already correct.The pattern in both cases:
An attribute is only worth tagging if it answers a question the cheaper attributes cannot, and if its cost (privacy, plumbing, drift) is lower than that answer is worth.
FAQ
Why compute cost at query time instead of writing a cost attribute on the span?
Prices change and I want to re-cost history when they do.A cost attribute freezes the rate at write time.
Do I need the gateway, or can each service tag its own spans?
You can tag per service.I prefer the gateway because it sees model, token counts, and request context in one place, so a new service gets attribution simply by routing through it and forwarding three headers.
Why Tempo specifically?
It is what we run, and TraceQL’s aggregation over span attributes does the rollup I need.The attribute conventions are OpenInference, so the labels are not tied to Tempo.The point of standardizing on open conventions is that this choice is reversible.
What if a service forgets the attribution headers?
The collector backfills unattributed.The spend still shows up, just in a bucket whose name tells me to go fix the instrumentation.
Is week-over-week 2× too noisy?
For steady traffic, no.For genuinely spiky workloads, raise the ratio or widen the comparison window.I bias toward a slightly noisy page over a silent doubling.
Open Questions
- Cached prompt tokens bill at different rates (sometimes free), and I do not yet tag cache hits cleanly enough to price them correctly.
- Streaming and cancelled generations remain tricky. If a client disconnects mid-stream, what is the honest output-token count, and does the provider bill for tokens generated after the cancel?
- Feature-level granularity has a ceiling. I keep wanting per-prompt-version attribution, but every level deeper is one more label nobody reads.
- Whether the 2× week-over-week threshold should itself be per-team, since some teams are naturally spikier than others.
If you have wired cached-token pricing into a span-based cost model in a way that survives a provider changing cache rates, I’d love to hear how.
메타데이터
- post_id
- 33fc79d9832a
- slug
- per-project-llm-cost-attribution-with-otel-spans-the-wiring-33fc79d9832a
- url
- https://medium.com/@jasmine.park_60464/per-project-llm-cost-attribution-with-otel-spans-the-wiring-33fc79d9832a
- canonical_url
- https://medium.com/@jasmine.park_60464/per-project-llm-cost-attribution-with-otel-spans-the-wiring-33fc79d9832a
- author_url
- https://medium.com/@jasmine.park_60464
- status
- ok
- fetched_at
- 2026-06-20 20:29:01