The Linux OOM Killer Scored Your JVM at 999 and You Never Knew (How to Stop Losing Containers to…
Why your JVM heap looks healthy at 60% while the kernel sees 95% and reaches for the kill switch?
The Linux OOM Killer Scored Your JVM at 999 and You Never Knew (How to Stop Losing Containers to Memory Accounting You Do Not Understand)
Why your JVM heap looks healthy at 60% while the kernel sees 95% and reaches for the kill switch?
The 2 AM Page That Makes No Sense
Your JVM’s heap is using 1.2 GB of its 4 GB limit. Plenty of headroom. GC pause times are normal. No error logs, no stack traces, nothing in stdout. Thirty seconds later, the container is dead. You check kubectl describe pod and there it is: OOMKilled. Last state terminated with exit code 137. dmesg shows: oom-kill: memory cgroup out of memory. The kernel saw 3.9 GB of RSS. Your dashboard saw 1.2 GB. The 2.7 GB gap is what killed you, and your monitoring never reported a single byte of it.
The reaction is always the same. Someone bumps the memory limit from 2Gi to 3Gi, the deploys go green for a few weeks, and then the pages come back. The problem is not that you need more memory. The problem is that your monitoring is blind to where the memory actually goes.
Your JVM metrics are not lying. The heap really was at 60%. GC really was behaving. But the Linux kernel does not care about your heap. It cares about RSS, the total resident memory of your process as tracked by the cgroup. In a typical containerized JVM, in my experience, standard metrics dashboards miss 30–60% of actual process memory consumption. Thread stacks, metaspace, code cache, direct buffers from Netty, gRPC native allocations, JNI memory — all of it counts against your container limit, and none of it shows up in your heap graph.
The kernel’s OOM killer does not read your Prometheus metrics. It looks at memory.current versus memory.max in the cgroup, and when the limit is breached, it picks the process with the highest oom_score to kill. In a container running a single JVM, that score is almost always 999 out of 1000. There is no negotiation, no graceful shutdown, no log line. The process just disappears.
This pattern repeats across teams because the gap is structural. It is not a misconfiguration you can fix once. It is a fundamental mismatch between what JVM observability tools report and what the kernel actually enforces. Until you understand that mismatch, you are just buying time with larger limits.
What the OOM Killer Actually Sees
The OOM killer does not know what a JVM is. It does not parse heap dumps, it does not read your Grafana dashboards, and it certainly does not care that your garbage collector just completed a successful major collection. It operates on exactly one thing: resident set size relative to the cgroup memory limit.
The function oom_badness() in mm/oom_kill.c calculates a score from 0 to 1000 for every process in the cgroup. The core calculation is RSS divided by the allowed memory (memory.max in cgroup v2), multiplied by 1000 — though the actual kernel implementation also accounts for swap usage, page table pages, and adjustments from oom_score_adj. In a typical container running a single JVM process, that process owns nearly all the resident memory. The score comes out to 999. Every time. I have checked this on dozens of production pods across multiple clusters, and I have never seen a JVM container where the score was below 990.
Kubernetes does adjust oom_score_adj based on QoS class. Guaranteed pods get -997, which makes them nearly unkillable. But most JVM workloads run as Burstable because teams set requests lower than limits to bin-pack more pods per node. In a Burstable pod, the adjustment is minimal, and the JVM remains the obvious and only target.
The critical thing to understand about memory.max in cgroup v2 is that it is a hard wall. There is no grace period, no warning, no chance to run a GC cycle. The moment a memory allocation pushes the cgroup’s memory.current past memory.max, the kernel invokes the OOM killer synchronously in the context of that allocation. Your process does not get a signal first. It does not get to clean up. One allocation crosses the line, and the next thing that happens is SIGKILL.
The kernel sees one number: how many physical pages your process holds in RAM. It does not distinguish between heap, metaspace, direct byte buffers, thread stacks, JIT-compiled code, or memory-mapped files. All of it counts. All of it pushes you toward that hard wall. Your JVM might report 2 GB heap used out of 4 GB committed, and your monitoring says everything is fine. But if native allocations, thread stacks, and code cache push total RSS past the cgroup limit, the kernel kills you with zero ceremony and zero explanation beyond a single line in dmesg.
The Full Memory Bill Your JVM Is Running Up
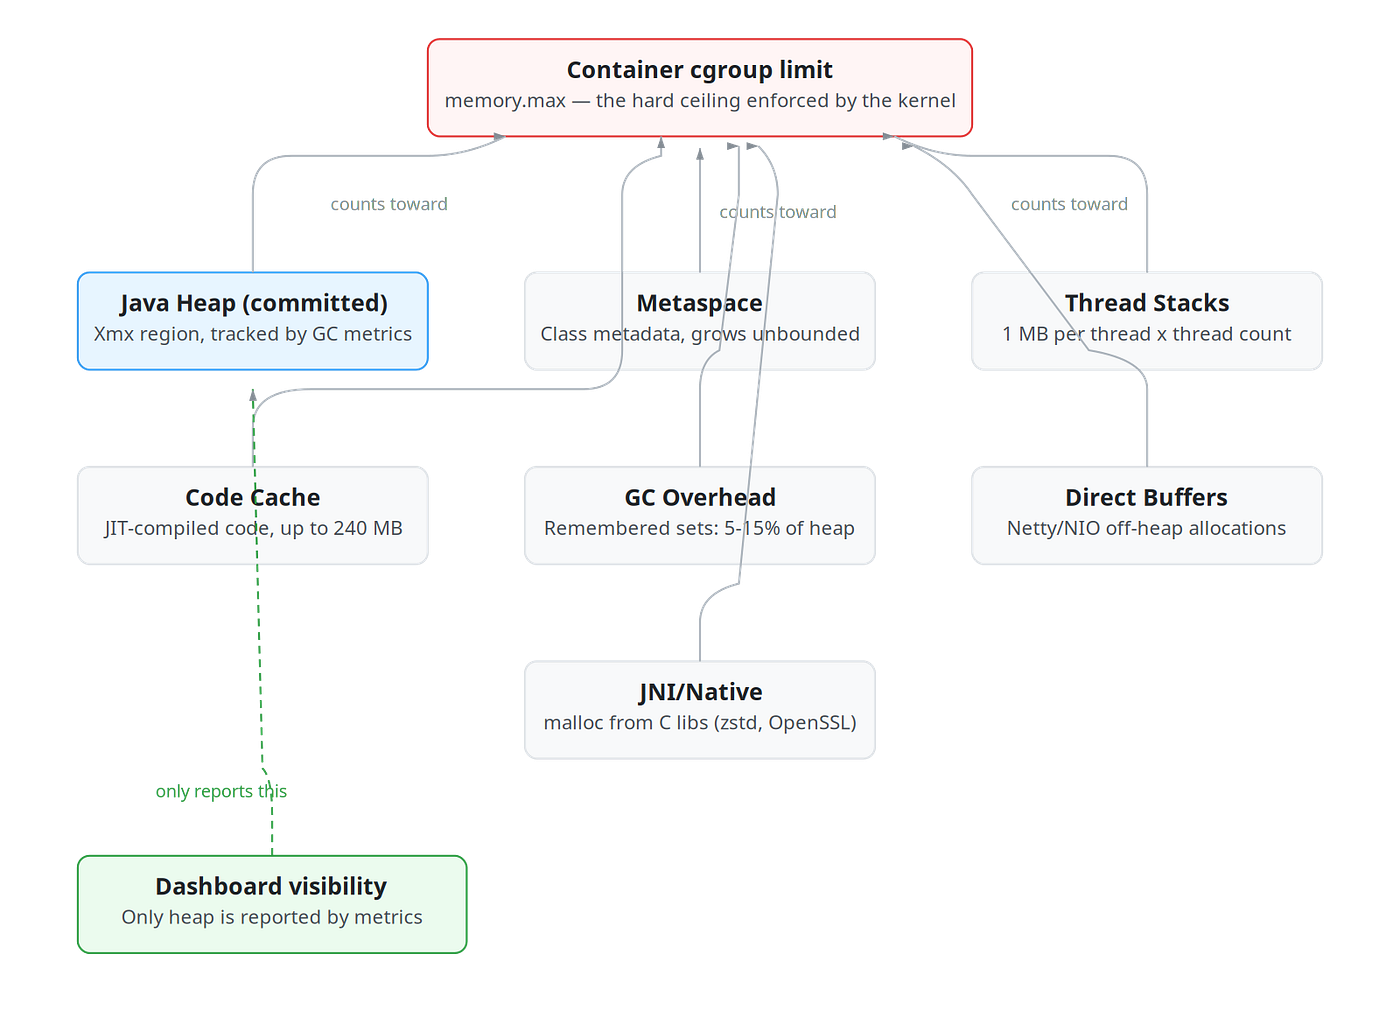
Diagram: The full memory regions inside a containerized JVM process that collectively count toward the cgroup limit, showing what dashboards report vs what the kernel sees.
Your JVM is not just running a heap. It is running an entire native process with a dozen memory regions, and most of them never show up in your Grafana dashboard.
The heap is the obvious one. But notice: the kernel does not care about heap used. It cares about heap committed — the physical pages the JVM has actually touched and mapped. If you set -Xmx4g and the JVM commits 3.2 GB after a few GC cycles, that is your baseline. In most services I have operated, committed heap accounts for 50–70% of total RSS. The rest is everything else, and “everything else” is where OOM kills come from.
Metaspace stores class metadata for every loaded class, and by default it grows without limit. A Spring Boot application with a few hundred dependencies can easily load 20,000–30,000 classes. Metaspace alone can reach 200–400 MB before anyone notices. Thread stacks are worse in a different way: each thread reserves 1 MB by default (-Xss1m). A reactive service with 500 threads — not unusual if you are running Tomcat with default settings or a gRPC server under load — quietly consumes 500 MB that no heap metric will ever report.
The JIT compiler needs somewhere to put its output. With tiered compilation enabled (the default since JDK 8), the code cache reserves up to 240 MB.
The G1 garbage collector maintains remembered sets and card tables that add 5–15% overhead on top of committed heap — on a 3 GB heap, that is another 150–450 MB of native memory. Direct ByteBuffers allocated through NIO or Netty live entirely outside the heap. If you are running a Netty-based service handling thousands of connections, direct buffer usage can reach hundreds of megabytes with nothing visible in JMX heap metrics.
If you run jcmd <pid> VM.native_memory summary with NMT enabled, you will see the full breakdown: Java Heap, Class, Thread, Code, GC, Compiler, Internal, Symbol, and more. The formula is straightforward: RSS ≈ heap committed + metaspace + code cache + thread stacks + direct buffers + GC overhead + JNI + internal. In my experience, a service configured with -Xmx2g commonly runs at 3.5–5 GB RSS in production. That gap between 2 GB and 5 GB is invisible to anyone watching only heap metrics, and it is exactly the gap that kills your container.
The Invisible Consumers That Kill You
Netty is the single worst offender I have encountered. The PooledByteBufAllocator defaults its maximum direct memory to Runtime.getRuntime().maxMemory(), which in practice means your -Xmx value. If you set -Xmx2g, Netty will happily allocate up to 2 GB of direct ByteBufs outside the heap. Your process now has a theoretical ceiling of 4 GB before you even count thread stacks, metaspace, or code cache. One service I operated had Netty direct buffers alone consuming more memory than the configured heap, and the team had no idea because their Grafana dashboard only showed heap utilization at 60%.
If you use gRPC-Java, you inherit this problem automatically. gRPC-Java uses Netty as its default transport, and every RPC channel allocates direct buffers for serialization. High-throughput services with many concurrent streams can accumulate hundreds of megabytes in direct buffers that no JMX metric will report unless you explicitly query BufferPoolMXBean.
Then there are JNI allocations, which are worse because they are completely invisible to the JVM itself. Libraries like snappy, zstd, lz4, and OpenSSL call malloc() directly from native code. The JVM has no tracking for these allocations. NativeMemoryTracking will not show them. They simply grow RSS from the kernel’s perspective, and the cgroup memory controller counts every byte. In one incident, I spent two days debugging an OOM kill that turned out to be zstd compression buffers growing unbounded during a traffic spike.
Memory-mapped files add another layer of confusion. When your application uses MappedByteBuffer or a library like RocksDB or Chronicle Queue does it for you, those pages count against RSS. They are invisible to JMX, invisible to NMT, and they can be hundreds of megabytes depending on your data volume.
The real danger is the combination. Netty adds 500 MB. gRPC adds 200 MB. Compression libraries add 100 MB. Thread stacks at 1 MB each across 300 threads add 300 MB. Code cache adds 240 MB. Each one seems manageable in isolation, but they stack silently until your 4 GB container is running at 3.9 GB RSS and the next allocation triggers the kill.
Why -Xmx Equal to Container Limit Is a Countdown Timer
This exact misconfiguration shows up in production constantly. Someone sets -Xmx4g on a container with a 4 GB memory limit and wonders why it gets killed within hours. The arithmetic is brutal and simple: if your heap can commit 4 GB, you have left exactly zero bytes for metaspace, thread stacks, code cache, compiled code, GC overhead, native buffers, and the JVM’s own internal data structures. The OOM kill is not a possibility. It is a guarantee.
JDK 10 introduced container awareness via JDK-8146115, and UseContainerSupport is enabled by default. This was a genuine improvement. The JVM now reads cgroup limits and sizes the heap accordingly, defaulting to 25% of container memory through MaxRAMPercentage. Note for JDK 8 users: this feature was backported in 8u191, so if you are on a recent JDK 8 build, you already have container awareness available. Many teams override MaxRAMPercentage to 70% or even 75%, which is aggressive but common in production. Here is the problem: container awareness only controls heap sizing. It does nothing to cap native memory growth. The JVM knows it lives in a container. It adjusts -Xmx accordingly. Then it proceeds to allocate native memory with no awareness of how close the total RSS is to the cgroup limit.
With MaxRAMPercentage=70 on a 4 GB container, your heap gets 2.8 GB. That leaves 1.2 GB for everything else. Sounds generous until you add it up: 300 threads at 1 MB each is 300 MB, metaspace grows to 150–250 MB in a typical Spring Boot app, code cache takes 240 MB by default, GC structures need 100–200 MB, and you have not even started counting Netty buffers or gRPC allocations. Every inbound gRPC connection, every compressed payload, every dynamically loaded class fills that 1.2 GB gap. There is no warning, no threshold alert, no GC pressure signal. The kernel just kills you when memory.current hits memory.max.
The JVM is container-aware for one decision and container-ignorant for everything else. That single decision — heap size — is the one your monitoring already tracks. The native memory that actually causes the kill remains invisible unless you go looking for it.
Making the Invisible Visible with NativeMemoryTracking
The JVM has a built-in tool that shows you exactly where every byte of native memory goes, and almost nobody uses it. It is called NativeMemoryTracking, and enabling it requires a single flag at startup:
-XX:NativeMemoryTracking=summaryOnce enabled, you can query the full memory breakdown at any time:
jcmd <PID> VM.native_memory summaryThe output splits memory into categories you will never see in your Grafana dashboards: Java Heap, Class (metaspace), Thread (stacks), Code (JIT compiled code cache), GC (garbage collector overhead), Compiler, Internal, Symbol, and Arena Chunk. Each line shows reserved and committed bytes. The first time I ran this on a production service, the total committed memory was 1.7x what our heap metrics reported. The gap was thread stacks (400 threads at 1 MB each), code cache at 240 MB, and metaspace at 180 MB. None of that showed up in any alert we had configured.
The overhead is real but manageable. Oracle documents it at 5–10% additional memory consumption for the tracking metadata itself, with negligible CPU impact. For a service already running at 70% of its container limit, that 5–10% matters — but it matters less than getting killed without understanding why. I enable NMT on all services by default. For teams that cannot accept the overhead across every pod, enable it on canary instances or a single replica per deployment. One instrumented pod is enough to establish a baseline.
The real power comes from diffing against a baseline. Run jcmd <PID> VM.native_memory baseline after startup, then later run jcmd <PID> VM.native_memory summary.diff. The output shows you exactly which categories grew and by how much. This is how you catch a metaspace leak from classloader churn or a thread stack leak from a pool that never shrinks. Most teams never enable NMT because they either do not know it exists or they assume the overhead is prohibitive. It is not. The cost of one unexpected OOM kill — the page, the investigation, the lost traffic — is orders of magnitude higher than 5% memory overhead on a canary.
The Diagnostic Script You Should Run Today
Here is a set of commands I run on every JVM container before I trust any dashboard. First, check how much physical memory the kernel attributes to your process:
PID=1
awk '/VmRSS/{print "RSS:", $2, "kB"}' /proc/$PID/status
Next, check what your JVM thinks it is using for heap:
jcmd $PID GC.heap_infoThen check how close you are to the cgroup kill threshold:
echo "CGroup usage: $(cat /sys/fs/cgroup/memory.current 2>/dev/null || cat /sys/fs/cgroup/memory/memory.usage_in_bytes)"
echo "CGroup limit: $(cat /sys/fs/cgroup/memory.max 2>/dev/null || cat /sys/fs/cgroup/memory/memory.limit_in_bytes)"
The difference between RSS and heap committed is your native memory footprint. If that gap is 40% of your container limit and growing, you have a problem that no heap alert will ever catch.
For ongoing monitoring, expose direct buffer usage through BufferPoolMXBean. Most JMX dashboards ignore this entirely:
ManagementFactory.getPlatformMXBeans(BufferPoolMXBean.class)
    .forEach(pool -> gauge("jvm.buffer." + pool.getName() + ".used", pool::getMemoryUsed));
This surfaces the direct and mapped pools that Netty, gRPC, and NIO allocate from. If you use Netty specifically, pull metrics from the allocator itself:
PooledByteBufAllocatorMetric m = PooledByteBufAllocator.DEFAULT.metric();
gauge("netty.direct.used", m::usedDirectMemory);
gauge("netty.heap.used", m::usedHeapMemory);
The pattern is simple: read memory.current and memory.max from your cgroup, subtract what your JVM reports as heap committed, and alert on the remainder. That remainder is your native memory budget. Treat it as a first-class metric with its own threshold and its own page. The gap is not a rounding error. It is the actual attack surface for silent container death.
The Container-Safe JVM Configuration
You cannot monitor your way out of a memory leak if the process has no cap on how much native memory it can consume. The fix is to constrain every major native memory region with explicit JVM flags, so that exceeding a budget throws a catchable error instead of triggering a kernel kill.
Here is the flag set I use as a starting point for containerized services:
java \
  -Xmx1536m \
  -Xms1536m \
  -XX:MaxMetaspaceSize=256m \
  -XX:ReservedCodeCacheSize=128m \
  -XX:MaxDirectMemorySize=256m \
  -Xss512k \
  -Dio.netty.maxDirectMemory=0 \
  -jar service.jar
This assumes a 2.5 GB container. The heap gets 1536 MB, roughly 60% of the limit. MaxMetaspaceSize at 256 MB is generous for most microservices. If your classloading is stable after warmup, you will never hit it, but if a library leaks classloaders, you get OutOfMemoryError: Metaspace in your logs instead of a silent restart. ReservedCodeCacheSize at 128 MB caps JIT-compiled code storage. I have never seen a typical service need more. MaxDirectMemorySize at 256 MB limits ByteBuffer.allocateDirect calls, and setting io.netty.maxDirectMemory=0 forces Netty to respect that cap instead of computing its own. Reducing thread stack size from the default 1 MB to 512 KB halves the per-thread cost. For a service running 200 threads, that is 100 MB saved.
The math: 1536 + 256 + 128 + 256 + ~100 (stacks) = ~2276 MB, leaving roughly 200 MB of headroom for the kernel, mapped files, and anything else. Tight, but predictable.
The counterargument is real: capping everything means you trade OOM kills for application-level OutOfMemoryErrors. Your service might start rejecting requests or crashing with a stack trace. But that crash is debuggable. It shows up in your logs, it triggers your alerting, and it tells you exactly which region ran out. A kernel OOM kill tells you nothing except that your container restarted. I will take a loud, diagnosable failure over a silent one every time.
One limitation worth knowing: MaxDirectMemorySize only governs allocations through the standard ByteBuffer API. JNI code that calls malloc directly bypasses it entirely. If you use native libraries heavily, these flags are necessary but not sufficient. You still need the cgroup monitoring from the previous section as your last line of defense.
The safe ratio of heap to container limit depends on your workload. Services with heavy Netty usage or large thread pools need more native headroom, so 50–60% heap is appropriate. Simpler services with few threads can push to 75%. Start at 60%, measure your actual native memory consumption with NMT, and adjust from there.
What These Flags Do Not Solve
I hear the objection already: “Just set MaxDirectMemorySize and you have capped native memory.” Partially true. That flag controls ByteBuffer.allocateDirect calls, which covers Netty and most gRPC buffers. It does not touch a single byte allocated by JNI libraries. If your service uses snappy for compression, zstd for log shipping, RocksDB for local state, or OpenSSL through Conscrypt, those libraries call malloc directly from C code. The JVM has no flag to limit them because it does not know they exist.
Memory-mapped files are the other blind spot. Any library that calls mmap — and many do for file I/O optimization — adds pages that count against your cgroup’s RSS. No JVM flag controls this. You will not see it in NMT output either, because the kernel accounts it separately from the process heap.
“What about GraalVM native images?” They reduce the problem by eliminating the JIT compiler, code cache, and most of the class metadata overhead. But if your native image still calls into a C library through JNI or uses memory-mapped files, you have the same blind spots with a smaller baseline. Reduced is not eliminated.
Modern GCs add another wrinkle. ZGC and Shenandoah can uncommit unused heap pages back to the OS, which means your RSS fluctuates based on GC activity. This is generally good — you use less physical memory during low load. But it makes capacity planning harder because your RSS is no longer a stable number you can reason about statically.
The honest answer is that no combination of JVM flags gives you complete control. You need both: flags to cap what the JVM manages, and container-level monitoring to catch what it does not. Overprovisioning your container limit by 20–30% beyond your calculated maximum is not waste. It is insurance against the allocations you cannot see and cannot cap. At scale this costs money, yes. But it costs less than 3 AM pages from OOM kills you cannot explain.
The Mental Model That Prevents the Next OOM Kill
Here is the mental model I use now: your container memory limit is a fixed budget, and heap is just one line item. Not the budget itself. Every byte of thread stacks, metaspace, code cache, direct buffers, GC overhead, and JNI allocations competes for the same cgroup limit. If you think of -Xmx as “the memory my app uses” and everything else as rounding error, you will get OOM killed. It is not a question of if.
The priority order for fixing this in an existing service:
- First, enable NMT on one replica and run the diagnostic commands from section 07. You cannot fix what you cannot measure, and this takes five minutes.
- Second, cap the regions you can control: MaxMetaspaceSize, ReservedCodeCacheSize, MaxDirectMemorySize, and -Xss. This converts silent kills into loud, debuggable errors.
- Third, add cgroup-level monitoring. Alert on memory.current / memory.max crossing 85%. This is your last line of defense against JNI and mmap allocations that no JVM flag can cap.
- Fourth, when the next OOM kill happens — and it will — do not bump the limit. Run the diagnostic, find the consumer, and either cap it or budget for it explicitly.
The complete flags for a typical 2 GB container:
java -Xmx1024m -Xms1024m \
  -XX:MaxMetaspaceSize=256m \
  -XX:ReservedCodeCacheSize=128m \
  -XX:MaxDirectMemorySize=256m \
  -Xss512k \
  -XX:+UseContainerSupport \
  -XX:NativeMemoryTracking=summary \
  -jar app.jar
That accounts for roughly 1.7 GB, leaving 300 MB of headroom for the allocations you cannot cap. Not generous, but survivable. If you are only watching heap metrics and GC pauses, you are flying blind to the memory that actually kills your containers.
메타데이터
- post_id
- 346f08f421c8
- slug
- the-linux-oom-killer-scored-your-jvm-at-999-and-you-never-knew-how-to-stop-losing-containers-to-346f08f421c8
- url
- https://medium.com/@yalovoy/the-linux-oom-killer-scored-your-jvm-at-999-and-you-never-knew-how-to-stop-losing-containers-to-346f08f421c8
- canonical_url
- https://medium.com/@yalovoy/the-linux-oom-killer-scored-your-jvm-at-999-and-you-never-knew-how-to-stop-losing-containers-to-346f08f421c8
- author_url
- https://medium.com/@yalovoy
- status
- ok
- fetched_at
- 2026-06-16 19:09:56