Two Clocks, One Training Step: How TraceML Measures PyTorch Performance
A time.perf_counter() bracket and a CUDA event pair can disagree wildly about the same forward pass. Neither is wrong: they answer…
Two Clocks, One Training Step: How TraceML Measures PyTorch Performance
A time.perf_counter() bracket and a CUDA event pair can disagree wildly about the same forward pass. Neither is wrong: they answer different questions. This post is about the two questions, how mixing their answers corrupts a diagnosis, and the contract TraceML uses to keep them straight.
In the last post we sent three tools after the same input-bound ResNet run, and we were careful about one particular phrase: “all the numbers above are wall-clock measurements.” This post is about why that phrase had to be there.
Start with the obvious experiment. Bracket a forward pass with Python’s clock:
t0 = time.perf_counter()
out = model(x)
t1 = time.perf_counter()
print(f"forward: {(t1 - t0) * 1000:.1f} ms")
On a GPU, the number this prints is suspiciously small. Insert torch.cuda.synchronize() before the second reading and the printed time grows. The model did not change. The data did not change. You measured two different things: the time to enqueue the forward pass, and the time for its GPU work to complete.
The waiter and the kitchen
By default, GPU work in PyTorch is asynchronous. model(x) does not wait for your kernels to finish; it orders them. Python walks the layers, enqueues kernel after kernel onto the CUDA stream, and returns as soon as the last one is queued, usually long before the GPU has finished the actual math. The PyTorch documentation states it plainly: operations are "enqueued to the particular device, but not necessarily executed until later."
So picture the CPU as a waiter and the GPU as the kitchen. time.perf_counter() is the waiter's wristwatch. Bracket model(x) with it and you learn how long it took to write the ticket and hand it through the pass. The cooking time, the number your GPU bill actually tracks, accumulates on a different clock in a different room. When a utilization dashboard says the GPU is busy for most of the step while your timer insists the forward pass is nearly free, both are honest. The waiter really did spend almost no time at the table.
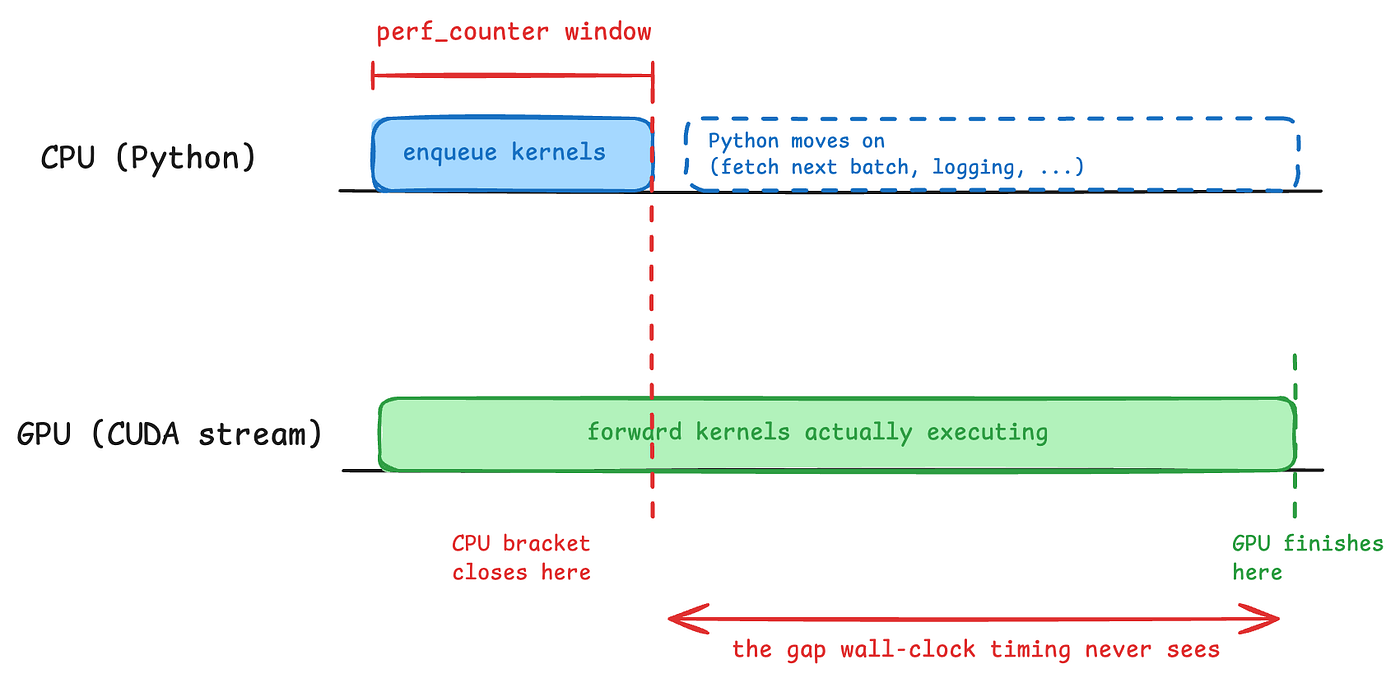
Figure 1. The two clocks. A wall-clock bracket around model(x) closes when the kernels are enqueued. The kernels finish later, on the GPU's own time, in a gap the bracket never sees.
The obvious fix cooks a different meal
The textbook remedy forces the clocks together: call torch.cuda.synchronize(), read the wall clock, run the phase, synchronize again, read again. The PyTorch docs offer exactly this option. The measurement becomes accurate. But when repeated around every phase, the run becomes a different run.
synchronize() makes the CPU stand at the pass until the kitchen has cleared every order. That is a stall, inserted on purpose, into a pipeline whose entire performance model is overlap: while the GPU executes step N, the CPU should be fetching batch N+1, queueing kernels ahead, keeping every lane full. Bracket each phase with syncs and the overlap is gone. You get precise timings of a training loop that no longer behaves like your real one.
This is why hand-rolled timing produces results that disagree with each other. It fails in one of two directions. Async-blind timing (no syncs) reports kernel-launch costs as if they were compute, and silently attributes the pending GPU work to whatever operation happens to block next, often the innocent loss.item(). Sync-distorted timing reports accurate numbers about a serialized run that is no longer the one you pay for. Both produce tables that look plausible; neither describes your training job.
Ask the GPU what time it is
The second option in the docs is the interesting one. A CUDA event is a marker you drop into the device’s queue: event.record() enqueues it on the stream, and the GPU stamps it as execution passes that point. Record one event before a phase and one after, and the elapsed time between the stamps is the device-side duration of everything in between, measured by the GPU's own clock, with the waiter free to walk away.
The pattern in plain PyTorch:
start = torch.cuda.Event(enable_timing=True)
end = torch.cuda.Event(enable_timing=True)
start.record()
out = model(x)
end.record()
# ... later, once the GPU has passed both markers:
ms = start.elapsed_time(end)
The catch sits in that “later”. The stamps are not readable until the GPU has actually passed them, and blocking on them would reintroduce the stall we just rejected. TraceML’s answer is to record now and read later. Every instrumented phase gets a CPU wall-clock bracket and a pair of pooled CUDA events; the training thread records the markers and moves on. A background sampler thread polls the events with non-blocking query() on its own schedule, computes the elapsed time only for pairs the GPU has finished, and retries the rest on its next tick. TraceML does not call torch.cuda.synchronize() in the measured training path: training does not wait merely to be measured.

Figure 2. Events ride the stream. The training thread drops markers and never waits; a background thread reads the stamps once the GPU has passed them. TraceML does not synchronize the measured training path.
One step, two honest clocks
Here is the part that takes longest to get right, and the reason this post is not titled “always use CUDA events”.
Some phases of a training step are not GPU work. The dataloader’s next() is host-side Python: worker queues, decoding, collation, pinning. Its honest cost is CPU wall time. But the number that decides a diagnosis is a different one: GPU-visible input wait, how long the device actually sat idle for lack of a batch. In a healthy pipeline the two diverge on purpose. The CPU spends real time fetching batch N+1 while the GPU is still busy with step N, so fetch cost is high and input wait is near zero. Same phase, two questions, two clocks, both legitimate.
Now put them in one table. Time the dataloader on the host clock, forward and backward on the device clock, and divide everything by step time to get percentages. The rows come from clocks that do not measure the same span, so the shares need not sum to anything meaningful, and overlapped fetch time gets charged as if the GPU had waited for it. The result is a table in which every row is a real measurement and the verdict is still wrong: a run whose GPU never starved can be pronounced input-bound. The lie is not in the numbers. It is in the join.
TraceML’s contract, standardized across the live terminal view, the dashboard, the final summary, and traceml compare in the 0.3.6 cycle, is three rules:
One clock per window: every analysis window selects a single clock. GPU when every rank and every step in the window has complete GPU coverage; otherwise CPU. Every phase share puts numerator and denominator on that one clock, and the report labels which clock it selected.
Null is not zero: a phase that was never measured reports
null, not0.0. A measured H2D of 0.0 means "we looked, and nothing was there";nullmeans "we could not know". The two render differently, and only one of them may feed a verdict.
Compare on a common clock: comparing two runs picks a clock both runs actually measured, and reports an explicit inconclusive result when there is none. A CPU duration is never diffed against a GPU duration.
Underneath, nothing is discarded: the summary publishes both aggregates side by side (step_time_cpu_ms and step_time_gpu_ms, and likewise for the traced envelope), so the raw evidence for either question survives into the artifact.

Figure 3. The join is the bug. Left: phases timed on different clocks feeding one percentage column. Right: the contract, one selected clock per analysis window, with unmeasured phases reported as null rather than fabricated zeros.
What it costs, and what it does not catch
The instrumentation cost stays deliberately small. Events are lightweight markers, pooled and reused rather than allocated per phase, and resolution is a background poll rather than a stall. The larger price is honesty in the report. On a CPU-only machine every number is wall clock, and the report says so. When GPU coverage is incomplete for a window, the whole window falls back to the CPU clock and says that too, rather than quietly blending the clocks it has. And one limit named outright: TraceML does not yet time collectives separately, so communication is not reported as an isolated phase.
Earlier versions of TraceML mixed clocks within a single table, exactly the failure mode described above. The fix required no better clock: we stopped joining the two we already had.
What’s next
Coming next: the input-bound experiment at multi-GPU scale: several ranks, one slow input pipeline, and why every rank pays for the slowest one. The one-clock rule is what makes a straggler visible as a straggler, instead of a smear across phases.
Try it:
pip install traceml-ai
traceml run train.py
Repo: github.com/traceopt-ai/traceml.
If TraceML helps you understand a slow training run, star the repository — it helps more PyTorch users discover the project.
If your team runs multi-GPU PyTorch training and is dealing with unexplained slowdowns or rank stragglers, we are also looking for design partners to test TraceML on one real workload.
If the two-clock problem is biting a run you care about, an issue with your final_summary.json attached is a welcome bug report. Issues, PRs, and traces welcome at the repo above.
메타데이터
- post_id
- 357bc8e28dc7
- slug
- two-clocks-one-training-step-how-traceml-measures-pytorch-performance-357bc8e28dc7
- url
- https://medium.com/traceopt/two-clocks-one-training-step-how-traceml-measures-pytorch-performance-357bc8e28dc7
- canonical_url
- https://medium.com/traceopt/two-clocks-one-training-step-how-traceml-measures-pytorch-performance-357bc8e28dc7
- author_url
- https://medium.com/@apendyala
- status
- ok
- fetched_at
- 2026-08-06 16:46:06