Daily Dose of Chart : 02 Nov 2025
$SFM: Approaching last phase of Eliot Correction pattern
Daily Dose of Chart : 02 Nov 2025
$SFM: Approaching last phase of Eliot Correction pattern
I have seldom written about one of my favorite stocks within the retails sector. $SFM has been a great momentum stock but on Aug 12th I highlighted that the stock is loosing momentum.
Since my last blog when the RSI was above 40, the stock has lost 50% of the value. Crrently the RSI is @ 20 and forming a double bottom on the charts. With such heavy correction on such a momentum stock it makes sense to look at the Eliot correction wave. Usually the 3rd wave is the longest in such corrective patterns. With the stock hovering around 75 $ it has almost corrected 60 %. The 0.618 Fib retracement level from the 52 week high is at 70 $. $SFM has usually outperformed the $XRT and $SPY over the last 5 years and still holding its outperformance.
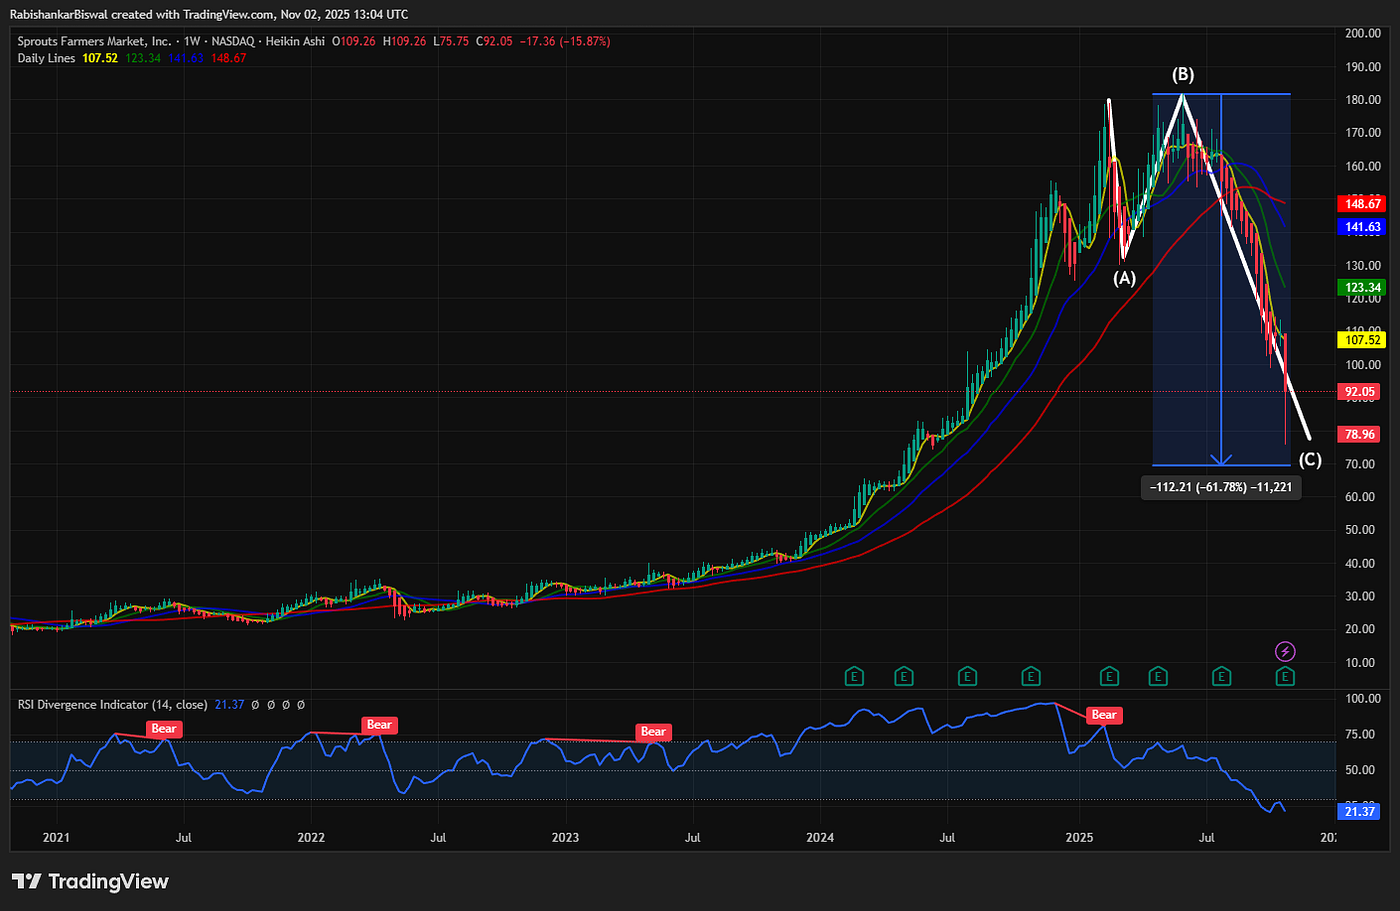
$SFM nearing a buy point
Please subscribe to get such amazing charts.
If you like the analysis, then you can show your love and support @ Buy Me a Coffee
Please follow me at Linkedin, Facebook , BlueSky and X .
Join the Teams Community here.
Telegram : https://t.me/+MJ4cA-kOaY03NDNl
메타데이터
- post_id
- 35cbdae2e20a
- slug
- daily-dose-of-chart-02-nov-2025-35cbdae2e20a
- url
- https://medium.com/@dailydoseofchart/daily-dose-of-chart-02-nov-2025-35cbdae2e20a
- canonical_url
- https://medium.com/@dailydoseofchart/daily-dose-of-chart-02-nov-2025-35cbdae2e20a
- author_url
- https://medium.com/@dailydoseofchart
- status
- ok
- fetched_at
- 2026-06-16 19:09:56