The Friday Deployment Dilemma: How We Tamed Our Microservice Chaos
It was 4:45 PM on a Friday. The engineering team was wrapping up a productive week, and our latest feature deployment was officially live…
The Friday Deployment Dilemma: How We Tamed Our Microservice Chaos
By Sanika Patil
Artificial Intelligence and Data Science Student
July 12, 2026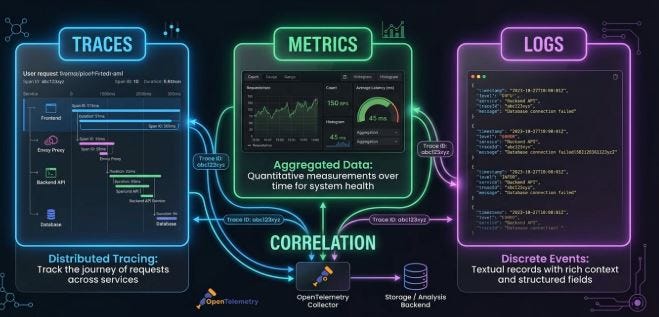
It was 4:45 PM on a Friday. The engineering team was wrapping up a productive week, and our latest feature deployment was officially live. Then, the Slack alerts started firing. Our API response times were spiking past 8 seconds. Users were abandoning their shopping carts, and our customer support queue was growing by the minute. For a fast-growing tech platform, this was the worst-case scenario. We were facing a classic modern engineering crisis: a performance bottleneck hidden deep within a complex web of microservices. The Chaos of the Fragmented Dashboard Our team rushed into a virtual war room. We quickly ran into the classic developer roadblock: the tool-switching tax. We had an assembly line of different monitoring interfaces open across our monitors: Our metrics tool showed a massive spike in general latency, but couldn’t explain why.
Our log aggregation tool was flooded with millions of rows of text, making it impossible to isolate the exact error.
Our separate tracing tool showed that requests were getting stuck somewhere in the backend network, but gave no context on the machine’s state.
We were losing valuable time copying trace IDs, hopping between browser tabs, and trying to align timestamps manually. While we were context-switching, our application was still down. Transitioning to a Single Pane of Glass That evening, after patching the system, we realized our monitoring approach had to change. We needed a unified solution that brought metrics, logs, and traces into a single workspace. That is when we migrated our application observability to SigNoz. SigNoz is an open-source Application Performance Monitoring (APM) platform built specifically to eliminate this exact fragmentation. Instead of relying on proprietary data collection, it uses OpenTelemetry (OTel) as its native standard. What is OpenTelemetry? OpenTelemetry is an industry-standard framework that acts as a universal translator for software performance. By instrumenting our applications with OpenTelemetry, we can collect metrics, logs, and traces using a single agent, entirely preventing vendor lock-in.
Resolution: Solving a Crisis in Three Clicks Two weeks later, another sudden slowdown struck our payment service. This time, our troubleshooting workflow was completely transformed. Click 1: Spotting the RED Metrics We opened the SigNoz dashboard and looked at our service overview. SigNoz automatically charts the essential RED Metrics (Rate, Errors, and Duration). Within seconds, we spotted a sharp latency spike on our /checkout endpoint. Click 2: Analyzing the Distributed Trace Instead of opening a new tool, we clicked directly on the latency spike within the chart. SigNoz instantly filtered the data to show the specific Distributed Traces capturing that exact timeframe. We clicked the slowest trace to open a visual flamegraph, mapping the entire journey of the user’s request across our services. [API Gateway: /checkout] ──────────────────────────────────────────► (6100ms) ├── [Auth Service: check_session] ──► (40ms) └── [Payment Service: charge_card] ───────────────────────────► (6020ms) ⚠️
The flamegraph clearly demonstrated that our API gateway was waiting over 6 seconds for a response from the Payment Service. Click 3: Accessing Correlated Logs In the past, this is where we would have jumped to a separate logging panel. Instead, we simply clicked directly on the elongated payment service bar within the flamegraph. A panel slid open on the right side of the screen, automatically displaying the exact log entries generated by that specific container during that precise microsecond. Right there on the screen, the root cause was exposed: Database Connection Timeout: Max pool size of 20 reached for database ‘db-prod-1’. Our database connection pool was too small to handle peak traffic. We adjusted the pool configuration, deployed the update, and watched the latency metrics immediately drop back to normal. The entire investigation took under three minutes. The Technology Making It Possible: ClickHouse The real engine behind SigNoz’s speed and efficiency is its underlying storage architecture, powered by ClickHouse. Traditional log setups often rely on text-search systems like Elasticsearch, which demand massive amounts of memory and disk space. SigNoz takes a different path by storing telemetry data in ClickHouse, a highly optimized, column-oriented database system. By grouping data by columns rather than rows, it allows queries to scan only the necessary data fields, accelerating search times while compressing text data heavily. For our team, this translated to lightning-fast log searches and a massive reduction in our cloud storage costs. Moving Forward Observability shouldn’t feel like a puzzle where you have to piece the clues together yourself. By unifying metrics, logs, and traces into a single workflow powered by OpenTelemetry and ClickHouse, SigNoz shifted our engineering culture from reactive firefighting to clear, data-driven debugging.
메타데이터
- post_id
- 37c8ea633c94
- slug
- the-friday-deployment-dilemma-how-we-tamed-our-microservice-chaos-37c8ea633c94
- url
- https://medium.com/@patil2006sanika/the-friday-deployment-dilemma-how-we-tamed-our-microservice-chaos-37c8ea633c94
- canonical_url
- https://medium.com/@patil2006sanika/the-friday-deployment-dilemma-how-we-tamed-our-microservice-chaos-37c8ea633c94
- author_url
- https://medium.com/@patil2006sanika
- status
- ok
- fetched_at
- 2026-07-14 04:02:57



