The Most Dangerous Misconceptions About Gamma Exposure (And Why Most Traders Get GEX Wrong)
One of the most misleading ideas in the GEX space is the belief that with the “right” data — special feeds, flow dashboards, or so-called…
The Most Dangerous Misconceptions About Gamma Exposure (And Why Most Traders Get GEX Wrong)
In the previous part of this series, we covered the core concepts needed to understand Gamma Exposure (GEX) and how dealer hedging shapes market structure. Before moving into practical application, however, it’s critical to clear up a few of the most common misconceptions that surround GEX.
One of the most misleading ideas in the GEX space is the belief that with the “right” data — special feeds, flow dashboards, or so-called institutional sources — you can precisely predict what must happen at a specific level.
That belief is deeply misleading.
Even market makers don’t know in advance where the price will go. If they did, it wouldn’t be trading — it would be outright market manipulation.
What dealers actually know is something far more limited and far more mechanical: how they need to hedge right now, based on current exposure and incoming order flow.
And even that answer is only valid for the current moment.
There is no real-time visibility into full dealer inventory — meaning the complete picture that includes underlying exposure, hedging instruments, and the entire options book in real time.
You may see parts of the options inventory with a delay (for example, SPX options via CBOE feeds with ~15-minute latency), but to the best of our knowledge, there is no publicly available way to observe full dealer inventory and hedges in real time.
Claims of complete real-time visibility should be treated with skepticism, because key parts of dealer inventory and hedging are not observable in real time.
On top of that, second-order effects like charm and vanna are evolving continuously intraday, dynamically reshaping exposure even while price is still forming on the chart.
So not only do you not know what happens next — even the dealer doesn’t. Surprised? That uncertainty is exactly how real markets actually work!
This distinction is critical to understand.
GEX was never meant to be a crystal ball. It was designed to describe market structure, not destiny.
And misunderstanding this single point is where most retail traders go wrong.
That’s exactly why it’s worth breaking down the most common misconceptions around GEX levels — many of which you’ve likely already encountered across various trading channels, dashboards, or social media takes.
🔶GEX vs. Traditional Technical Indicators
Technical indicators:
- analyze old data
- smooth price
- look for historical patterns
They all describe what has already happened.
GEX Profile:
- highlights present tense positioning
- levels that are not obvious from price alone
- identifies pressure zones created by dealer hedging
- shows where the market microstructure itself shifts character
So while charts tell you what happened, GEX tells you where mechanics may become more influential if price arrives there.

Technical indicators vs. GEX
Instead of asking “what did price do before?”, GEX asks a different question: “Where might market mechanics react more aggressively if price arrives here?”
This is a fundamentally different type of insight.
🔶Why More Traders Are Using GEX
Because the modern market — especially post-0DTE — is heavily shaped by dealer hedging mechanics, not by classical chart patterns.
And GEX can help visualize that structural layer.
It shows:
- where hedging sensitivity may increase,
- where volatility conditions can change character,
- where price reactions can become more pronounced.
It is not a signal. It is not a buy/sell indicator.
GEX is a structural map — the missing context behind price action.
And that context is what transforms randomness into pattern and noise into a navigable landscape. But to use that map properly, one more concept must be introduced.
That concept is Delta Exposure.
🔶DEX (Delta Exposure): The Missing Piece
If GEX is the map, DEX is the fuel gauge.

DEX — Delta Exposure — describes the directional sensitivity embedded in the options market at specific price levels.
Importantly, DEX does not show dealer positioning. It shows where delta exposure is concentrated — not who holds it.
This distinction matters.
Market makers do not profit from directional bets. Their business model is to stay as close to delta-neutral as possible. So when price moves into areas where delta exposure becomes unbalanced, dealers may need to adjust their hedging.
That is where DEX becomes useful.
Because positioning is not directly observable, the scenarios below are simplified and assumption-based, and should be treated as conditional frameworks rather than statements of fact.
🟢 Positive DEX
Positive DEX means that at a given strike (or strike cluster), call delta × call open interest dominates over put delta × put open interest. In other words, the local delta exposure around that price level is skewed toward calls.
Importantly, this does not reveal actual dealer positioning. DEX only describes where delta exposure is concentrated in the options market at that strike, not who holds it.
For index products like SPX, where retail participants are structurally more likely to be short calls and long puts, a positive DEX level implies (by assumption) that dealers are more likely on the opposite side — typically long calls at that strike.
As price rises into such a zone, dealer delta increases, often leading to delta-reducing hedges (selling underlying), which can contribute to stabilizing flows around call-heavy strikes.
🔴 Negative DEX
Negative DEX means that at a given strike (or strike cluster), put delta × put open interest dominates over the call side — meaning the local delta exposure at that level is skewed toward puts.
Again, this does not directly show dealer positioning. However, under the same SPX assumption (retail predominantly long puts), a negative DEX level implies that dealers are more likely short puts at that strike, which actually results in positive delta exposure.
This is a critical nuance: Negative DEX at a strike does not imply dealers are short delta there.
If price starts falling through such a level, dealer delta can decrease, often leading to incremental sell-side hedging, which can contribute to downside momentum under certain conditions, especially in negative GEX environments, where price is no longer stabilized by gamma.
Look at the simplified chart for Delta changes around ATM:

DEX Call (green) and DEX Put (red) curves represent delta exposure.
On TradingView, relevant GEX Profile indicators have been available for some time, including versions with automatic intraday updates. These tools do a solid job visualizing gamma-related structure.
DEX, however, is typically not included — and for good reason. Delta exposure can shift extremely fast and directionally as price moves through strikes and options flip ITM/OTM. That makes DEX far more unstable and context-dependent than GEX, especially in 0DTE or fast intraday environments.
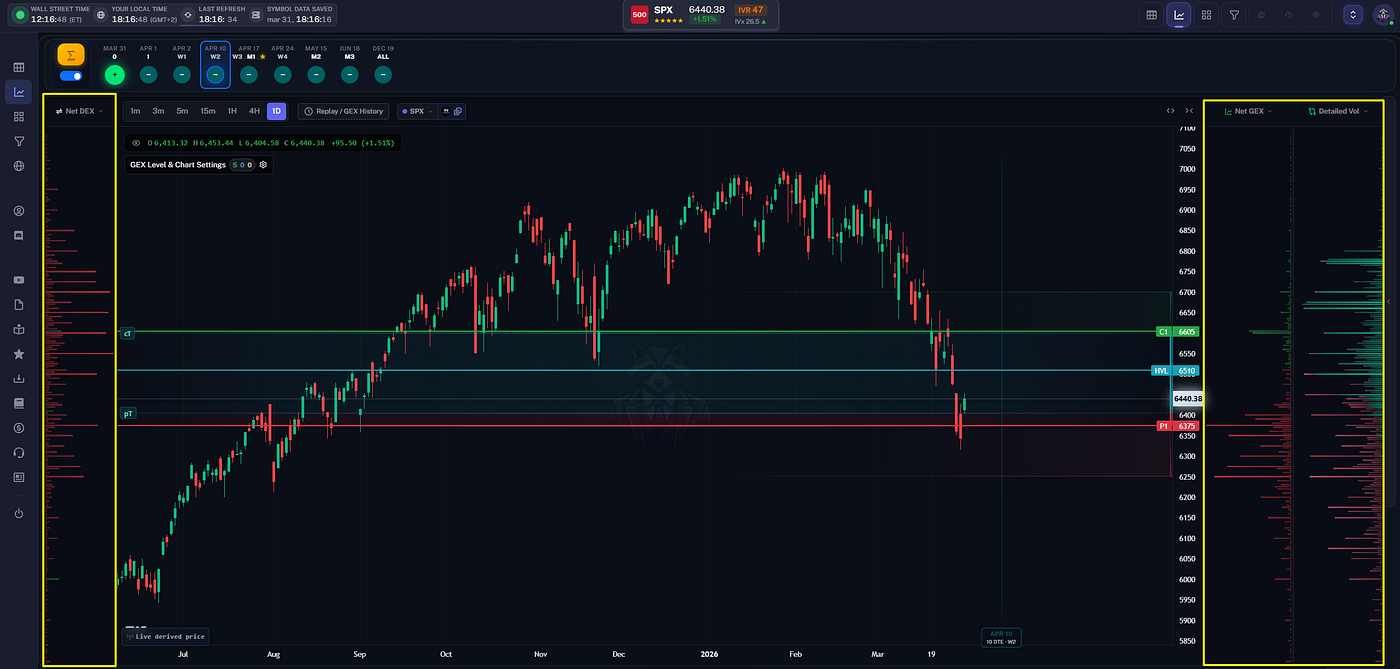
If you want to visualize this layer more clearly, TanukiTrade GEX Live displays it alongside the GEX profile. These visualizations are educational and do not provide trading signals or recommendations.

0DTE SPX GEX / DEX Live view on TanukiTrade Webapp
🔶What DEX Actually Adds to GEX
GEX highlights where hedging sensitivity is elevated — areas where reactions can become more meaningful if price trades into them. DEX adds information about hedging pressure dynamics if price arrives there.
Together:
- GEX defines the volatility regime and reaction zones,
- DEX provides a directional sensitivity context not a prediction. It’s still conditional on flow and price action.
And this is the key takeaway: dealers are typically reactive participants: they hedge and rebalance in response to price and order flow.
Their reaction, however, can amplify short-term moves which is exactly why understanding DEX alongside GEX matters. But even with both tools combined, nothing is guaranteed.
Which brings us to the most common mistakes traders make when interpreting GEX.
🔶How We Actually Use GEX
Zones → Scenarios → Momentum Confirmation
Before going any further, it’s important to clarify how GEX is meant to be used in practice. Not as a signal. Not as a prediction tool. And not as a mechanical trading rule set.
At TanukiTrade, GEX functions as a structural context layer. It helps us organize attention, define scenarios, and interpret price behavior — nothing more, nothing less.
Over time, this crystallized into a very simple operating framework:
Zones → Scenarios → Momentum Confirmation
Everything that follows in this article builds on this sequence.
GEX Levels Define Zones of Interest
The first step is understanding what GEX levels represent.
GEX highlights areas of potential structural importance, where dealer hedging sensitivity may increase and market behavior can change character.
These areas are best thought of as zones, not precise price points.
Their role is not to dictate action, but to answer a much simpler question:
“Where should I be paying attention?”
GEX helps narrow the market down to a small number of locations where reaction becomes possible — not guaranteed.
From Zones to Scenarios
Once price approaches a GEX zone, the next step is not execution — it is scenario building.
At this stage, we are not choosing direction. We are mapping possibilities.
Typical questions at this point are:
- Does the market slow down or speed up?
- Is price accepted in the area or rejected from it?
- Does volatility compress or expand?
- Does liquidity appear or disappear?
GEX provides the structural backdrop against which these scenarios can unfold, but it does not decide which one will occur.
That decision emerges only through market behavior.
Momentum Is the Final Filter
The final step is confirmation.
Price action and volume behavior determine which scenario is actually activating.
Momentum is what transforms structure into decision. Only after this confirmation do we evaluate potential scenarios and risk parameters.
Without this final step, GEX remains incomplete — it describes context, but not action.

The Role of This Framework
This operating sequence is intentional.
It forces patience. It delays commitment. And it keeps structure separate from execution.
GEX tells us where and how to observe. Price action and momentum determine which scenario is actually activating.
With this framework in place, we can now address why GEX is so often misunderstood — and how many common assumptions fail once this usage model is applied.
1️⃣GEX Myth #1:
“If Price Hits Call Resistance, It Must Reject”
This is one of the most common and most dangerous misunderstandings in the entire GEX ecosystem.
Many traders see a call-heavy GEX level (often labeled as call resistance) and immediately assume:
“Price will reject here. This is a short.”
That assumption feels intuitive. It also feels logical. And very often — it’s wrong.
Where This Misconception Comes From
The mistake starts with treating GEX levels as static barriers, rather than dynamic reaction zones. A call-heavy area can act as resistance. But it can just as easily become a launchpad.
The difference is not the level itself the difference is who holds the options and how dealers are forced to hedge once price interacts with that zone.
Call Resistance Is Not a Directional Signal
A call resistance level only tells you one thing with confidence:
This is an area where dealer hedging sensitivity is elevated.
That’s it.
What happens next depends entirely on flow and positioning, not on the label “call resistance.” There are two very different structural scenarios that can unfold at the exact same level.
Scenario A: Index Products (e.g. SPX)
In index products like SPX, the structural assumption is usually:
- Retail is short calls
- Dealers are long calls
- Dealers are therefore long gamma
In this setup, when price rises into a call-heavy zone:
- dealer delta increases,
- dealers may hedge delta (often via the underlying or futures) to move back toward neutral,
- upward momentum often slows or stalls.
Here, call resistance can behave like resistance but only because dealer hedging is working against the move.
Even then, it’s not automatic. It still requires confirmation.
Scenario B: Single Stocks (e.g. TSLA, NVDA, meme-era GME)
In many single equities — especially high-beta or retail-driven names — the structure can be the exact opposite:
- Retail is long calls
- Dealers are short calls
- Dealers are therefore short gamma
In this case, when price rises into a call-heavy zone:
- dealer delta increases,
- dealers may need to buy underlying to hedge,
- buying pressure accelerates the move.
This is one common pathway through which a call-heavy zone can evolve into a gamma-squeeze dynamic. Same level. Same label. Completely different outcome.
AMZN — Call resistance ≠ automatic rejection
When AMZN broke above the $240 call resistance, price didn’t reject — momentum accelerated and price quickly moved toward $250.
Later, $250 became the new call resistance, while $240 turned into a reference zone.

AMZN GEX for 12/15/2028 expiration using TanukiTrade Options Overlay GRID System and the GEX Profile indicator
Why This Matters
If you treat call resistance as an automatic short signal, you will:
- fade breakouts that are structurally supported,
- short into dealer hedging demand,
- and get run over by momentum you didn’t expect.
This is exactly why we say:
We don’t trade the level — we trade the reaction.
The level tells you where to look. The market tells you what to do.
The Correct Mental Model
A call-heavy GEX zone answers this question:
“If price comes here, dealer hedging behavior may change.”
It does not answer:
- whether price will reject,
- whether price will break,
- or which direction to trade.
That decision only emerges after price arrives and momentum reveals itself.
2️⃣GEX Myth #2
“If Price Hits Put Support, It Must Bounce”
This misconception is the mirror image of the previous one and it’s just as dangerous. Many traders see a put-heavy GEX level (often labeled as put support) and immediately assume:
“This is support. This is a long.”
Sometimes that works. Sometimes it works beautifully. And sometimes it accelerates price straight through the level. The mistake is the same as before: treating a structural zone as a directional guarantee.
What a Put Support Level Actually Means
A put-heavy GEX zone tells you only this:
Downside dealer hedging sensitivity increases around this area.
It does not tell you whether that sensitivity will:
- absorb selling, or
- amplify selling.
That depends entirely on who is holding the puts and how dealers are positioned.
Scenario A: Index Products (e.g. SPX)
In indices like SPX, the typical structural assumption is:
- Retail and institutions are long puts
- Dealers are short puts
- Dealers therefore carry short gamma on the downside
In this case, when price falls into a put-heavy zone:
- dealer delta decreases,
- dealers may need to sell underlying to hedge,
- selling pressure can accelerate the downside.
Here, put “support” is not support at all. It can act as an air pocket.
This is why index sell-offs often feel fast, mechanical, and relentless once key downside zones break.
Scenario B: Single Stocks (Retail Short Put Environment)
In many single equities — especially during calmer market regimes — the structure can flip:
- Retail sells puts for income
- Dealers are long puts
- Dealers therefore carry long gamma on the downside
In this case, when price falls into a put-heavy zone:
- dealer delta decreases,
- dealers may hedge by buying delta (often via the underlying or futures) to move back toward neutral,
- buying pressure can stabilize price and trigger a bounce.
Same label. Same GEX profile. Completely different hedging behavior.
The chart below illustrates how the $145 put support level acted as a strong stabilization zone for BABA.

BABA GEX for 01/21/2028 expiration using TanukiTrade Options Overlay GRID System and the GEX Profile indicator
Why “Put Support = Long” Is a Trap
If you blindly assume every put-heavy level is a bounce point, you will:
- catch falling knives in short-gamma environments,
- fight dealer hedging flow instead of aligning with it,
- and misinterpret momentum as “fake” when it is structurally reinforced.
This is especially dangerous in negative GEX regimes, where downside moves are already prone to acceleration.
The Proper Way to Use Put Support Levels
A put-heavy GEX zone tells you:
“This is a place where the market must react.”
It does not tell you:
- how it will react,
- which side will win,
- or how strong the move will be.
That information only comes from:
- price action,
- volume behavior,
- and momentum through the level.
Put support is not a trade. It is a question the market must answer.
3️⃣GEX Myth #3
“If the GEX Profile Is Positive, You Should Be Long”
This misconception is subtler than the previous two and that’s exactly why it’s so persistent. Many traders see a green / positive GEX profile and immediately translate it into:
“The market is bullish.”
Or worse:
“Positive GEX = automatic long bias.”
What Positive GEX Actually Describes
A positive GEX profile tells you one thing:
Dealers are likely operating in a net long-gamma environment.
That statement has nothing to do with direction. It describes how volatility behaves, not where price is supposed to go.
In a positive GEX regime:
- downside moves tend to get bought,
- upside moves tend to get sold,
- volatility is naturally dampened.
This creates a grinding, mean-reverting market. But a grinding market is not the same as a bullish market.
The Real Risk of This Misconception
If you treat positive GEX as a long signal, you will:
- chase upside that lacks follow-through,
- get chopped up in range-bound conditions,
- overpay for directional exposure in low-vol regimes.
Positive GEX Is a Volatility Regime, Not a Bias
The correct interpretation is simple:
- Positive GEX → volatility is suppressed
- Negative GEX → volatility is amplified
That’s it.
Direction still needs to be earned — through price behavior, momentum, and context.
This is why we say:
GEX tells you the type of game you’re playing — not which team to bet on.
4️⃣GEX Myth #4
“Below HVL Means Automatic Breakdown”
📌 Before going further, one quick clarification.
HVL (High Volatility Level) is a structural reference point on the GEX Profile that separates two different volatility regimes:
- Above HVL: dealer hedging tends to suppress volatility
- Below HVL: volatility is allowed to expand
This misconception usually appears right after traders start using GEX levels more actively. Price drops below HVL (High Volatility Level) and the immediate conclusion is often:
“We’re below HVL — this must be a short.”
That assumption is wrong.
HVL is not a directional trigger
HVL marks a structural regime shift from volatility suppression to volatility expansion potential. That’s it.

Crossing HVL does not tell you:
- that price must go lower,
- that a trend must start,
- or that downside continuation is guaranteed.
It only tells you that dealer hedging behavior may change, and with it, the character of price movement. What it tells you is simpler — and more important.
Below HVL, dealer hedging no longer suppresses volatility.
When price moves below HVL:
- gamma stabilization weakens,
- price becomes more sensitive to order flow,
- moves can extend faster if momentum appears.
But “can” is not “will”.
Below HVL, the market becomes more reactive, more fragile, more momentum-dependent. Direction is still undecided.
The Correct Interpretation
The correct mental model is:
- Above HVL → volatility tends to be dampened
- Below HVL → volatility is allowed to expand
Not:
- Above HVL = long
- Below HVL = short
Below HVL, momentum decides.
This is exactly why we keep repeating:
We don’t trade the level. We trade the reaction.
5️⃣GEX Myth #5
“GEX Levels Are Hard Walls”
This is one of the most common visual misinterpretations of GEX.
Traders see bold horizontal GEX lines on a chart and subconsciously treat them like concrete walls, precise turning point, exact prices where reversals must happen. That mental model is wrong.
GEX Levels Are Zones — Not Lines
GEX levels do not function as exact-price barriers.
They represent areas of concentrated options exposure, where dealer hedging may become more active.
That means:
- reactions are more likely, not guaranteed
- responses can happen before, at, or after the printed level
- price can easily overshoot the level and still respect it structurally
Especially in index products like SPX, it is completely normal to see:
- 5–10 point excursions above or below a GEX level,
- followed by a reaction only after that overshoot.
This does not invalidate the level. It confirms that it is a zone, not a wall.
Why Exact-Price Thinking Breaks Down
There are several reasons why GEX cannot behave like a single tick-perfect line:
- Options exposure is distributed across strike clusters, not one strike
- Hedging flows adjust continuously, not instantaneously
- Futures and correlated products (/ES, SPY) dilute precision
GEX reflects structural pressure, not mechanical certainty.
The Trap of Treating GEX as a Wall
When traders expect GEX levels to act as hard barriers, they tend to:
- preemptively fade levels without confirmation,
- place stops too tight,
- misread normal overshoots as “failure”.
The Correct Mental Model
Think of GEX levels as:
- reaction zones, not turning points
- areas of interest, not execution prices
- places to observe, not places to predict
This is why we emphasize:
We don’t trade the level. We trade the reaction.
6️⃣GEX Myth #6
“Every GEX Profile Is Clean and Tradable”
This misconception doesn’t come from ignorance it comes from overconfidence. Once traders start to understand GEX mechanics, it’s tempting to believe that every GEX profile must contain a tradable signal.
After all:
- the data is there,
- the levels are plotted,
- the structure looks analytical.
So the assumption becomes:
“If there’s a GEX profile, there must be a trade.”
That assumption is wrong.
Not All GEX Profiles Are Informative
In reality, some GEX profiles are cluttered, internally conflicting, structurally noisy, or simply inconclusive.
You’ll often see profiles where call resistance and put support levels are tightly interwoven, gamma concentration is spread unevenly.
This isn’t a failure of GEX.
It’s a reflection of market uncertainty.
What a “Messy” GEX Profile Actually Tells You
A confusing GEX profile is information in itself.
It usually means:
- positioning is fragmented,
- there is no dominant dealer hedging pressure,
- participants disagree on direction and structure,
- liquidity is scattered across strikes and expirations.
In other words: the market itself hasn’t made up its mind. And when the market is undecided, forcing a trade is rarely a good idea.
Messy profile for FCX
This profile is messy because call resistance and put support levels are interleaved and constantly alternating around price. There is no clear dominance, no directional hierarchy, and no clean hedging pressure.

FCX GEX for 01/21/2028 expiration using TanukiTrade Options Overlay GRID System and the GEX Profile indicator
In a clean GEX profile, structure is simple:
- Above HVL → call resistance
- Below HVL → put support
When call and put levels keep switching places, the market is structurally confused. Dealer hedging pressure is fragmented, reactions become unreliable, and forcing trades in this environment usually means trading noise — not structure.
Sometimes the best read is recognizing that there is no trade.
Clean Profiles vs. No-Trade Zones
Clean, tradable GEX profiles usually share a few characteristics:
- clear separation between call-heavy and put-heavy zones,
- identifiable dominant levels,
- consistent structure across relevant expirations,
When these elements are missing, the correct action is often simple: do nothing.
7️⃣GEX Myth #7
“It Doesn’t Matter Which Expiration’s GEX You Look At”
This is a subtle but very costly misconception.
Many traders assume that once they are “looking at GEX”, the specific expiration behind that GEX profile is just a detail.
It’s not.
In reality, which expiration you use completely changes what kind of information GEX gives you — and whether it is usable at all for your trading horizon.
GEX Only Makes Sense Relative to Your Timeframe
Gamma does not act the same way across expirations.
The shorter the time to expiration, the more:
- concentrated gamma becomes,
- aggressive dealer hedging flows get,
- and immediate the market reaction is.
Longer-dated options, on the other hand:
- move slowly,
- carry much less gamma,
- and influence price behavior over days or weeks, not minutes.
Because of this, there is no single “correct” GEX view. There is only a timeframe-appropriate GEX view.
What to Look At — Depends on How You Trade
This is where practical experience matters more than theory.
If you are a stock day trader, the most relevant GEX information usually comes from the front expiration. That’s where gamma is concentrated enough to influence intraday price behavior, without the noise of far-dated positioning.
If you are trading SPX 0DTE, this becomes even more explicit: the same-day expiration is often the most relevant lens. That is where gamma, charm, and dealer hedging pressure are actually active today. Anything else is background context at best.
If you are a swing trader in individual stocks, the logic flips again. Here, focusing only on the nearest expiration can be misleading. Swing trades can last weeks or even months, so the entire option chain matters. In this case, using an “every expiration” or aggregated GEX view makes much more sense.

What You’re Actually Seeing in This Comparison
The split view above shows the same underlying — XLE — analyzed through two different GEX lenses.
- Left side: First expiration (weekly) GEX — an intraday-focused view
- Right side: Every-expiration GEX — a swing / structural view
This is where many traders get confused.
On the weekly GEX profile, XLE is trading below HVL (48.25), which suggests that short-term dealer hedging no longer suppresses volatility. On this timeframe, intraday price can become more sensitive to order flow, and reactions can develop faster.
However, when you zoom out and look at the every-expiration GEX profile, HVL sits much lower at 46 — meaning that from a broader, swing perspective, XLE is still above HVL and structurally more stable.
In other words:
👉 Short-term: volatility expansion is allowed 👉 Long-term: the broader structure is still supportive
Nothing here is contradictory.
What this comparison really shows is how the same market can look fragile on an intraday horizon, while remaining structurally intact on a higher timeframe.
This is exactly why expiration selection matters — and why using the wrong GEX view for your trading horizon can completely flip your conclusions.
Why the GEX Matrix Exists
This exact problem is why we built the GEX Matrix into the TanukiTrade webapp. The matrix helps compare structural positioning across expirations; it does not predict direction.
A single GEX profile only shows one expiration view of the market. But real positioning is spread across multiple expirations, often telling very different stories depending on timeframe.
The GEX Matrix allows you to see all relevant expirations at once for the same underlying — side by side — so you can immediately understand:
- where short-term hedging pressure dominates
- where longer-term structure still holds
- and how those regimes may conflict or align
Instead of guessing which expiration “matters”, the matrix makes the entire gamma landscape visible in one place.

GEX Matrix for AAPL for swing traders
The Core Insight
GEX is not a universal overlay you can slap onto any chart. It is a time- and expiration-dependent structural lens.
If you don’t align your timeframe, your product (SPX vs stocks), and the expiration you’re analyzing, then even a perfectly calculated GEX profile can lead you to the wrong conclusions.
Understanding which expiration’s GEX you are looking at is not an advanced detail. It’s foundational.
8️⃣GEX Myth #8
“If I Track Intraday Open Interest Changes, I Can Predict Direction”
This is one of the most persistent and most dangerous misconceptions around GEX and options data in general. Many traders believe that if they monitor how open interest changes intraday at specific strikes, they will gain a directional edge.
The logic usually goes like this:
“If OI is increasing at this strike, smart money must be positioning there — so I can infer where price is going next.”
Unfortunately, this assumption breaks down almost immediately.
Open Interest Does Not Tell You Who Is Long or Short
The first and most critical problem is simple:
Open interest only tells you that a contract exists. It does not tell you who holds it — or why.
When OI increases:
- one party is opening a long position,
- another party is opening a short position.
That’s it.
You do not know:
- whether the buyer is retail, institutional, or a dealer,
- whether the seller is hedging, speculating, or arbitraging,
- whether the position is part of a spread, hedge, or isolated leg,
- or whether it will even remain open for more than a few minutes.
Without knowing the structure behind the trade, OI changes are informationally incomplete.
Delayed Data Makes It Even Worse
Even if OI were perfectly interpretable (it isn’t), there is another hard constraint:
You are not seeing this data in real time.
Open interest updates are delayed. Volume is aggregated. Position changes are smoothed after the fact.
By the time you see an OI change:
- the hedge may already be in place,
- the dealer may already have rebalanced,
- and price may have already reacted.
At that point, you are not reading intent you are reading history.
You Also Don’t See the Hedge
This is the part most traders completely underestimate.
Even if you somehow knew:
- exactly how OI changed,
- exactly who opened which side,
- and exactly at which strike…
You still wouldn’t know how the dealer hedged.
You don’t see:
- how much underlying they used,
- whether they hedged with futures (/ES),
- whether they offset exposure with correlated products (SPY, QQQ),
- or how aggressively they adjusted their delta intraday.
Dealer hedging is opaque by design. There is no dataset — public or private — that gives you this visibility.
So any attempt to infer direction from OI alone is missing the most important variable in the system.
Even the CBOE’s 15-minute delayed data feed, which only shows intraday open interest (OI) changes for SPX options, is not sufficient to reliably determine whether dealers are net long or short the underlying.
There are several reasons for this:
- The CBOE feed shows only options-side OI changes
- It does not include dealer hedges in the underlying (spot or futures)
- As a result, it does not reflect the dealer’s true net market exposure
Because of this, even this data source cannot tell you where dealers are actually positioned, or which direction the market “should” move.
For that exact reason, we intentionally avoid this interpretation and do not integrate such data into TanukiTrade indicators.
There is an important conceptual distinction here:
- Dealers do not move the market
- The market moves price
- Dealers react to that movement through hedging
How aggressively and in which direction dealers hedge is not known in advance, and it cannot be inferred from delayed data feeds. It is determined by real-time price momentum, which dealers experience live — not through a 15-minute delayed OI report.
What is genuinely useful information is:
- a GEX profile calculated from the full options chain,
- which reflects the overall market structure,
- and highlights where exposure is actually concentrated.
Those are the levels and structures that truly matter for price behavior — not simplified or misleading dealer-position only narratives.
Why This Creates False Confidence
This misconception is especially dangerous because it feels analytical.
Traders watch numbers change. They build narratives. They convince themselves they’re “seeing the flow”.
But what they’re actually doing is:
- projecting certainty onto incomplete data,
- mistaking correlation for causation,
- and confusing structural context with prediction.
GEX was never meant to predict direction.
Open interest changes don’t magically turn it into a directional oracle.
What Actually Matters Instead
Instead of trying to predict direction from OI changes, GEX is meant to be used differently.
GEX tells you:
- where reactions may be more pronounced,
- where dealer hedging pressure may increase,
- where volatility characteristics may shift.
What happens at those levels is still decided by price action and momentum.
That’s why:
- we watch how price behaves at GEX zones,
- not how numbers change behind the scenes,
- and we wait for confirmation before committing risk.
GEX is powerful when used as a structural map, not as a prediction engine.
9️⃣GEX Myth #9
“GEX Replaces Technical Analysis”
This misconception usually appears right after someone has their first real “aha” moment with GEX. They start seeing levels hold. They notice reactions where price shouldn’t “technically” react. And a natural conclusion forms:
“If GEX shows me where the real forces are, why do I even need traditional technical analysis anymore?”
It’s an understandable thought — but it’s also wrong.
GEX Is Not a Standalone Trading System
GEX is not a replacement for technical analysis. It was never designed to be. GEX does one very specific job: it describes structural pressure created by dealer hedging.
That’s it.
It does not define trend structure, market regime, higher-timeframe bias or where participants are positioned outside the options market.
Price action, market structure, and volume still matter — because price is the trigger that activates hedging flows in the first place. Dealers don’t move markets in isolation. They react to price movement initiated elsewhere.
Why GEX Without Technical Context Breaks Down
If you use GEX without technical context, several things start to happen:
You see reactions that make no sense. You expect levels to hold when structure is already broken. You assume stability in places where momentum is already dominant. You fade moves that are structurally strong.
Not because GEX is wrong but because you removed the framework that tells you how price arrived there.
A GEX level inside a strong trend does not behave the same way as a GEX level inside a range. A GEX zone near VWAP is different from one far from value. A GEX reaction at the open is not the same as one late in the session.
How GEX Actually Fits Into the Analytical Stack
Think of GEX as a layer, not a foundation.
Technical analysis answers questions like:
- Where is the market in its structure?
- Are we trending or rotating?
- Where is value?
- Where might participants be positioned?
GEX answers a different question:
“If price reaches this area, how might dealer hedging change market behavior?”
Those two perspectives are complementary — not competitive.
When they align, reactions become cleaner. When they conflict, you step back or reduce expectations.
The TanukiTrade View: Structure First, GEX Second
In practice, this means:
- Structure defines the context.
- GEX defines the sensitivity inside that context.
- Price action confirms whether hedging pressure is actually activating.
When traders try to skip structure and rely on GEX alone, they usually don’t get more precision they get false confidence. And that’s far more dangerous than uncertainty.
🔟GEX Myth #10
“GEX Works the Same Way in Every Market Environment”
This is one of the most common — and most costly — misunderstandings about GEX.
It usually comes from pattern recognition:
- GEX worked yesterday on SPX.
- It respected the levels.
- Reactions were clean.
So the assumption becomes:
“If it worked then, it should work now.”
That assumption breaks precisely when it matters most.
The Core Mistake
The misconception is not about GEX itself. It’s about context.
Many traders implicitly assume that GEX:
- overrides macro,
- dominates news,
- and behaves consistently across all regimes.
It does not. GEX does not turn markets into a closed mechanical system. It operates inside the broader market environment — not above it.
When GEX Loses Structural Control
There are specific environments where GEX shifts from a controlling framework to a secondary reference.
Typical examples:
- FOMC decisions and press conferences
- CPI / NFP / major macro releases
- Earnings (especially index-heavy or single-stock events)
- Sudden risk-on / risk-off regime shifts
In these situations:
- order flow becomes dominant,
- positioning can change faster than hedging can stabilize,
- and sentiment overrides microstructure.
Dealer hedging becomes reactive, not stabilizing.
That’s a crucial distinction.
What Actually Happens During Market-Moving Events
During macro or event-driven sessions:
- price often moves first,
- positioning adjusts after,
- and dealer hedging follows the flow instead of shaping it.
In other words: GEX no longer defines the path — it lags it.
Levels that normally act as magnets, pinning zones, or volatility dampeners can be sliced through with little reaction.
Not because GEX is “wrong” but because something larger is in control.
GEX in These Environments Still Has Value — Just a Different One
This is where many traders make the second mistake: they either force GEX trades or dismiss GEX entirely.
Both are wrong. In event-driven regimes, GEX becomes a reference framework, not a control mechanism.
It helps you understand:
- where reactions might occur if momentum slows,
- where volatility could compress after the event,
- and where post-event stabilization may emerge.
But it does not give you permission to fade momentum blindly.
🔶Final Thoughts
GEX is not a prediction tool.
It doesn’t tell you where price will go. It tells you how the market may behave if price gets there.
That distinction matters.
GEX is context, not a signal.
By studying the aggregated market GEX Profile, we gain a framework that structures our interpretation without making decisions for us. GEX doesn’t tell us what to trade. It tells us where market behavior may change — and what kind of behavior can appear if price gets there.
When interpreted correctly — and without forcing predictions — it helps you understand:
- whether volatility may expand or compress,
- whether the environment tends to dampen or amplify moves once they start.
You can find additional valuable GEX content here:
Following part (III & IV):
Previous part (I):
Disclaimer This article is for educational and informational purposes only and is not investment advice, a recommendation, or a solicitation to buy or sell any security, derivative, or financial instrument. The content is not personalized to any individual’s circumstances, objectives, or risk tolerance.
Any charts, levels, examples, and product references are illustrative snapshots intended to explain a framework; they are not forecasts and should not be interpreted as trade instructions or signals. Options- and exposure-based metrics may rely on assumptions, estimation methods, and data that can be incomplete, delayed, or subject to revision.
Trading involves substantial risk, including the risk of loss. Past observations or examples do not guarantee future results. Always do your own research and consult a qualified professional where appropriate.
메타데이터
- post_id
- 3837bc31bddb
- slug
- the-most-dangerous-misconceptions-about-gamma-exposure-and-why-most-traders-get-gex-wrong-3837bc31bddb
- url
- https://blog.tanukitrade.com/the-most-dangerous-misconceptions-about-gamma-exposure-and-why-most-traders-get-gex-wrong-3837bc31bddb
- canonical_url
- https://blog.tanukitrade.com/the-most-dangerous-misconceptions-about-gamma-exposure-and-why-most-traders-get-gex-wrong-3837bc31bddb
- author_url
- https://medium.com/@gerynagy
- status
- ok
- fetched_at
- 2026-06-13 12:55:53