Integrating Watmonitor with Ubidots: Practical Guide
What is Ubidots? Ubidots is a powerful IoT platform that combines device integration, real-time visualization, and advanced data analytics…
Integrating Watmonitor with Ubidots: Practical Guide
What is Ubidots? Ubidots is a powerful IoT platform that combines device integration, real-time visualization, and advanced data analytics. While primarily designed for industrial applications, it’s also widely used in research and academic projects. The platform supports a variety of protocols — HTTP, MQTT, TCP, UDP, and even industrial protocol parsing — making it versatile for nearly any IoT scenario.
Ubidots provides over 20 types of dashboard widgets, including metrics, charts, tables, maps, control elements (buttons, switches), clocks, and advanced tools like SCADA, HTML Canvas, and Custom UI. It also enables data post-processing and analytics, allowing users to create synthetic variables derived from raw sensor data.

Some of Ubidots graphs available to STEM users
Why Watmonitor Integration? Watmonitor is a web-based water-level monitoring application. Since Ubidots functions as a push-based system, it doesn’t fetch data from external sources directly — which means we can’t pull Watmonitor data into Ubidots via simple API requests. Instead, we must push data from Watmonitor (or an intermediary middleware, such as Node-RED) to Ubidots.
The most straightforward way to send this data is through an HTTPS POST request, which can be executed either directly from Watmonitor via curl or from a middleware service. This guide applies to both Ubidots STEM and Ubidots Industrial accounts.
Step 1: Creating a Device in Ubidots Navigate to Devices → Create a Device → Blank Device. Since we’re not using a built-in Ubidots hardware template, a blank device works best. Name it something like watmonitor-device. Ubidots will automatically create an API label (e.g. watmonitor-node). Inside the device settings, locate the device token — this authorizes data uploads to Ubidots. All data sent using this token will be stored under the virtual device.

Token available under Watmonitor-node device. This autorizes device to perform a request (write data)
Step 2: Sending Data via HTTPS POST The POST request URL structure looks like this:
https://industrial.api.ubidots.com/api/v1.6/devices/watmonitor-node/ X-Auth-Token: BBUS-NsBhGbMncIpp7GaRCD96J9jO5ZXotX Content-Type: application/json
The payload (in JSON) contains a key–value pair representing the measurement: { “water”: 123 } If your data includes text or non-numeric values, you can use the context key, but for this example, a simple numeric payload suffices.
Upon success, Ubidots returns a 201 status code with a confirmation response:
{ “water”: [ { “status_code”: 201 } ] }
If the token is invalid, you’ll receive an authorization error message.
You may also use a user token instead of a device token — but note that Ubidots distinguishes between tokens and API keys.

Created variable named water with value 48 updated by a device
Step 3: Example CURL Request from Watmonitor Here’s a sample PHP curl call from Watmonitor:
$hodnota = 48; $ch = curl_init(“https://industrial.api.ubidots.com/api/v1.6/devices/watmonitor-node/"); $data = json_encode([ “water” => $hodnota ]); curl_setopt($ch, CURLOPT_RETURNTRANSFER, true); curl_setopt($ch, CURLOPT_POST, true); curl_setopt($ch, CURLOPT_HTTPHEADER, [ “Content-Type: application/json”, “X-Auth-Token: BBUS-NsBhGbMncIpp7GaRCD96J9jO5ZXotX” ]); curl_setopt($ch, CURLOPT_POSTFIELDS, $data); $response = curl_exec($ch); curl_close($ch);
Once the data is stored, you can view the incoming variable (water) directly in the device dashboard.
Step 4: Creating a Dashboard in Ubidots From the left navigation bar, click Ubidots → Dashboards. Create a new dashboard (e.g. Watmonitor_Integration). Add a new widget (chart, gauge, or metric). Choose the device (watmonitor-device) and variable (water).

Variable selection within a device, when widget created

Unit for variable can be set within Device section

Ubidots Dashboard showing the latest value received and also graph with recorded values per last 25 min
In the Aggregation section, select how to visualize your time-series data (last value, average, sum, min, max, count, etc.). Customize appearance — name, decimal precision, color scheme, date/time format, and more. Advanced users can further customize widgets using the HTML editor.
Step 5: Using Node-RED as Middleware — optional You can also send data to Ubidots using Node-RED, a visual IoT integration tool. Node-RED can pull Watmonitor data directly from the JSON endpoint:
{ “name”: “Waterwell at home”, “value”: 340, “depth”: 400, “volume”: 1709.03, “time”: “26. Oct 18:11”, “time_now”: “26. Oct 22:22” }
Since this response includes text fields, you’ll need to reformat the JSON (remove strings or wrap them under a context key) before sending to Ubidots.
MQTT Alternative Alternatively instead of direct HTTP(S) POST request, Node-RED can publish data to Ubidots via MQTT:
Broker: industrial.api.ubidots.com Ports: 1883 (MQTT) or 8883 (MQTTS) Username: your Ubidots token Password: leave empty Topic: /v1.6/devices/watmonitor-node
This same broker works for both Industrial and STEM users. (Note: things.ubidots.com MQTT endpoint is being deprecated.)

Node-RED flow (HTTP GET request, JSON payload parsing, function to create JSON for water variable, set value, send via Ubidots OUT node
I wasn’t able to send data via standard MQTT node to the Ubidots platform directly (solution that was working for ThingSpeak, ThingsBoard…). I had to install Ubidots IN/OUT nodes via Palette manager and package name node-red-contrib-ubidots. With that it is working with identical function node for preparing JSON object (identical as for ThingsBoard).
Node-RED implementation is obtaining Watmonitor’s data via HTTP(S) GET request. Data are parsed using JSON parsing node. Then function node is preparing the final JSON object which is compatible with Ubidots MQTT API.
Step 6: Going Beyond Visualization Once your data is flowing, Ubidots allows you to: Run data analytics and forecasting Create synthetic variables Configure Events (notifications or triggers) Build Data Pipelines for automation and integration

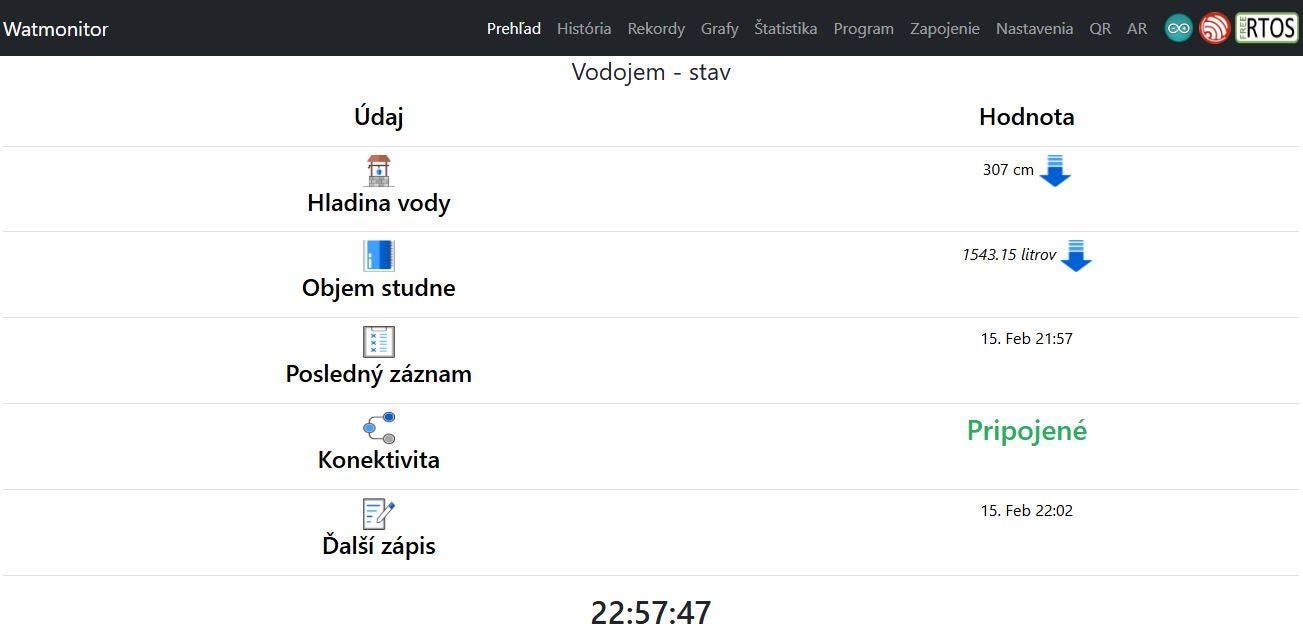
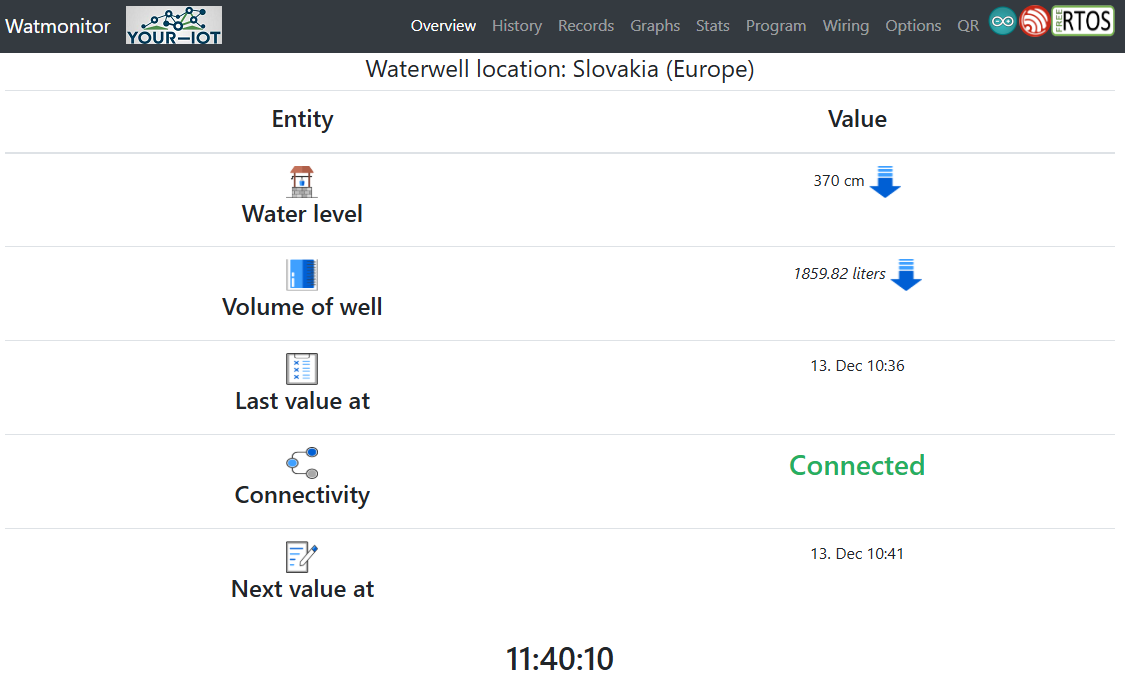
Watmonitor web interface with data of water level and water volume recorded, distributed by JSON too

Same data recorded in Ubidots
Try It Yourself You can experiment with Watmonitor using your own hardware. Sample source codes are available for:
ESP32 ESP8266 Arduino Raspberry Pi Pico W
Some of them supporting Wi-Fi, some Ethernet connectivity with ultrasonic or laser ToF distance sensors. Explore or integrate Watmonitor into your Ubidots or industrial IoT system directly via JSON or through Node-RED middleware: https://your-iot.github.io/Watmonitor/
Node-RED flow used in this guide: https://github.com/martinius96/hladinomer-studna-scripty/tree/master/examples/Tools_Integrations/Ubidots
메타데이터
- post_id
- 3890c8a7b738
- slug
- integrating-watmonitor-with-ubidots-practical-guide-3890c8a7b738
- url
- https://medium.com/@your-iot/integrating-watmonitor-with-ubidots-practical-guide-3890c8a7b738
- canonical_url
- https://medium.com/@your-iot/integrating-watmonitor-with-ubidots-practical-guide-3890c8a7b738
- author_url
- https://medium.com/@your-iot
- status
- ok
- fetched_at
- 2026-08-24 21:51:27