Roads — How are they described and modeled in suspension design?
Roads As Disturbance — How Are They Described And Modeled In Suspension Design?
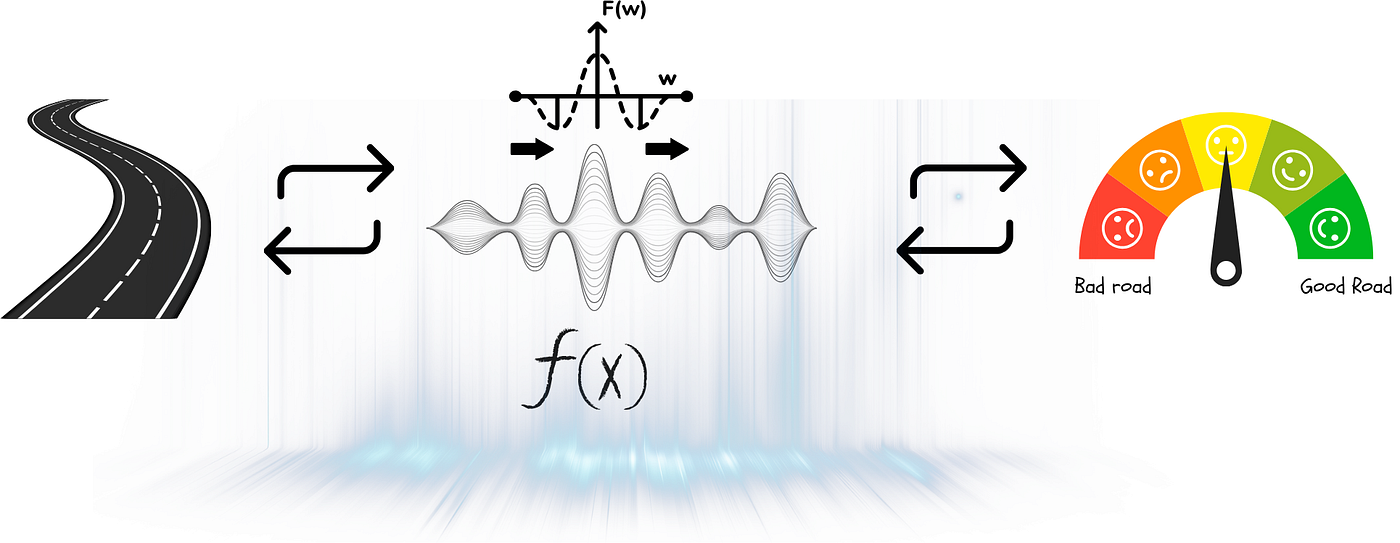
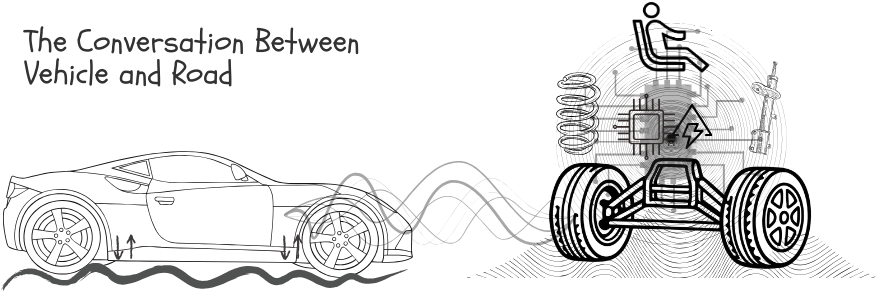
Road surfaces are one of the main sources of vibrations or vertical oscillations in a vehicle. Every bump, ripple or irregularity in the road excites the vehicle’s suspension and generates vertical oscillations that ultimately influence the ride quality.
Road surface irregularities represent the dominant excitation source for the vertical vibration system of a passenger vehicle within the frequency range up to approximately 30 Hz. This frequency band strongly influences ride comfort and suspension response.
So, a car’s suspension, whose primary goal is to attenuate the effects of these disturbances, needs to be designed keeping the roads on which the vehicle would be driven. To analyze and design suspension systems, the road surface must therefore be described in a way that is consistent with the dynamic behavior of the vehicle system.
Irregular Nature of Real Roads
Real road surfaces exhibit unevenness with varying amplitudes and wavelengths occurring at non-periodic intervals.

Unlike idealized signals like step inputs and harmonic signals, road disturbances do not repeat in a deterministic manner. Instead they form a complex combination of surface irregularities originating from pavement structure, wear, construction, tolerances and environmental effects.
Road Excitation as a Stochastic Process
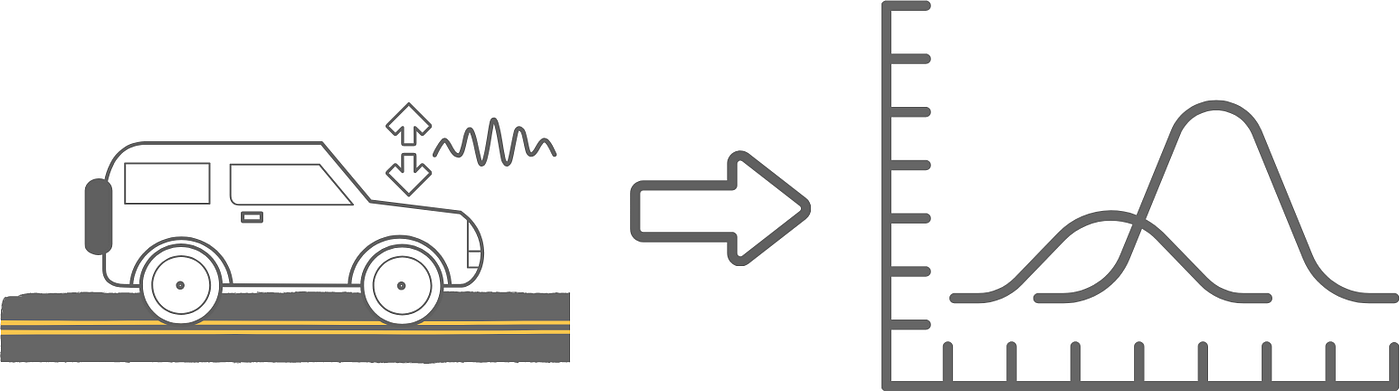
Because road irregularities occur randomly, road excitation is better modeled or described as a stochastic process.
In this frame work, one measured road profile is just one possible example of a road surface. It does not fully describe the general condition of the road. Instead, engineers describe road roughness statistically. This allows engineers to characterize road roughness in a general way, independent of any specific road measurement.
To put in another way, different sections of the same road may produce different time histories while belonging to the same statistical road class. Therefore, the road excitation must be described using statistical properties rather than individual signals.
Spectral Representation of Road Unevenness
Road surfaces contain irregularities of many different sizes. Some are long undulations spread over several meters, while others are small, short-wavelength bumps. To understand how these different features influence vehicle vibrations, the road profile can be decomposed into components with different wavelengths.

By defining waviness, the road surface is interpreted as a superposition of unevenness components with different wavelengths.
We can imagine these “waves” as follows:
- Long waves — represent the gentle undulations of the pavement.
- Medium waves — correspond to typical road roughness that excites the suspension.
- Short waves — small surface irregularities that primarily excite the tire and wheel assembly.
Why wavelength matters?
Different wavelength ranges affect the vehicle in different ways:
[embed]
Intuition: Imagine driving over ocean waves.
- Large rolling waves gently move the entire boat.
- Smaller waves shake the boat more noticeably.
- Tiny ripples mostly disturb the surface.
From Spatial Waves to Temporal Vibrations
Vehicles do not experience road waviness directly in space (spatial) — they experience it in time (temporal).
A spatial road wavelength (λ) is converted into a temporal excitation frequency (f) depending on the vehicle speed (v):
f = v/λ
This simple relationship has an important consequence. The same road can excite very different frequencies depending on how fast the vehicle is moving.
For example:
- A 5-meter road wave produces roughly 3.3 Hz excitation at 60 km/h.
- At 120 km/h, the same wave produces 6.7 Hz.
In other words, the faster you drive, the more quickly the road irregularities hit the vehicle system.
This naturally leads to a frequency-based description of the road surface. Instead of only looking at the road profile in the spatial domain, the profile is analyzed in terms of the frequencies or wavelengths that make up the surface. By averaging the energy of these components, engineers obtain the Power Spectral Density (PSD).
PSD as a Road Descriptor
PSD provides a compact way to describe how the unevenness of the road is distributed across different spatial or temporal frequencies. In other words, it shows which wavelengths contribute most to the overall roughness of the road surface.

Instead of asking:
What does the road look like at a particular location?
we ask:
How much roughness exists at different wavelength scales?
The PSD essentially tells us:
- how much long-wave content exists
- how much medium-wave content exists
- how much short-wave content exists
In other words, it answers the practical engineering question:
How “bumpy” is the road across different length scales?
Comparing Different Roads
One of the most powerful aspects of PSD-based road descriptions is that they allow objective comparison of road quality.
Two roads that look very different in time profile may still belong the same roughness class if their PSD distributions are similar.
The power spectral density is often approximated into straight line by describing it using the mathematical equation:

where G𝒹(n₀) is the PSD at a reference spatial frequency n₀ and w is referred to as waviness (undulation) exponent. The road surface undulation varies between 1.7 and 3.3 depending on the type of pavement. On average across different road surfaces, the undulation is w = 2 and is used as the standard for the “standard road.”

This idea forms the basis of road roughness classification standards such as:
In these classifications, roads are categorized according to the magnitude and slope of their PSD curves.

In general, smoother roads are characterized by a lower value of G𝒹(n₀) value at the reference frequency. A larger waviness exponent w indicates a faster decay of the spectrum toward higher spatial frequencies, meaning that the road contains relatively fewer short-wavelength irregularities.
Why Engineers Care About the PSD?
From the perspective of vehicle dynamics, the PSD provides a crucial link between the road excitation and the vehicle frequency response.
In other words, the spectral description of the road surface is very effective because vehicle dynamics systems exhibit frequency-dependent behavior, i.e. suspension systems, tires and vehicle bodies respond differently depending on excitation frequency.
For example:
- body bounce typically occurs around 1–2 Hz
- human body is very sensitive around 4–8 Hz
- wheel-hop frequency appears around 10–15 Hz
The PSD tells us how much energy the road is injecting into each of these frequency ranges.

By expressing both the road excitation and the vehicle response in the frequency domain, PSD-based road models enable a consistent interface between road input models and vehicle dynamics systems.
From Road To Passenger: How Vibrations Travel Through The Vehicle
The spectral description of road roughness tells us how much excitation energy exists at different wavelengths.
The next question is:
How does this excitation actually reach the passenger?

Simplified representation of the disturbance transmission pathway in vertical vehicle dynamics. Road-induced vibrations propagate from the tire–road interface through the suspension and vehicle body before reaching the passenger. Concept adapted from Wallentowitz (2005)
Road disturbances do not act directly on the occupants, instead they propagate through a sequence of mechanical components that form the vehicle structure.
The process begins at the tire-road interface, where road unevenness introduces vertical displacement into the wheel assembly. The tire acts as the first compliant element and absorbs a portion of the smallest irregularities.
The remaining disturbance excites the unsprung mass, consisting of the wheel and associated components. These motions are then transmitted through the suspension system, which includes springs, dampers, links and bushings.
The suspension plays a central role in this transmission. It forms a dynamic interface between the unsprung and sprung masses, allowing relative motion while controlling how vibration energy is transmitted.
From there, the disturbance reaches the vehicle body structure (sprung mass). The body does not simply follow the road input — it responds according to its dynamic characteristics, filtering and redistributing the incoming excitation.
Finally, these motions are transmitted to the occupants through the seat, floor structure and interior interfaces. Passenger comfort depends on the magnitude, duration and frequency content of these transmitted vibrations.
This representation highlights a key idea in vertical vehicle dynamics:
The road provides the excitation input, the vehicle acts as a dynamic filter, and the passenger experiences the resulting motion.
While the full disturbance framework of a vehicle includes additional excitation sources such as engine forces and structural vibrations, road-induced excitation remains the dominant contributor in the frequency range relevant for ride comfort. Therefore, the discussion here focuses on the transmission of road-induced disturbances.
International Roughness Index (IRI) — Another metric
While spectral descriptions such as power spectral density (PSD) provide a detailed representation of road unevenness, road quality in practice is often summarized using a single metric known as the International Roughness Index (IRI).
IRI is a standardized measure of road roughness developed by the World Bank and widely used by road agencies to assess pavement quality and maintenance needs.
What IRI represents
The International Roughness Index quantifies the accumulated vertical motion of a vehicle suspension system as it travels over a measured road profile.
More specifically, the IRI is calculated by simulating the response of a standardized quarter-car model traveling over the road profile at a constant speed. The total suspension motion of this model, normalized by distance traveled, is reported as the roughness index.

In simple terms:
IRI measures how much a typical vehicle suspension would move when driving over a road.
Units and interpretation
IRI is typically expressed in meters per kilometer (m/km) or inches per mile. Lower values indicate smoother roads. Typical ranges are:
[embed]
Relation to PSD-Based Descriptions
IRI and PSD describe road roughness in different ways:
- PSD provides a detailed description of unevenness energy across different wavelength and frequencies.
- IRI compresses the road condition into a single number that reflects the expected response of a standard suspension system.
Because of its simplicity, IRI is widely used for road maintenance and infrastructure assessment, while PSD-based descriptions are more commonly used in vehicle dynamics and suspension development.
In the context of vertical vehicle dynamics:
- PSD helps engineers understand how road roughness excites different vehicle vibration modes.
- IRI provides a practical indicator of overall road quality experienced by drivers.
Together, these measures provide complementary perspectives on the road excitation that influences ride quality and vehicle response.
References
[1] Heißing, B., & Ersoy, M. (eds.), 2011, Chassis Handbook: Fundamentals, Driving Dynamics, Components, Mechatronics, Perspectives, ATZ/MTZ-Fachbuch Series, Vieweg+Teubner Verlag, Wiesbaden (DOI: 10.1007/978–3–8348–9789–3)
[2] Wallentowitz, 2005, Vertikal- / Querdynamik von Kraftfahrzeugen, 7. Auflage, Aachen (ISBN 3–925–194–35–5)
[3] ISO 8608:2016, Mechanical vibration — Road surface profiles — Reporting of measured data, International Organization for Standardization, Geneva.
[4] Sayers, Michael W; Gillespie, Thomas D; Queiroz, Cesar A.V. The International Road Roughness Experiment (IRRE) : establishing correlation and a calibration standard for measurements (English). World Bank technical paper ; no. WTP 45 Washington, DC : The World Bank. http://documents.worldbank.org/curated/en/326081468740204115
Note to Readers
This article is intended for educational purposes and aims to provide an intuitive introduction to the concepts discussed. The explanations focus on building a conceptual understanding rather than covering the topic in complete academic depth.
All illustrations in this article were created by the author using Canva unless otherwise stated.
The framework presented here represents one way of explaining the subject. In practice, different modeling approaches, interpretations, and explanations may exist in the literature depending on the specific engineering context.
메타데이터
- post_id
- 39bf729f3ec8
- slug
- roads-how-are-they-described-and-modeled-in-suspension-design-39bf729f3ec8
- url
- https://medium.com/@gkhandavalli/roads-how-are-they-described-and-modeled-in-suspension-design-39bf729f3ec8
- canonical_url
- https://medium.com/@gkhandavalli/roads-how-are-they-described-and-modeled-in-suspension-design-39bf729f3ec8
- author_url
- https://medium.com/@gkhandavalli
- status
- ok
- fetched_at
- 2026-06-09 15:37:30