Logistic Regression — Part 1
Basic Intuition toward Binary Classification
Logistic Regression
Prerequisite: This assumed that you understand the concept of supervised algorithm and preliminary difference between classification and regression. Otherwise you can refer here.
In the world of Machine Learning, beginners finds it quite challenging to understand Logistic Regression both for it term and similarity & difference with Linear Regression. This algorithm is very popular classification algorithm.
To understand it further, it is also recommended to have an intuitive knowledge on Simple Linear Regression. For that, you can refer here.
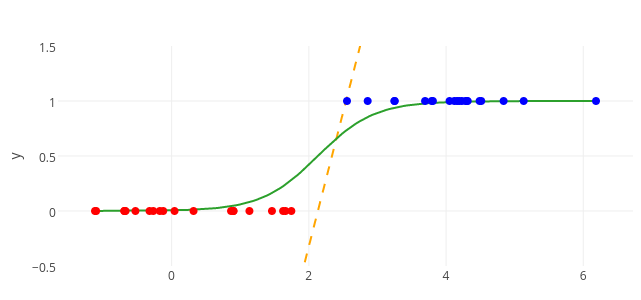
Linear Regression and Logistic Regression
Intuition of Logistic Regression
Linear Regression helps us to predict stock prices, employee’s salary or temperature of a day etc, so mainly helps in prediction of continuous variable. Whereas, Logistic Regression deals with other type of problem like spam detection, employee retention, customer identification etc, hence, this help in prediction of categorical variable. The later technique is known as classification, more specifically Binary Classification.
Now, to understand the Logistic Regression, let’s consider the following example.
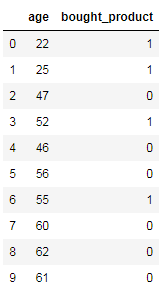
Figure 1. Sample Datasets
Here, we need to find out potential customers of smartphones based on the age.
In this example, you can observe a pattern like younger customer is more likely to buy a smartphone (say, 1) whereas old customers doesn’t invest much money on it (say, 0). So, understanding correlation we can try and build a machine learning model for the same.
To have a visual observation, we can plot this data as below and try to draw a best fit line (Linear Regression)
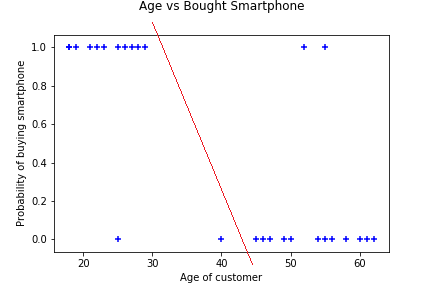
Figure 2. Best line fit on Age Vs ‘Bought Smartphone’
So, here we can say if the probability is more than 0.5, then the customer is more likely to buy the product. Otherwise, not. Hence, everything on left side of the line is yes and the other side is no, though we have few outliers here but it still work fine as it predicts 90% of the cases.
Now, imagine we have a outlier of a customer age 90, then the best fit line will look something like this.
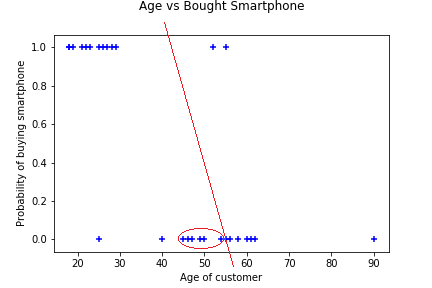
Figure 3. Best fit line get shifted due an outlier
So, you can see few data points are getting incorrect prediction because of one extreme outlier.
To avoid the above problem, we use sigmoid function to predict classification problem statement. It can represented something like this.
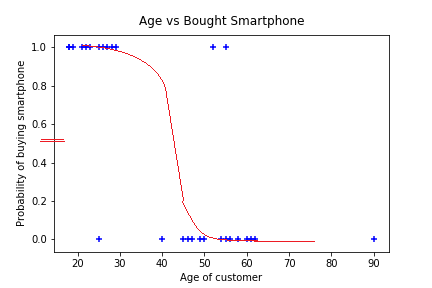
Figure 4. S-shaped curve or Sigmoid curve
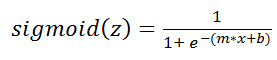
Statistically, we call this line sigmoid or logit function. Equation of the same is given below:

where e is Euler’s number ~ 2.71828, mathematical constant.
Conceptually, we dividing 1 by a number which is somewhat greater to 1. Thus, this function actually converts any input within a range 0 and 1.
From, figure 1, we know, the equation of Linear function is y = mx + b. So, we are feeding this line to a sigmoid function, and convert the straight line to a S shaped curve. i.e., z = mx + b.
Eventually, the sigmoid function is something like this,
Please note, you don’t need to implement all this logic. We can do it simply with the help of sckit-learn library.
So, let’s dive into the code.
Let’s first import couple of important libraries,

Next, import the data file.

Then, we can do a simple train test split, so that we can validate our prediction later on.

Let’s now create our logistic regression model and fit the training data.

Now, our model is ready to do predictions.

One can also find the probabilities as well, like this
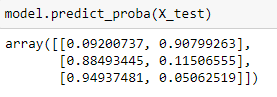
Let’s try to validate our test data with the given age data are as follows:
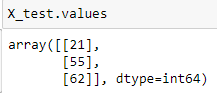
So, we already observed that younger generation is likely to buy smartphones and older people would not. Hence, we can see the prediction is almost accurate.
To find the accuracy of our model, we can simply,
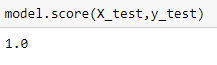
Here, the score is 1, which means our model is perfect. This is possible because of data sample is quite simple and small with almost no outlier. But, for larger and more complex datasets, this score is not so perfect.
With the help of this model given the age of customer, we can easily predict whether he or she is likely to buy a smartphone or not.

The customer of age 25 is more likely to buy a smartphone than that of 50 aged customer.

In-Summary
Linear Regression should not be used for binary classification for two reasons,
Firstly, in regression we may have output that is greater than 1 and less than 0, which doesn’t hold any true meaning in real world.
Secondly, when we have lots of outliers in our data, best fit line gets completely deviated and that leads to poor model.
To overcome the above disadvantages Logistic Regression(sigmoid function) is used.
The outcome of sigmoid function always lies between 0 and 1, so that probability of any event can be calculated.
메타데이터
- post_id
- 39fca01889f7
- slug
- logistic-regression-part-1-39fca01889f7
- url
- https://medium.com/analytics-vidhya/logistic-regression-part-1-39fca01889f7
- canonical_url
- https://medium.com/analytics-vidhya/logistic-regression-part-1-39fca01889f7
- author_url
- https://medium.com/@pyne.bidisha2017
- status
- ok
- fetched_at
- 2026-07-16 23:19:56