Grafana Loki: Turning Production Chaos into Control
Over the last six months, my team and I have been on a journey with Grafana Loki — a journey that started with late-night firefighting and…
Grafana Loki: Turning Production Chaos into Control
Over the last six months, my team and I have been on a journey with Grafana Loki — a journey that started with late-night firefighting and ended with a more controlled, data-driven way of handling production incidents.
Because the learning curve was steep and full of valuable lessons, I decided to share our experience in two parts:
Part 1: Fundamentals — how logs can be transformed into metrics
Part 2: The mathematics behind building reliable dashboards
The story begins on February 20, 2025. That’s when we hit our first big production issue.
Our SRE team reported that a newly deployed Kubernetes service was stuck in a crashloopback due to an out-of-memory error. Now, if you’ve ever troubleshooted in production with a vague error like that, you know the pressure: the clock is ticking, the SLA is unforgiving, and the root cause hides somewhere in a mountain of logs.
Here’s what it looked like for us:
- Wading through millions of log lines from eight pod replicas
- Cross-checking upstream services that were streaming data to us
- Sifting through Nginx request logs to reconstruct what was happening at the HTTP layer
Despite the effort, we eventually had to roll back to the previous version just to meet our 30-minute SLA. The actual fix only came three to four days later, after the entire team of eight spent hours piecing things together.
That painful incident was our wake-up call. It made us realize how much chaos existed in our troubleshooting process — and why we needed something better. That’s when Loki entered the picture.
Before diving into the fundamentals, let’s make this a bit interactive. Imagine you’re on-call as an SRE: a ticket comes in — the application feels unstable, and users are complaining about login failures.
Here’s the challenge: can you spot the log lines that reveal the root cause?
Take a minute to think about it. This is exactly the kind of situation we faced before adopting Loki — millions of log entries, limited time, and high pressure.

Log lines in Production
Of course, we could throw a few log lines into an AI tool — OpenAI, Claude, or any other LLM — and get some analysis out of it. That works fine when the dataset is small. But when you’re staring at gigabytes of production logs, the sheer volume becomes overwhelming, and spotting the signal in the noise is nearly impossible.
That’s where Loki completely shifted my perspective. Honestly, it felt like stepping into a new world. Instead of sifting line by line, Loki treats logs like structured data. If your logs follow a defined format, Loki automatically detects the fields and allows you to query them just like metrics.
Want to see all HTTP 500 errors? Query by status code. Curious about performance bottlenecks? Filter by response time. Need to track down which users are affected? Drill down by user field. Suddenly, logs aren’t just static text anymore — they become dynamic, queryable insights.
With this approach, we weren’t just reading logs; we were understanding them, filtering noise, and uncovering patterns that were invisible before.

Logs through Loki’s lens
Turning Logs into Metrics (and Insight)
Let’s put the “Loki lens” to work. Using the same login-error dataset, we’ll build three quick visuals that answer three urgent SRE questions:
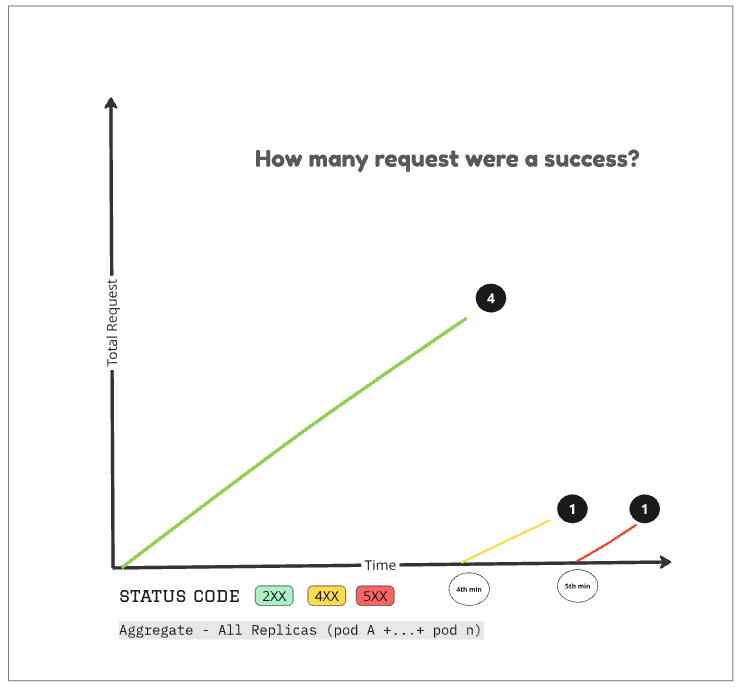
Plot 1 — When did 4xx/5xx errors happen?
What it shows: a time series of error counts so you can see when the incident started and how it evolved.
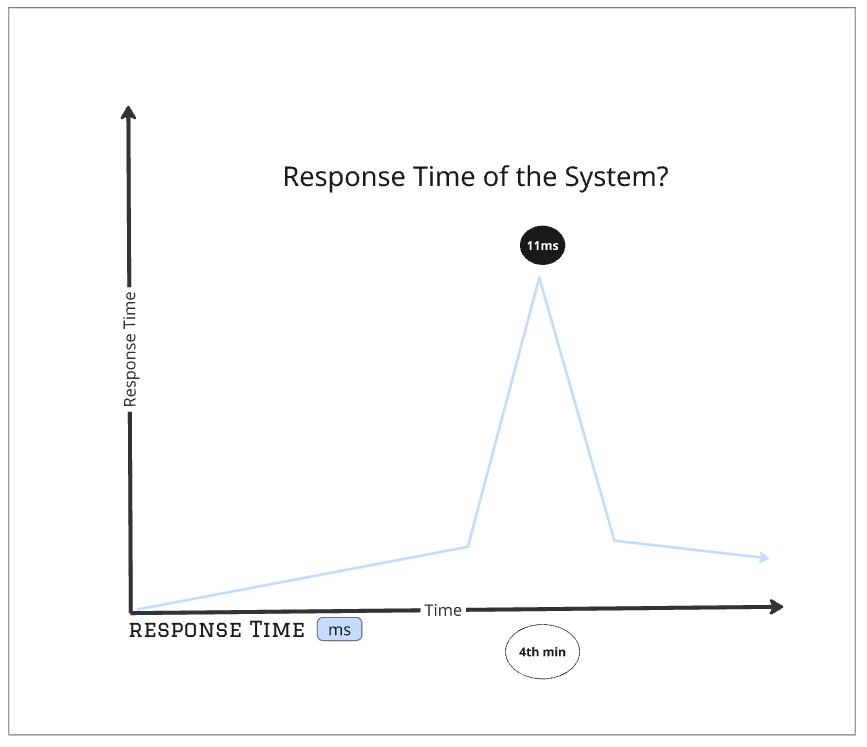
Plot 2 — Where did the response time spike?
What it shows: latency trend (p95 or max) so you can spot the spike and align it with deploys or traffic bursts.Plot 2 — Where did the response time spike?
What it shows: latency trend (p95 or max) so you can spot the spike and align it with deploys or traffic bursts.
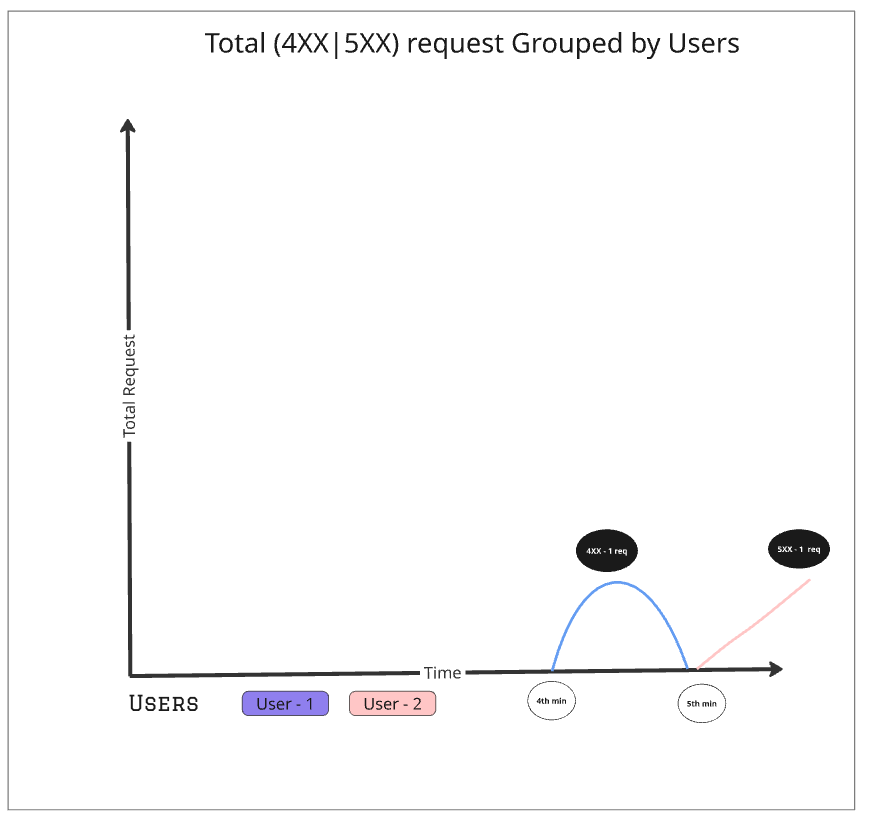
Plot 3 — Which users were impacted (4xx/5xx)?
What it shows: the top affected users during the incident — super helpful for targeted comms or rollback validation.
Note: This section is about building the core, fundamental pieces of observability — how to take raw, noisy logs from a complex microservices world and tame the chaos into something you can reason about. Once you see logs as structured, queryable data, everything else — alerting, SLOs, and dashboards — starts to click.
Up next (Part 2): we’ll turn these parsed service logs into living dashboards in Grafana — p95 latency, error budgets, top offenders, and targeted alerts — and show how this approach led to proactive monitoring and cut our MTTR by 40%.
If Part 1 was about finding a signal, Part 2 is about operationalizing it.
Acknowledgments — Huge thanks to the Grafana Loki maintainers and community for their guidance and docs that helped us learn faster. Special shout-outs to the contributors @ Cyril Tovena @Nichole Van der Hoeven, @jay clifford — your examples and notes saved us hours.
References
Loki Community Calls — YouTube Link
메타데이터
- post_id
- 3abb3e0783fe
- slug
- grafana-loki-turning-production-chaos-into-control-3abb3e0783fe
- url
- https://medium.com/@ajay.jrs/grafana-loki-turning-production-chaos-into-control-3abb3e0783fe
- canonical_url
- https://medium.com/@ajay.jrs/grafana-loki-turning-production-chaos-into-control-3abb3e0783fe
- author_url
- https://medium.com/@ajay.jrs
- status
- ok
- fetched_at
- 2026-06-17 08:20:12


