My Learning Journey In Data Analysis With Excel: Setting Up My First sales Dashboard.
When I first started learning Microsoft Excel, I thought it was only a tool for entering data and performing simple calculations. As I…
My Learning Journey In Data Analysis With Excel: Setting Up My First sales Dashboard.
When I first started learning Microsoft Excel, I thought it was only a tool for entering data and performing simple calculations. As I continued practicing, I discovered that Excel is a powerful platform for data analysis, business reporting, and storytelling.
What I Learned Along the Way
Working on this dashboard helped me strengthen several key Excel skills:
- Cleaning and organizing raw datasets
- Using formulas to calculate revenue and estimated profit
- Building PivotTables and PivotCharts
- Creating KPI cards to display important metrics like total revenue and the number of containers
- Adding slicers for dynamic filtering
- Designing dashboards that are both informative and visually appealing
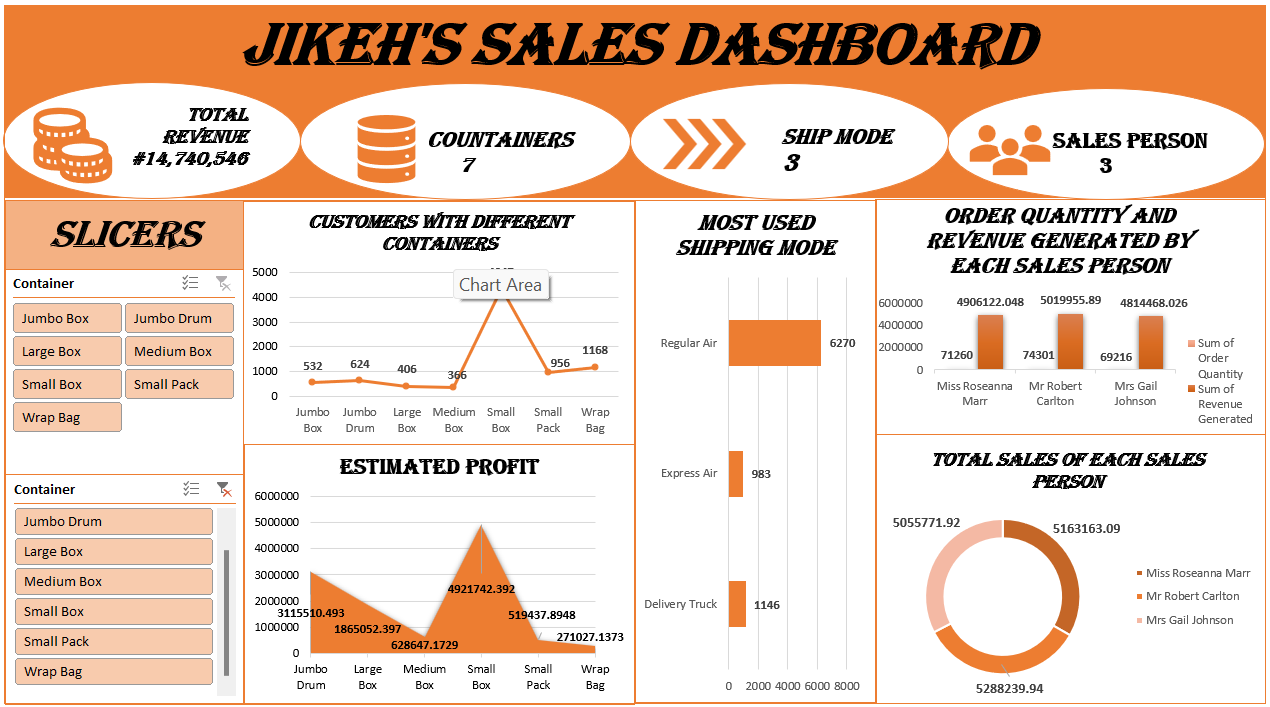
One of the projects I’m most proud of is the dashboard below.
Key Insights from the Dashboard
Some of the questions this dashboard helps answer include:
- Which shipping mode is used the most?
- How much revenue was generated?
- Which sales representative generated the highest sales?
- Which container type was ordered most frequently?
- What is the estimated profit across different product categories?
These insights can help businesses make better operational and sales decisions.
Challenges I Faced
Not everything worked perfectly on the first attempt. I spent time troubleshooting formulas, adjusting PivotTables, formatting charts, and aligning dashboard elements to create a clean and user-friendly layout.
Every mistake became an opportunity to learn something new.
The Biggest Lesson
I’ve realized that Excel isn’t just about calculations — it’s about communicating data effectively. A well-designed dashboard can turn thousands of rows of information into a story that decision-makers can understand in seconds.
What’s Next?
I’m continuing to improve my skills by exploring advanced formulas, Power Query, Power Pivot, and data visualization techniques. Each project teaches me something new, and I’m excited to keep building and sharing my progress.
Growth happens one spreadsheet at a time.
Conclusion
This dashboard reflects how far I’ve come in my Excel journey, but I know there’s still so much to learn. I’m committed to improving my data analysis and dashboarding skills with every project I build.
As I continue learning and taking on more projects, I look forward to exploring advanced Excel features and expanding my knowledge in data analytics. I hope this work inspires other beginners to stay consistent, keep practicing, and trust that small improvements can lead to significant growth over time.
data analyst
메타데이터
- post_id
- 3c7b59fb5696
- slug
- my-learning-journey-in-data-analysis-with-excel-setting-up-my-first-sales-dashboard-3c7b59fb5696
- url
- https://medium.com/@olapejufadeelat/my-learning-journey-in-data-analysis-with-excel-setting-up-my-first-sales-dashboard-3c7b59fb5696
- canonical_url
- https://medium.com/@olapejufadeelat/my-learning-journey-in-data-analysis-with-excel-setting-up-my-first-sales-dashboard-3c7b59fb5696
- author_url
- https://medium.com/@olapejufadeelat
- status
- ok
- fetched_at
- 2026-06-20 20:29:01



