Semiconductor Markets: Why Most Sentiment Indicators Are Misreading 2026
Price says peak. Inventory says mid-cycle. They can’t both be right — and that gap is where the real signal lives.
Semiconductor Markets: Why Most Sentiment Indicators Are Misreading 2026
Price says peak. Inventory says mid-cycle. They can’t both be right — and that gap is where the real signal lives.
2 Semiconductor Markets, 1 Sentiment Number.
If you read most retail sentiment trackers right now, the message about semiconductor stocks is pretty consistent: extreme greed, peak conditions, time to be cautious. The PHLX Semiconductor Index (SOX) is up around 115% year-over-year. NVIDIA crossed $4.8 trillion in market cap. Most fear-and-greed gauges show readings above 80.
There’s a problem with that read.
It conflates price extremes with cycle position. The two are not the same thing in semiconductors. And in this particular cycle, they are giving completely opposite signals — which is something a price-only sentiment gauge will never tell you.
This is the case for looking at the chip industry differently than you look at the broader market. And it’s the reason we built Semiconductor Fear & Greed — a sentiment and cycle tracker designed specifically for semis, with fundamentals from SEC filings layered onto the price data.
Why semiconductor cycles break the sentiment-tracker mold
A standard fear-and-greed index for the stock market reads things like the VIX, put/call ratio, S&P 500 momentum, breadth, junk bond demand. These are useful for gauging broad market sentiment because the broader market is, in aggregate, a sentiment-driven thing. Lots of stocks, lots of investors, mean reversion within reasonable bounds.
Semiconductors don’t work that way.
A modern leading-edge fab costs $20 billion to build and takes 3–5 years to come online. Once it’s running, it has to run near full utilization to recover the capital. Demand swings on the order of months, but supply takes years to adjust. The result: chronic mismatches between what the world wants and what fabs can produce. When demand surges, prices and earnings spike, capacity gets added across the industry simultaneously, and by the time it all comes online, demand has often cooled.
This is the capital cycle, and it produces semiconductor downturns that look nothing like normal market corrections. The 2022 cycle saw SOX draw down 49%. The Dot-Com semi crash was 70%. These aren’t sentiment-driven sell-offs. They’re physical mismatches between supply and demand finally resolving.
A fear-and-greed index that reads only price momentum and breadth will tell you that the sector is overbought or oversold. It cannot tell you whether the cycle is mid-expansion, late-expansion, or starting to roll over. And those are very different things from a risk-management standpoint, because price extremes can persist for years inside a healthy expansion before the cycle actually breaks.
What forward signals actually look like
Semiconductor Cycle Signals
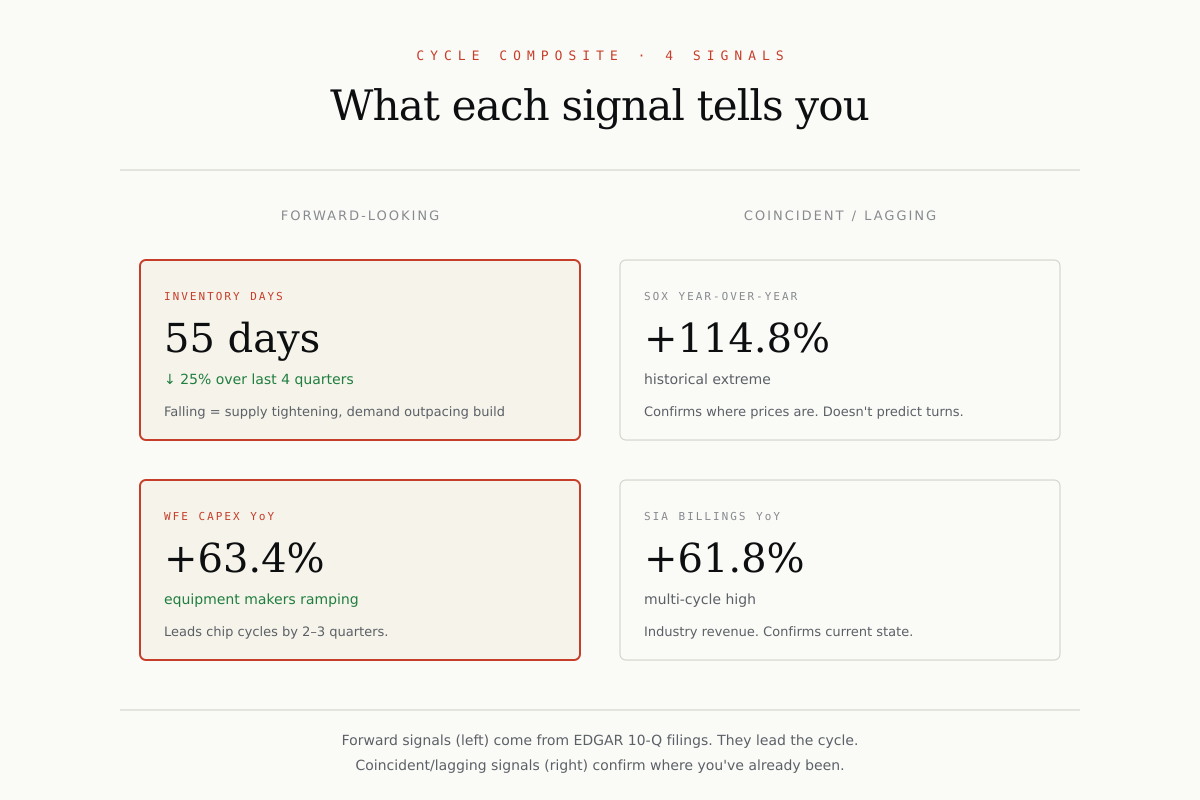
Two pieces of data move before the SOX does. Both come from quarterly 10-Q filings.
The first is inventory days — how many days of revenue worth of finished goods chip companies are sitting on. When demand is outpacing supply, this number falls. When it’s the opposite, it builds up. Inventory days don’t lie. Companies can’t fudge them on calls. They show up in the financial statements every 90 days.
The second is WFE capex — what wafer fabrication equipment makers like Applied Materials, Lam Research, KLA, and ASML spend on their own production capacity. They size this capex based on the order book they see one to two quarters out. When chip companies start ordering more equipment, equipment makers expand their own capacity, and that’s reflected in their capex line. WFE capex typically peaks two to three quarters before the broader chip cycle does.
Pure-price sentiment gauges miss both of these. They have no way of seeing them. The data sits in 10-Q filings on EDGAR, gets parsed by analysts into research notes, and eventually shows up in earnings revisions — but by the time it shows up in price, the move has already happened.
What this looks like right now
Looking at our composite as of late April 2026:
- SOX YoY: +114.8% — historical extreme. By price, it’s hard to argue we’re not at a cycle peak.
- SIA billings YoY: +61.8% — also extreme. Industry revenue growth at multi-cycle highs.
- Aggregate inventory days: 55 (down 25% over the last 4 quarters) — supply is tightening, not loosening. Memory and IDM filers are running leaner than they were a year ago.
- WFE capex YoY: +63.4% — equipment makers are aggressively ramping their own capacity, which means they expect chip demand to stay strong well into 2027.
Late Expansion, Not Peak?
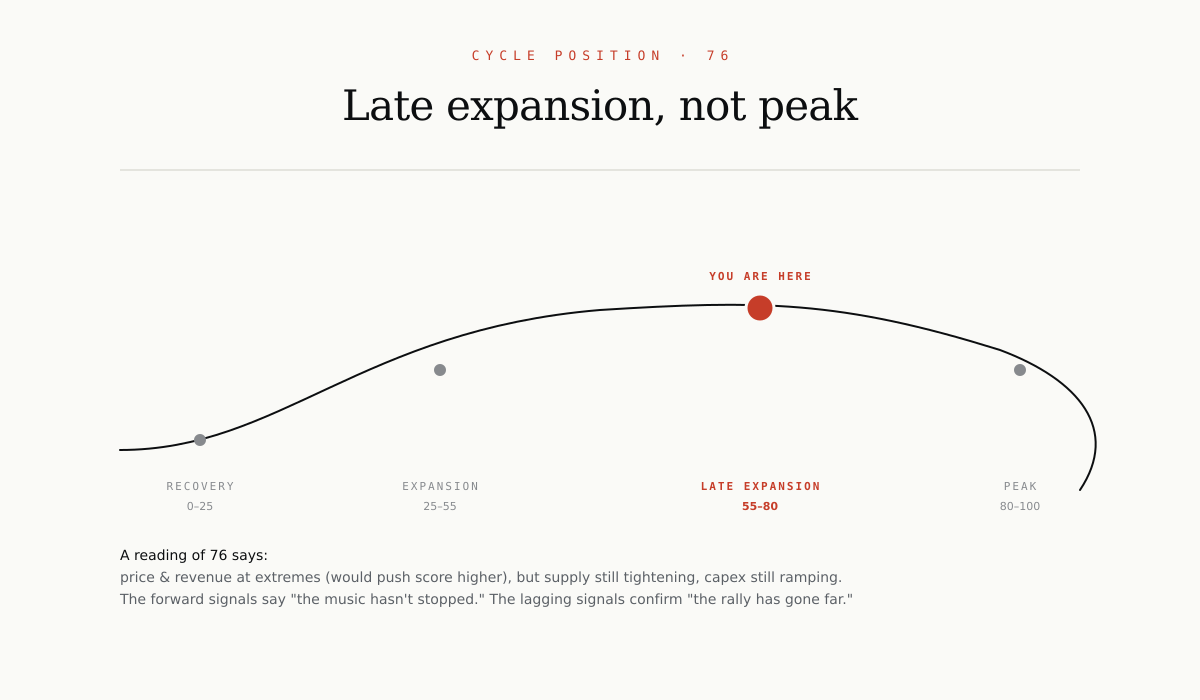
Those last two are the forward signals. Both are pointing the opposite direction from what the price extremes would suggest. If you weight all four equally — which is what our cycle composite does — you get a reading of 76 out of 100, which classifies as “Late expansion” rather than “Peak conditions.”
That’s a real distinction. Late expansion means: the rally has gone a long way, the music is still playing, and the things that would signal a top (rising inventory, capex flattening, revenue rolling over) haven’t happened yet. Peak conditions means: those things are happening. They are not the same.
A pure price-driven gauge would show you 90+ right now. Our cycle reading at 76 is lower — and we think more honest — because two of the four signals it’s aggregating are saying “the supply side is still catching up to demand.”
The AI vs broad-based split
There’s a second layer to this that makes a single semiconductor sentiment number misleading. The AI-led names and the broad-based cyclical names are running on completely different cycles right now.
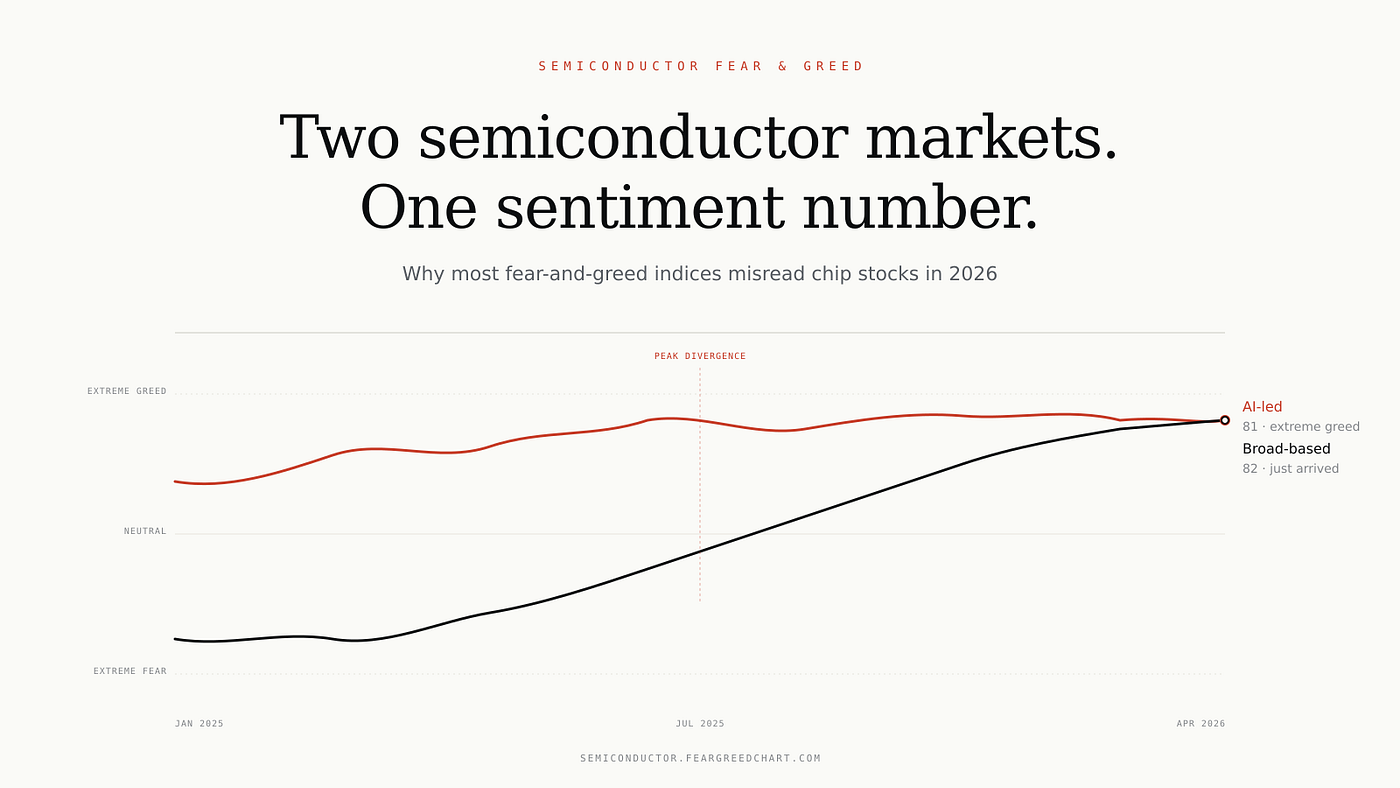
An AI infrastructure ticker basket (NVDA, AVGO, TSM, ASML, the HBM-exposed memory names) reads as Extreme Greed on our composite. A broad-based ticker basket (TXN, ADI, NXPI, MCHP, the analog/IDM cyclical names) also reads as Extreme Greed at the moment — but it got there for different reasons and via a different path. The AI gauge has been at extreme readings for over a year. The broad-based gauge spent most of 2025 in fear or neutral territory and has only recently rallied as the industrial demand recovery picked up.
Treating these as one market hides the regime. Memory pricing is bifurcated: HBM is sold out into 2027 with multi-quarter waitlists, while NAND is on a more conventional supply-demand cycle. Equipment cycles for advanced nodes look nothing like equipment cycles for trailing-edge analog. Korean and Taiwanese fabrication has different cyclical dynamics than US-based design.
The single “semiconductor index” is hiding most of this complexity. Our composite shows two parallel gauges — one for AI-led, one for broad-based — and they tell different stories.
The broader point
Most retail-facing sentiment tools were built for the equity market as a whole. They work well for that. They translate poorly to industries that are dominated by capital cycles rather than sentiment cycles.
If you’re investing in semiconductors — or even if you’re just trying to understand a sector that now contains four of the world’s ten most valuable companies — the questions worth answering are:
- Is the cycle still expanding, or are forward signals starting to roll?
- Is this an AI-specific story or a broad-based industrial recovery?
- Are inventory levels building (warning) or tightening (continued strength)?
- Is equipment capex accelerating (capacity ramp ahead) or flattening (cycle topping)?
- What is policy doing — export controls, tariffs, entity list actions — and to whom?
These are the questions a semiconductor-specific tool can answer. A generic fear-and-greed index can’t.
What we built
Semiconductor Fear & Greed is the product of trying to answer those questions for ourselves and concluding that retail investors deserve the same view.
The site combines:
- Daily-updating bifurcated sentiment composites (AI-led + broad-based)
- A four-signal cycle composite, two coincident and two forward-looking, with the forward signals derived from EDGAR 10-Q filings
- Memory pricing direction across DRAM, NAND, and HBM separately
- Universe-wide analyst recommendation breadth from Finnhub
- A curated US export controls and tariff timeline
- All 38 tracked tickers with 52-week range positioning and trend flags
Everything updates daily on cron. Methodology is transparent — every formula and data source is documented. The composite isn’t a black box.
It’s free, ad-free, and we built it because the existing tools don’t do what we needed.
DISCLAIMER: Educational information derived from publicly available sources. Not investment advice. The semiconductor sector is highly cyclical and individual stocks can move significantly on company-specific news. Always do your own research and consult a qualified financial advisor before making investment decisions.
Try it: semiconductor.feargreedchart.com
Follow along: @FearGreedChart
메타데이터
- post_id
- 3d03a9505d4e
- slug
- semiconductor-markets-why-most-sentiment-indicators-are-misreading-2026-3d03a9505d4e
- url
- https://medium.com/@feargreedchart/semiconductor-markets-why-most-sentiment-indicators-are-misreading-2026-3d03a9505d4e
- canonical_url
- https://medium.com/@feargreedchart/semiconductor-markets-why-most-sentiment-indicators-are-misreading-2026-3d03a9505d4e
- author_url
- https://medium.com/@feargreedchart
- status
- ok
- fetched_at
- 2026-06-11 05:11:55