🎯 Propensity Scores in Real-World Data: A Practical Guide for Researchers
Confounding is everywhere in real-world data (RWD). Propensity scores are one of the most powerful tools we have to fight back — and get…
🎯 Propensity Scores in Real-World Data: A Practical Guide for Researchers
Confounding is everywhere in real-world data (RWD). Propensity scores are one of the most powerful tools we have to fight back — and get closer to the truth.
If you’ve ever tried to estimate the effect of a treatment using EHRs, claims, or registry data, you know the challenge: patients who get a treatment are often different from those who don’t. Maybe they’re sicker, wealthier, or have better access to care.
This is confounding — and if you don’t handle it well, your conclusions can be misleading.
Enter propensity scores: a clever way to rebalance your treatment and control groups to make them more comparable, helping you isolate the treatment effect more accurately.
🧠 The Big Idea
At its core, a propensity score is the probability of receiving a treatment, given a patient’s observed covariates (age, comorbidities, performance status, etc.).
If two patients have the same propensity score, they had the same likelihood of being treated — even if only one actually was. That makes them ideal comparison points.
Propensity scores allow us to mimic randomized trials using observational data — at least on observed covariates.
🪜 Step-by-Step Workflow
- Estimate Propensity Scores
Use a model (often logistic regression) where the treatment is the outcome, and the predictors are potential confounders.
👉 Include:
- Variables that influence both treatment and outcome (i.e., true confounders)
- Variables that predict the outcome only (to reduce variance)
🚫 Avoid:
- Post-treatment variables (mediators, colliders)
- Instrumental variables (that influence treatment but not the outcome)
Pro tip: Use expert input, DAGs, and literature to build your confounder list. Convenience variables like age and gender are rarely enough.
- Check for Common Support
Before you apply the scores, check whether treated and control groups have overlapping propensity score distributions.
If there’s little or no overlap, you’re extrapolating — not comparing similar patients. In such cases, consider:
- Narrowing inclusion criteria
- Trimming or excluding extreme scores
- Switching from ATE to ATT or ATC
- Apply the Scores
Choose your method based on your estimand and study design:
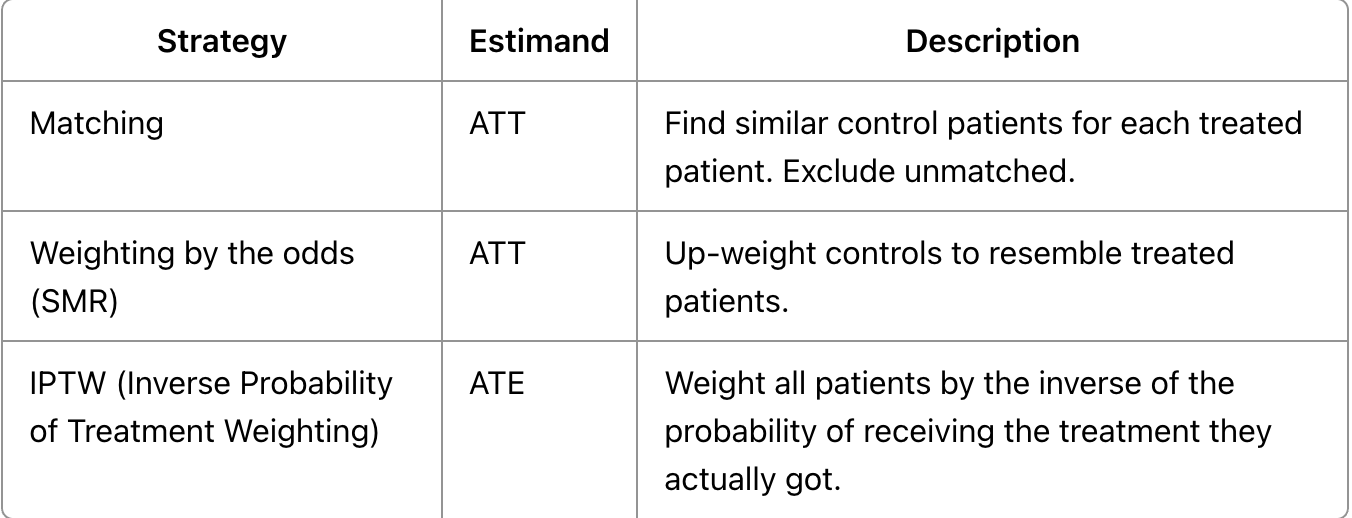
⚠️ Watch out for extreme weights in IPTW or SMR — they can dominate your analysis. Use stabilized weights or consider overlap weighting if needed.
- Evaluate Covariate Balance
Balance isn’t optional. After matching or weighting, check whether your covariates are balanced.
- ✅ Use standardized mean differences (SMDs) — ideally ≤0.1 for each covariate.
- 📊 Visualize using Love plots, histograms, or QQ plots.
- 🛠️ If balance isn’t achieved, revise your model or method (e.g., try spline terms or interaction effects).
Remember: achieving balance is more important than statistical significance of differences.
- Analyze the Outcome
Now that your groups are balanced:
- Use appropriate models (e.g., weighted survival analysis).
- For matching, use paired or stratified approaches.
- For weighting, account for variance inflation.
- And most importantly, stick to the estimand you planned — ATE, ATT, or ATC.
👍 Why Propensity Scores Are Powerful
- 🧪 Separate study design from analysis
- 🧹 Force rigorous checks on balance
- 🧩 Handle many covariates when outcomes are rare
- 📊 Translate well into visual, interpretable summaries
⚠️ But They’re Not Magic
- Don’t fix unmeasured confounding.
- Don’t work well without overlap.
- Don’t guarantee balance — you must check.
- Can become fragile if weights are extreme or groups are poorly matched.
🧠 Practical Tips
✔️ Pre-specify your analysis plan — including covariates and application strategy. ✔️ Don’t just throw the propensity score into a regression — it defeats the purpose. ✔️ Document all decisions and iterations transparently. ✔️ Balance is the goal — not p-values.
📚 Bonus: Tools and References
R packages: MatchIt, WeightIt, cobalt, twang, survey
Great Reads:
- Austin (2011) — Propensity Score Methods Overview
- Stuart (2010) — Matching Methods Review
- Chesnaye (2022) — IPTW in RWD
💡 Final Thoughts
Propensity scores are a cornerstone of modern real-world data analytics — but they’re only as good as your covariate selection, overlap, and balance checks. Use them thoughtfully, and they’ll bring you closer to causal truth in messy observational data.
메타데이터
- post_id
- 3e2a3a8ebda1
- slug
- propensity-scores-in-real-world-data-a-practical-guide-for-researchers-3e2a3a8ebda1
- url
- https://medium.com/@dineshkumarm740/propensity-scores-in-real-world-data-a-practical-guide-for-researchers-3e2a3a8ebda1
- canonical_url
- https://medium.com/@dineshkumarm740/propensity-scores-in-real-world-data-a-practical-guide-for-researchers-3e2a3a8ebda1
- author_url
- https://medium.com/@dineshkumarm740
- status
- ok
- fetched_at
- 2026-06-09 15:37:30





