Getting Started with SPL (Search Processing Language) in Splunk
During my SOC internship, one of the tasks I worked on was exploring the basics of SPL (Search Processing Language) inside Splunk…
Getting Started with SPL (Search Processing Language) in Splunk
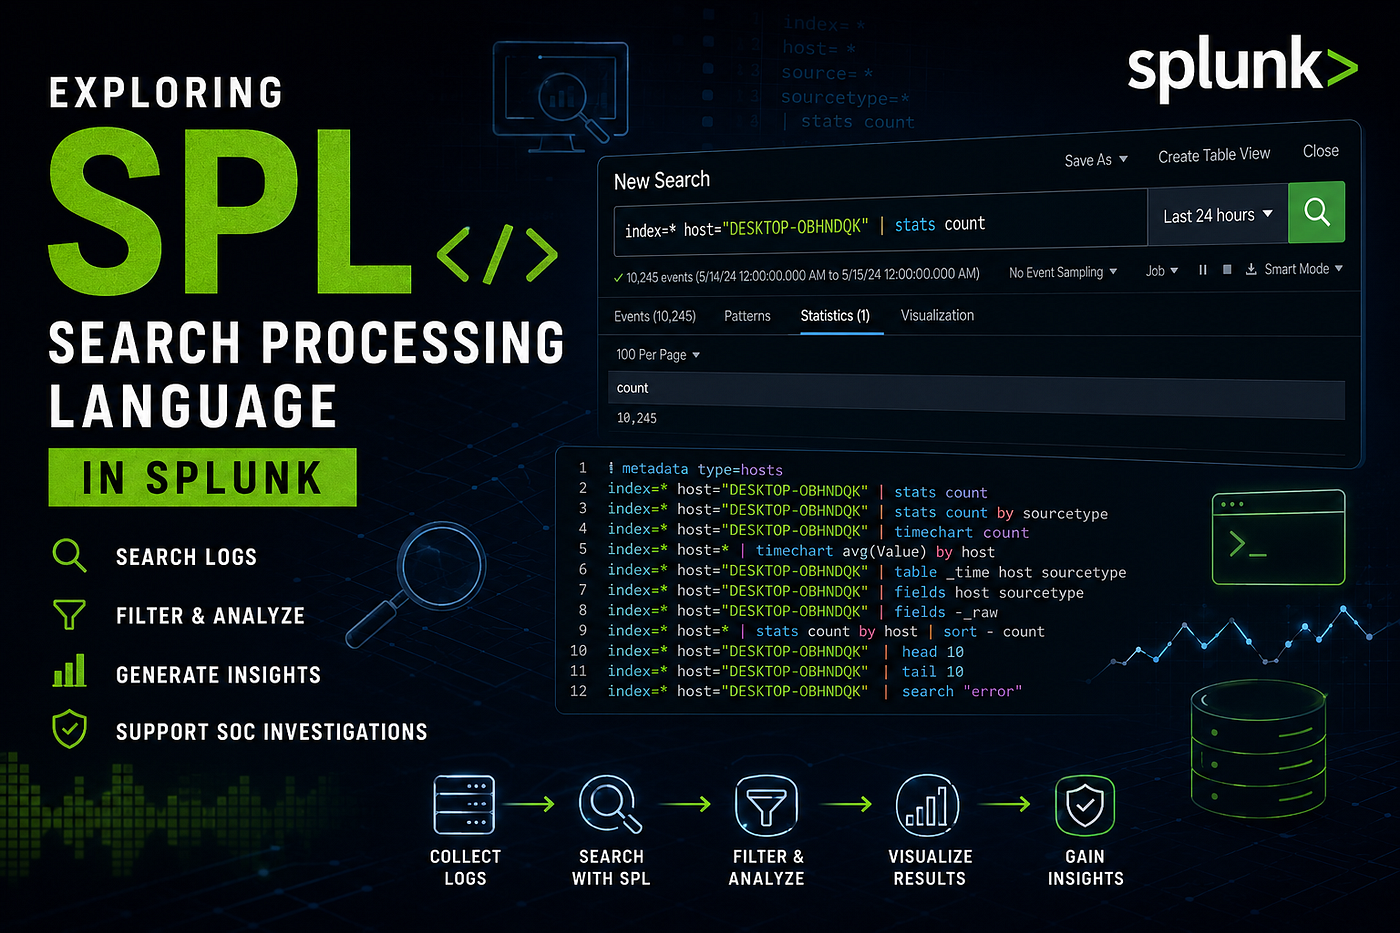
During my SOC internship, one of the tasks I worked on was exploring the basics of SPL (Search Processing Language) inside Splunk Enterprise.
This task mainly focused on understanding how security analysts search, filter, and analyze logs inside Splunk using queries. Since Splunk is widely used in SOC environments for monitoring and investigations, learning SPL gave me a better understanding of how analysts work with security data on a daily basis.
What is SPL?
SPL, or Search Processing Language, is the query language used in Splunk to search and analyze machine-generated logs.
It allows analysts to:
- Search specific events
- Filter logs
- Organize data
- Generate statistics
- Create visualizations
- Investigate suspicious activity
Most of the work is done inside Splunk’s Search & Reporting section, where queries can be written to explore different types of logs collected from systems and endpoints.
Objective of the Task
The main goal of this exercise was to become familiar with basic SPL queries and understand how they are used in real-world monitoring scenarios.
Through this task, I learned how to:
- Search logs from a specific host which is my local machine
- Count and organize events
- Display data in tables
- Filter fields
- Search for errors
- Analyze logs based on time intervals
Environment Used
Tools
- Splunk Enterprise
- Windows Server
Exploring Basic SPL Queries
Viewing Available Hosts

| metadata type=host
| metadata type=hostThis query displays the list of hosts currently sending logs to Splunk.
It is useful for checking whether systems are actively forwarding logs and verifying connected machines inside the environment.
2. Counting Total Events

index= host=”DESKTOP” | stats count*
index=* host="DESKTOP" | stats countDisplays the total number of events collected from the specified host.
3. Counting Events by Source Type

index= host=”DESKTOP” | stats count by sourcetype*
index=* host="DESKTOP" | stats count by sourcetypeGroups and displays the number of events based on source type such as Security Logs, System Logs, or Application Logs.
4. Viewing Events Over Time

index= host=”DESKTOP” | timechart count*
index=* host="DESKTOP" | timechart countCreates a timeline view of events to help analyze activity trends over time.
5. Average Value by Host

index= host= | timechart avg(Value) by host
index=* host=* | timechart avg(Value) by hostDisplays the average value for different hosts over time intervals. Commonly used for monitoring performance metrics.
6. Displaying Specific Fields in Table Format

index= host=”DESKTOP” | table _time host sourcetype*
index=* host="DESKTOP" | table _time host sourcetypeDisplays selected fields in a clean table format for easier analysis and readability.
7. Filtering Specific Fields

index= host=”DESKTOP” | fields host sourcetype*
index=* host="DESKTOP" | fields host sourcetypeFilters the results and displays only the selected fields from the logs.
8. Excluding Raw Log Data

index= host=”DESKTOP” | fields — _raw*
index=* host="DESKTOP" | fields - _rawRemoves the raw log content from the output while displaying all other available fields.
9. Sorting Event Counts by Host

index= host= | stats count by host | sort — count
index=* host=* | stats count by host | sort - countCounts events by host and sorts them in descending order based on event count.
10. Displaying the First 10 Events

index= host=”DESKTOP” | head 10*
index=* host="DESKTOP" | head 10Displays the first 10 matching events from the search results.
11. Displaying the Last 10 Events

index= host=”DESKTOP” | tail 10*
index=* host="DESKTOP" | tail 10Displays the last 10 matching events from the search results.
12. Searching for Specific Keywords

index= host=”DESKTOP” | search “error”*
index=* host="DESKTOP" | search "error"Searches the logs for the specified keyword or string, such as "error".
What I Learned from This Task
This task gave me practical exposure to how analysts interact with logs inside Splunk.
Some of the key things I learned include:
- Basic SPL syntax
- Searching and filtering logs
- Organizing log data
- Visualizing events over time
- Understanding how SIEM platforms process information
More importantly, it helped me understand how log analysis supports monitoring and investigations in a SOC environment.
Conclusion
Exploring basic SPL gave me a better understanding of how Splunk works as a SIEM platform and how security analysts use queries to investigate logs and monitor systems.
Although these were basic queries, they helped me build a strong foundation in searching and analyzing logs, which is an essential part of SOC operations and cybersecurity monitoring.
메타데이터
- post_id
- 3e2ed5553479
- slug
- getting-started-with-spl-search-processing-language-in-splunk-3e2ed5553479
- url
- https://medium.com/@ashwanthd.mech/getting-started-with-spl-search-processing-language-in-splunk-3e2ed5553479
- canonical_url
- https://medium.com/@ashwanthd.mech/getting-started-with-spl-search-processing-language-in-splunk-3e2ed5553479
- author_url
- https://medium.com/@ashwanthd.mech
- status
- ok
- fetched_at
- 2026-07-13 16:37:20