Steering Towards Safety: How Specific Features Influence Car Safety Ratings
Introduction
Steering Towards Safety: How Specific Features Influence Car Safety Ratings by Body Type
Introduction
In the quest for automotive excellence, vehicle safety remains a paramount concern. With advancements in technology, understanding which safety features most significantly contribute to achieving top safety ratings, especially across different body types of cars, has become increasingly important. This analysis explores this crucial aspect, leveraging comprehensive vehicle data to determine the pivotal safety features that lead to 5-star overall safety ratings in order for manufacturers to produce safer vehicles for the market.
Data Collection
Our journey began with the National Highway Traffic Safety Administration (NHTSA) API, a rich repository of data on various vehicle models. We meticulously gathered data, focusing on the intricate details of body types, safety features, and overall safety ratings. The process involved navigating through vast datasets, ensuring accuracy and relevance to our research question. The default year that was analyzed was 2022 just to gain that certainty of having all the information for a model year; also a list of major auto makers was used and iterated through in order to be used in finding the necessary data for makes and models in the API endpoint. This step was crucial in laying a solid foundation for our subsequent analysis. When it came to handling and managing the data the “requests” library was used in order to pull the data from the API while “pandas” helped to briefly display some of the contents and the structure of the data. For the more advanced visualizations “seaborn” and “matplotlib” were used to offer a more detailed display of the data after cleaning and formatting its contents. However, there were some challenges as per determining which visualizations would be able to effectively unveil the hidden insight as per whether or not certain aspects of a safety rating would hold more weight in determining a vehicles overall rating.
Exploratory Data Analysis
The initial phase of our analysis involved categorizing vehicles by body type and assessing their distribution in terms of overall safety ratings. However, being able to extract the body type of a vehicle from the “VehicleDescription” column in the initial data frame was another roadblock that occurred. Furthermore, the overall rating which is the 1–5 star rating, was within a different endpoint and needed to be joined with the rest of the data properly. So firstly, the body type was extracted using a regular expression and a new column was created called “BodyType”.
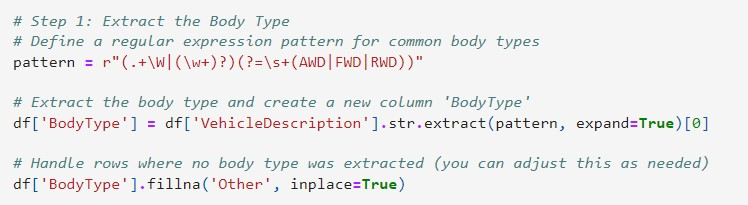
Then in order to get the overall rating from the other endpoint and merge it with the rest of the data, the “VehicleId” was used as a primary key that would pull the proper rating for each vehicle based on its ID

This process unveiled intriguing patterns, particularly noting those body types that frequently achieved 5 stars. We then delved deeper, examining the common safety features in these high-rated vehicles. This exploration was not just about numbers and ratings; it was a quest to uncover the hidden relationships between design elements and safety efficacy.
Results and Insights
There were indeed challenges in determining a proper method for visualizing the data as the plan was to get the average safety ratings for each body type was displayed and then getting the average rating for each separate rating was the plan to measure the significance of each type of rating. So, among each overall rating there are other features within that rating as seen with the features to check below.

The goal would be to see which feature is consistently rated high and thus seeing which feature is most important in why vehicles received a 5-star rating.
One of the initial visualizations used was a bar plot analysis of “Average Safety Ratings by Make Model and Body Type” was created however this method was messy and didn’t show much usable information.

Barring this illegibility and messiness of this visualization, a boxplot was made instead and thus offered a cleaner more detailed preview into the data.

In this visual it is seen that SUVs have the most 5-star ratings but it's also evident that there are more SUVs present in comparison among the other body types.
The categorical feature analysis assisted further in gaining a better understanding of the data as it pertains to each feature, and here perhaps was where a noticeable trend was found, and this trend was somewhat apparent but was made more noticeable in this portion of the analysis in particular. Below will be a number of the visualizations for each feature that was checked and perhaps you as the viewer will be able to see it as well.


Now as seen with some of these ratings, there is a large number of “Not Rated” values present. It is unknown why this may be the case but it clear to see that won’t help us to effectively gauge the insight we are looking for. A brief numerical summary below gives more detail for each of the features that were checked.

Now there could be several things going on as it pertains to the disruption in attaining our desired findings. Firstly, all the data for each body type may not be present and using the metric of the average may also be something that is skewing the results as some of the “not rated” string values in the boxplot were converted to zero. Second with these visuals we don’t see the ratings as it pertains to each body type which could have been more useful, however this does guide us into asking which feature is the most important feature in attaining a 5-star rating across all vehicles. Thirdly this data takes into account various types of vehicles other than the common SUVs, Sedans, Trucks, Coupes, and Hatchbacks; these other body types are included with the data which are more than likely affecting the results. Many questions arise as per whether these manufacturers are testing these cars and not reporting these numbers or whether they are not testing these cars as well perhaps due to lack of funds to conduct these tests. If it is the case that these numbers are simply not being reported perhaps because they have a poor rating, then defaulting the not rated values in this analysis to zero is fair as the manufacturer is actively hiding these values and putting customers at risk in purchasing an unsafe vehicle. On the other hand, if it is due to funds this is more understandable but that is also concerning as the question needs to be asked if they don’t have the funds to test a vehicle in an effort to cut cost, where else are cost cutting measures taking place?
But taking into account our question, given these visualizations it is not just the matter of which safety feature is the most important but rather how consistent are these features being reported, or even tested as a matter of fact, for the NHTSA. If we go by what we know to answer our question, then I would say it is a lot more likely that a car has a high safety rating if not only they consistently get 5-stars but also if they consistently report it.
Conclusion
The data could have very well been expounded upon in looking for information as it pertains to each body type, perhaps with numerous boxplots for the features checked and each body type as done with the overall rating and the body type. The main thing we know is that these vehicles have high ratings because they were reported and made available in the API. The insights found for each crash rating does show that it’s important for these vehicles to go through the necessary protocol in acquiring the best possible ratings for each feature present, and also give insight into the practices of automakers as it pertains to safety. They also offer consumers a lens through which to assess vehicle safety, beyond the conventional metrics, but ultimately it is made apparent that automakers will need to do a better job in providing this information for potential buyers in the market looking to purchase a vehicle in the upcoming 2024 model year.
Feel free to check out the code for this analysis on my Github below:
메타데이터
- post_id
- 3e477a441c69
- slug
- steering-towards-safety-how-specific-features-influence-car-safety-ratings-3e477a441c69
- url
- https://medium.com/inst414-data-science-tech/steering-towards-safety-how-specific-features-influence-car-safety-ratings-3e477a441c69
- canonical_url
- https://medium.com/inst414-data-science-tech/steering-towards-safety-how-specific-features-influence-car-safety-ratings-3e477a441c69
- author_url
- https://medium.com/@jeadjani
- status
- ok
- fetched_at
- 2026-06-28 10:39:35