Batch is Dead: Building a Real-Time Ad Click Engine in a Weekend
If you are still running batch jobs overnight to calculate ad click metrics and billing data, you are lighting money on fire. Advertisers…
Batch is Dead: Building a Real-Time Ad Click Engine in a Weekend
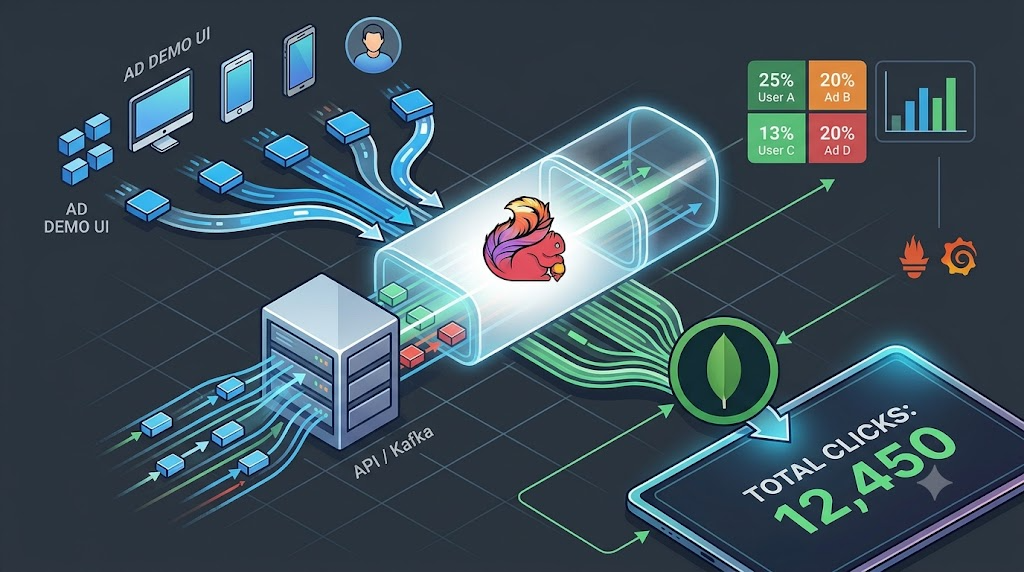
Simple Flink pipeline
If you are still running batch jobs overnight to calculate ad click metrics and billing data, you are lighting money on fire. Advertisers want to see their click-through rates and budget consumption in real time, not tomorrow morning. This weekend, I built a fully local, containerized proof-of-concept on a Kubernetes kind cluster to show exactly how to stream, aggregate, and visualize this data with sub-minute latency.
The Architecture
The data flow is a straightforward, decoupled pipeline. We capture click events from a fake user-facing application, publish them to a message broker, aggregate them statefully over time windows, and sink the results into a fast-access database for the frontend dashboard to consume.
[Ad Demo UI] -> POST -> [Click API] -> [Kafka (ad-clicks)]
                                             |
                                             v
[Report UI] <--- [MongoDB] <--- [Flink Custom Sink]
Every single component runs inside a local kind (Kubernetes in Docker) cluster, fronted by an NGINX ingress controller. A single deployment script spins up everything, including a Prometheus and Grafana stack to monitor queue lag and processing latency.
The backend API is designed for maximum throughput. When a user clicks an ad, the Node.js API receives the event, publishes it to the “ad-clicks” Kafka topic using the KafkaJS producer, and immediately returns an HTTP 202 Accepted status. This fire-and-forget pattern prevents slow database writes or downstream bottlenecks from blocking the user interface.
The Star of the Show — Apache Flink
You might wonder why I picked Apache Flink over something like Spark Streaming or Kafka Streams. Spark Streaming is micro-batching by nature, which adds artificial latency that accumulates at scale. Kafka Streams is excellent if your entire ecosystem is Kafka-native, but managing complex state and writing to external databases like MongoDB requires writing a lot of custom boilerplate plumbing.
Flink treats data as a continuous stream of individual events, giving you true low-latency processing alongside powerful out-of-the-box windowing operators. For this POC, our Flink job reads raw click events from the Kafka topic. It immediately keys the stream by a composite of user ID and ad ID, then groups them into a 60-second tumbling processing-time window.
This means every 60 seconds, Flink aggregates the click count, the first click timestamp, and the last click timestamp for each unique user-ad pair. Here is what that processing topology looks like in Java:
DataStream<ClickEvent> clicks = env.fromSource(
    kafkaSource,
    WatermarkStrategy.noWatermarks(),
    "Kafka Source"
);

clicks.keyBy(click -> click.getUserId() + "_" + click.getAdId())
      .window(TumblingProcessingTimeWindows.of(Time.minutes(1)))
      .aggregate(new ClickAggregator(), new ClickWindowFunction())
      .addSink(new MongoUpsertSink());
Once the window closes, Flink emits the aggregated record. But writing directly to MongoDB introduces a classic streaming challenge: network flakiness and job restarts can cause duplicate writes. To make our pipeline completely idempotent, the custom RichSinkFunction uses a MongoDB upsert operation.
Instead of generating a random document ID, we build a deterministic custom ID based on the window itself:
// The MongoDB upsert filter
Document filter = new Document("_id", userId + "_" + adId + "_" + windowStart);
If a network glitch causes Flink to re-emit a window, MongoDB simply updates the existing record instead of inserting a duplicate. Our application state is kept in an in-memory HashMapStateBackend, which is checkpointed every 30 seconds to the local filesystem for basic fault tolerance.
The Demo UIs

Demo UI screen
To see this pipeline in action, we need actual traffic. The first piece of our frontend is the Ad Demo UI, acting as a mock newspaper site called “MyNewsPaper Times”. It displays six clickable banner ads for popular tech services like AWS Cloud Suite, DataDog APM, and MongoDB Atlas.
A user dropdown at the top lets you switch between five simulated users, such as Alice, Bob, and Carol, so you can mimic real multi-user activity. Clicking an ad triggers a fire-and-forget POST request to the Click API.
On the other side of the pipeline sits the Report UI dashboard. It reads the aggregated windows directly from MongoDB 7.0 and automatically refreshes every ten seconds.

Demo report UI screen
The dashboard features an overview screen showing the total click share per ad, a sorted leaderboard, and a full cross-reference matrix mapping users to the specific ads they clicked. Because Flink holds the events in a 60-second tumbling window, you can watch the dashboard and see your clicks populate in chunks exactly every 60 to 65 seconds.
One Gotcha Worth Mentioning
When deploying a multi-service stack behind an NGINX ingress on Kubernetes, path rewrites will eventually bite you. In our local cluster, the ingress routes traffic to the correct backend using paths like /ads and /reports.
By default, NGINX strips those path prefixes before forwarding the request to the underlying Node.js service. If your backend Express application expects all its internal API routes to start from the root, but your frontend is calling /reports/api/data, routing fails.
I solved this by designing the Express routing to handle both contexts. Your backend routes should accept both the prefixed and stripped versions of the paths. This ensures that local direct testing and ingress-routed production traffic both resolve to the correct controller.
Moving This Setup to Production
While running this entire stack on a laptop inside a kind cluster is great for debugging, a production deployment requires a few architecture upgrades.
First, the in-memory state backend will run out of RAM if you have millions of active users and longer window durations. For production, you should swap this out for the RocksDB state backend, which spills state to local disk and backs it up asynchronously to an object store like AWS S3.
Second, our Kafka setup runs in KRaft mode. This is actually production-ready and highly recommended over the legacy Zookeeper setup, as it greatly simplifies cluster administration and metadata replication.
Finally, you would scale out the Flink cluster. Instead of a standalone local job manager, you would deploy Flink on a managed service or use the Flink Kubernetes Operator, adjusting task slots and parallelisms to match the partition count of your Kafka input topic.
Running It Locally
Building this end-to-end pipeline proves that stateful stream processing does not have to be an over-engineered black box. With a few dozen lines of Flink code and an idempotent database sink, you can replace stale nightly batch jobs with a sub-minute analytics engine.
You can find the complete source code, deployment manifests, and local setup scripts in this GitHub repository: https://github.com/kiran-pawar-blogger/flink-ad-click-analytics.
Clone the repository, run the startup script, click a few ads, and watch your real-time analytics come to life.
Observability Stack

Apache Flink dashboard

Graffana Dashboard
To see what is happening under the hood, the local cluster exposes the Flink Web UI and a pre-configured Grafana dashboard via the ingress.
Opening the Flink UI lets you inspect the physical execution graph, track the exact backpressure on the custom MongoDB sink, and watch the tumbling windows actively collect state before emitting. Right next to it, the Grafana dashboard pulls metrics from the Percona MongoDB exporter and the Click API, showing you raw throughput, Kafka publish latency, and system health in real time. It changes the project from a simple code spike into a fully observable production blueprint.
메타데이터
- post_id
- 3ee4ab0f4501
- slug
- batch-is-dead-building-a-real-time-ad-click-engine-in-a-weekend-3ee4ab0f4501
- url
- https://medium.com/@meaningfulblogger9/batch-is-dead-building-a-real-time-ad-click-engine-in-a-weekend-3ee4ab0f4501
- canonical_url
- https://medium.com/@meaningfulblogger9/batch-is-dead-building-a-real-time-ad-click-engine-in-a-weekend-3ee4ab0f4501
- author_url
- https://medium.com/@meaningfulblogger9
- status
- ok
- fetched_at
- 2026-07-21 04:28:33