Graphs in Android Apps
USING MPANDROIDCHART LIBRARY
Graphs in Android Apps
USING MPANDROIDCHART LIBRARY
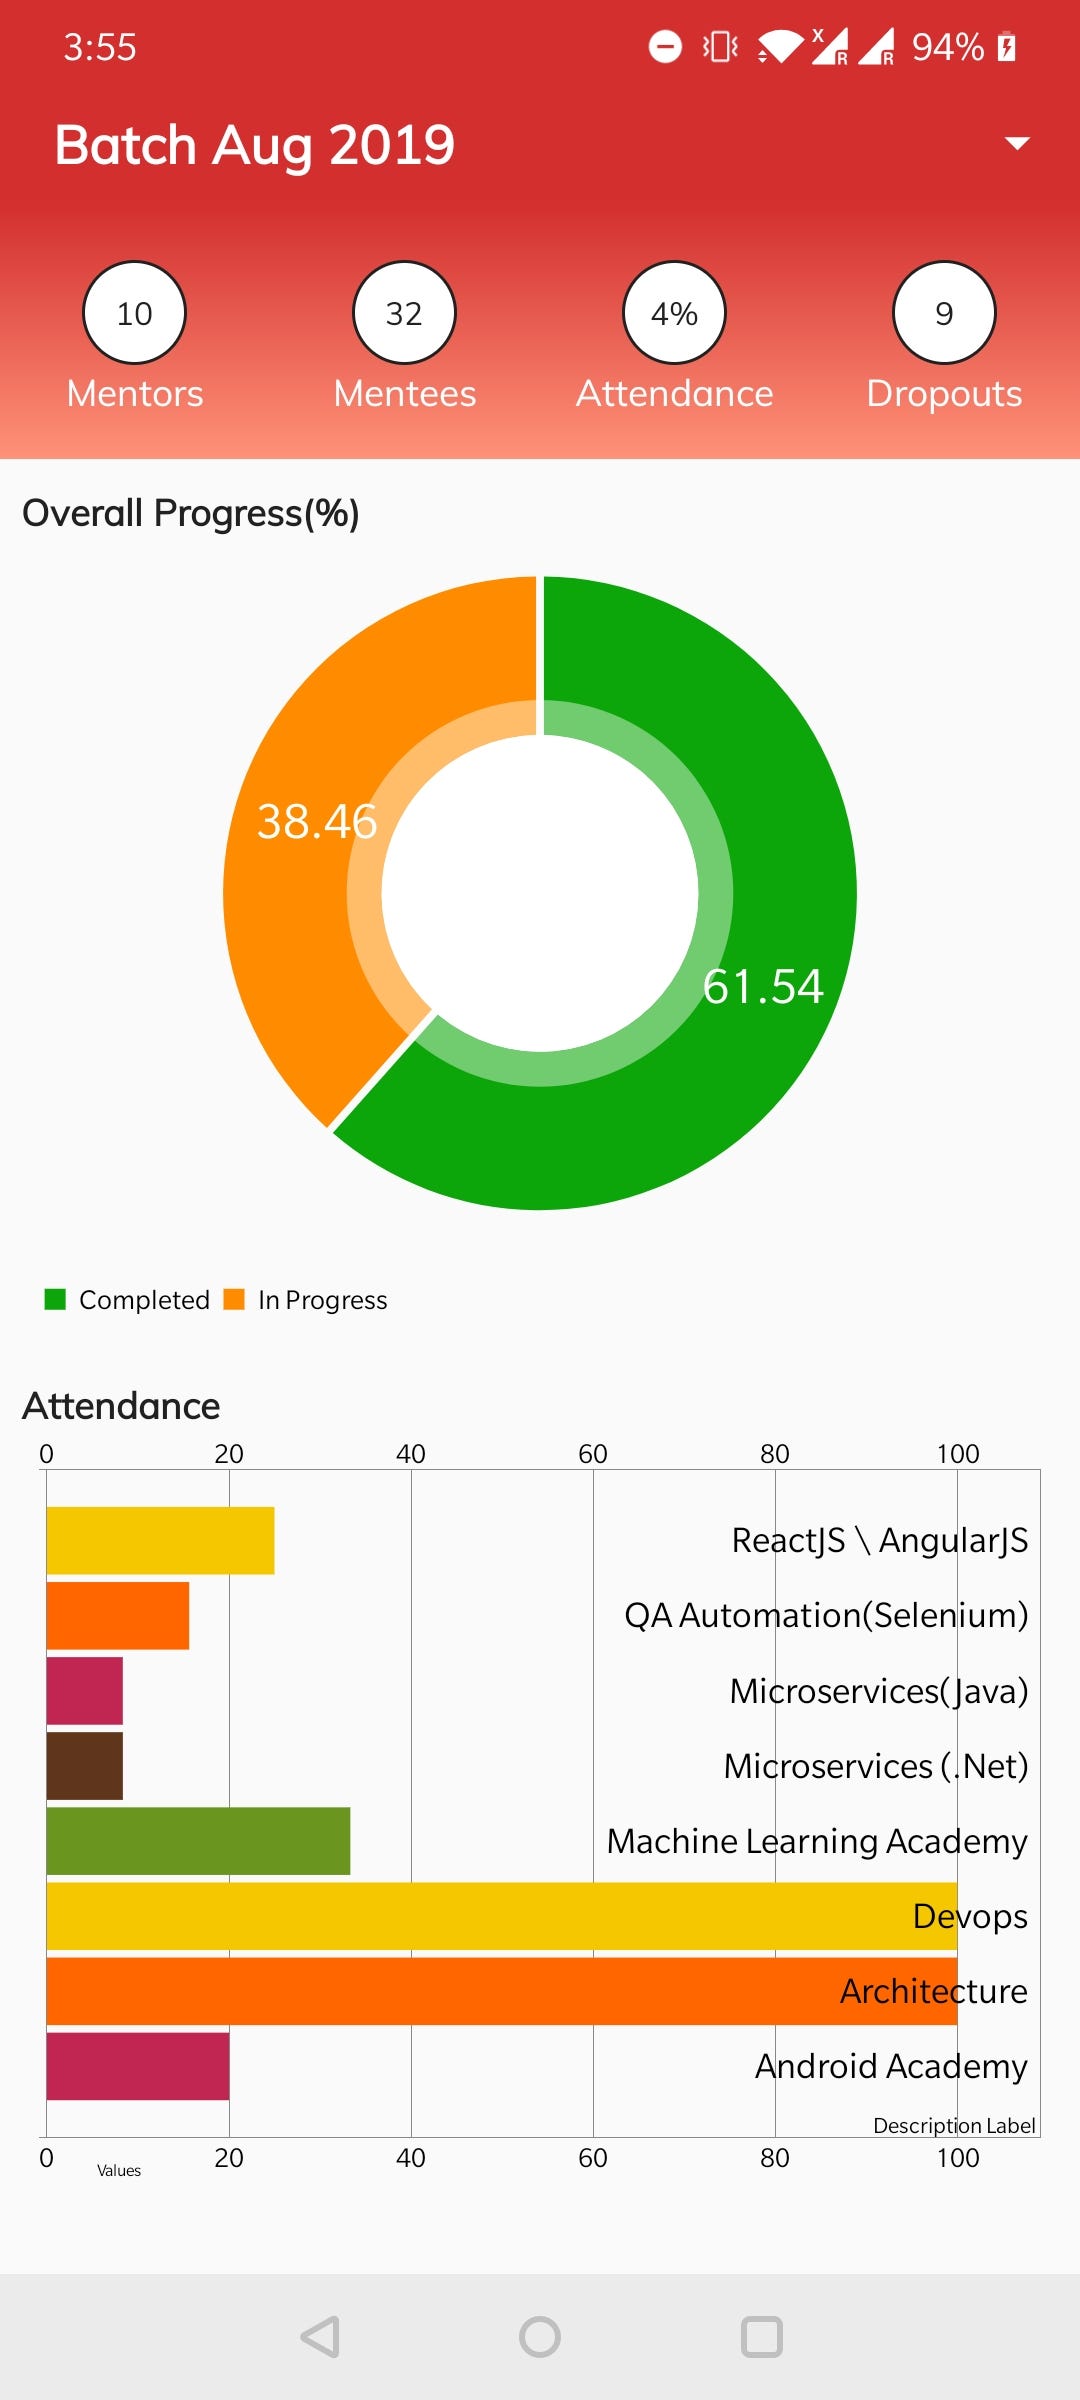
MPAndroid chart is a free Library by Philipp Jahoda (PhilJay). It is an easy to use library, designed for Android platform. It provides us the following options for the charts :
Bar Chart Bar Chart with base Bubble Chart Candlestick Chart Horizontal Bar Chart Line Chart Pie Chart Radar Chart Pie radar Chart base Scatter Chart Combined Chart
Gradle Setup:
Add the following dependencies inbuild.gradle project level
allprojects {
 repositories {
 maven { url ‘https://jitpack.io' }
 }
}
allprojects {
repositories {
maven { url ‘https://jitpack.io' }
}
}Add the following dependencies in build.gradle app level :
implementation ‘com.github.PhilJay:MPAndroidChart:v3.0.3’For Horizontal Bar Chart :
Now let’s create activity_main.xmlfor the chart to be displayed :
<com.github.mikephil.charting.charts.HorizontalBarChart
    android:id="@+id/id_horizontal_barchart"
    android:layout_width="match_parent"
    android:layout_height="wrap_content"
    android:layout_marginBottom="@dimen/dp_20">
</com.github.mikephil.charting.charts.HorizontalBarChart>
The function in java class to inflate the horizontal bar chart :
public static void barchart(BarChart barChart, ArrayList<BarEntry> arrayList, final ArrayList<String> xAxisValues) {
    barChart.setDrawBarShadow(false);
    barChart.setFitBars(true);
    barChart.setDrawValueAboveBar(true);
    barChart.setMaxVisibleValueCount(25);
    barChart.setPinchZoom(true);

    barChart.setDrawGridBackground(true);
    BarDataSet barDataSet = new BarDataSet(arrayList, "Values");
    barDataSet.setColors(ColorTemplate.COLORFUL_COLORS);
    BarData barData = new BarData(barDataSet);
    barData.setBarWidth(0.9f);
    barData.setValueTextSize(0f);

    barChart.setBackgroundColor(Color.TRANSPARENT); //set whatever color you prefer
    barChart.setDrawGridBackground(false);

    Legend l = barChart.getLegend(); // Customize the ledgends
    l.setTextSize(10f);
    l.setFormSize(10f);
//To set components of x axis
XAxis xAxis = barChart.getXAxis();
xAxis.setTextSize(13f);
xAxis.setPosition(XAxis.XAxisPosition.TOP_INSIDE);
xAxis.setValueFormatter(new IndexAxisValueFormatter(xAxisValues));
xAxis.setDrawGridLines(false);
barChart.setData(barData);
}Calling the above function to create the chart :
We need to create the list of type BarEntry (consisting of positions and values), a BarChart and an optional list of titles on X axis.
private HorizontalBarChart mBarChart;mBarChart = findViewById(R.id.id_horizontal_barchart);// PREPARING THE ARRAY LIST OF BAR ENTRIESArrayList<BarEntry> barEntries = new ArrayList<>();barEntries.add(new BarEntry(1f, VALUES_TO_BE_ADDED)));
barEntries.add(new BarEntry(2f, VALUES_TO_BE_ADDED)));
barEntries.add(new BarEntry(3f, VALUES_TO_BE_ADDED)));
barEntries.add(new BarEntry(4f, VALUES_TO_BE_ADDED)));}// TO ADD THE VALUES IN X-AXIS
ArrayList<String> xAxisName = new ArrayList<>()'
xAxisName.add("Name 1");
xAxisName.add("Name 2");
xAxisName.add("Name 3");
xAxisName.add("Name 4");barchart(mBarChart,barEntries,xAxisName);For Pie Chart :
Let’s create activity_main.xmlfor the chart to be displayed
<com.github.mikephil.charting.charts.PieChart
    android:id="@+id/pie_chart"
    android:layout_width="match_parent"
    android:layout_height="wrap_content">
</com.github.mikephil.charting.charts.PieChart>
The function in java class to inflate the Pie chart :
public static void piechart(PieChart piechart, ArrayList<PieEntry> arrayList) {
    piechart.setUsePercentValues(true);
    piechart.getDescription().setEnabled(false);
    piechart.setExtraOffsets(2, 5, 2, 2);
    piechart.setDragDecelerationFrictionCoef(0.95f);
    piechart.setDrawHoleEnabled(true);
    piechart.setHoleColor(Color.WHITE);
    piechart.setTransparentCircleRadius(61f);
    PieDataSet pieDataSet = new PieDataSet(arrayList, " ");
    pieDataSet.setSliceSpace(3f);
    pieDataSet.setSelectionShift(5f);
// Custom colors to in the pie chart int[] colors = {Color.rgb(13, 166, 10), Color.rgb(255, 140, 0)};
ArrayList<Integer> arrayList1 = new ArrayList<>();
for (int c : colors) {
arrayList1.add(c);
}
pieDataSet.setColors(arrayList1);
pieDataSet.setColors(ColorTemplate.createColors(colors));
PieData pieData = new PieData((pieDataSet));
pieData.setValueTextSize(18f);
pieData.setValueTextColor(Color.WHITE);
piechart.setData(pieData);
piechart.setCenterTextSize(30f);
piechart.setDrawEntryLabels(false);
piechart.animateY(1000, Easing.EaseInOutCubic);
}Calling the above function to create the chart :
We need to create the list of type PieEntry (consisting of positions and values), a Pie Chart.
private PieChart mPieChart;mPieChart = findViewById(R.id.piechartSession);ArrayList<PieEntry> dataList= new ArrayList<>();
sessDataPie1.add(new PieEntry(DATA_TO_BE_ENTERED, "Data 1"));
sessDataPie1.add(new PieEntry(DATA_TO_BE_ENTERED, "Data 2"));
sessDataPie1.add(new PieEntry(DATA_TO_BE_ENTERED, "Data 3"));piechart(mPieChart,sessDataPie1);NOTE : DATA HAS BEEN ADDED JUST TO DEMONSTRATE HOW THE FUNCTION WORKS. DATA IN MY APP WAS FETCHED FROM THE CLOUD. YOU CAN CREATE YOUR OWN DATA AS PER YOUR REQUIREMENTS.
메타데이터
- post_id
- 3f2bf8baa4cf
- slug
- graphs-in-android-apps-3f2bf8baa4cf
- url
- https://medium.com/@anant-raman/graphs-in-android-apps-3f2bf8baa4cf
- canonical_url
- https://medium.com/@anant-raman/graphs-in-android-apps-3f2bf8baa4cf
- author_url
- https://medium.com/@anant-raman
- status
- ok
- fetched_at
- 2026-07-14 23:49:41