NTPC Limited: A Fundamentally Strong and Future-Ready Power Giant
An in-depth analysis of NTPC’s financial performance, operational efficiency, and future growth potential through fundamental and technical…
NTPC Limited: A Fundamentally Strong and Future-Ready Power Giant
An in-depth analysis of NTPC’s financial performance, operational efficiency, and future growth potential through fundamental and technical evaluation.
NTPC Limited is India’s largest power-generating company and a Maharatna PSU under the Ministry of Power. Since its inception in 1975, it has expanded from coal-based power generation into renewables, gas, nuclear, coal mining, and project consultancy. As of March 31, 2023, NTPC has an installed capacity of 77,393 MW, with 69.6% from coal, 5.2% from gas, and a growing share in renewables. The company aims to reach 60 GW of renewable capacity by 2032, with plans for steady yearly additions. Under CMD Gurdeep Singh, NTPC is focusing on decarbonization, efficiency, and digital innovation. It also partners in nuclear energy projects and is active in international ventures. The shareholding pattern reflects strong institutional backing, with the Government of India holding 51.23%. NTPC’s future strategy includes clean energy expansion, global growth, and smart energy solutions, while maintaining its leadership in thermal power.
· Price Performance and Outlook: NTPC is a stable stock with long-lasting returns and performs lesser volatile movements. Being the largest producer of electricity in India, strong revenues and government support make NTPC’s stock a low-risk investment.
· Valuation & Fundamentals: The company offers attractive dividend yields, thanks to its impressive fundamentals characterized by high profitability and steady cash flows arising from long-term power purchase agreements with state electricity boards, making it essentially safe.
· Growth Potential: Generally, NTPC has decided to diversify into solar, wind, and green hydrogen projects to cut down its reliance on coal-based power generation in light of India’s push towards renewable energy. With this, long-term growth prospects will also open up.
· Volatility and Risks: Still, NTPC’s risk exposure remains moderate, largely due to regulatory risk, fuel supply constraints, and policy change risks. However, steady operational performance has saved shareholders from a bout of major volatility.
Production and Operational Capacity:
NTPC accounts for 17% of the total capacity in India, with a contribution of 25% of total generation owing to upper efficiency for all operational units as on March 31,2023
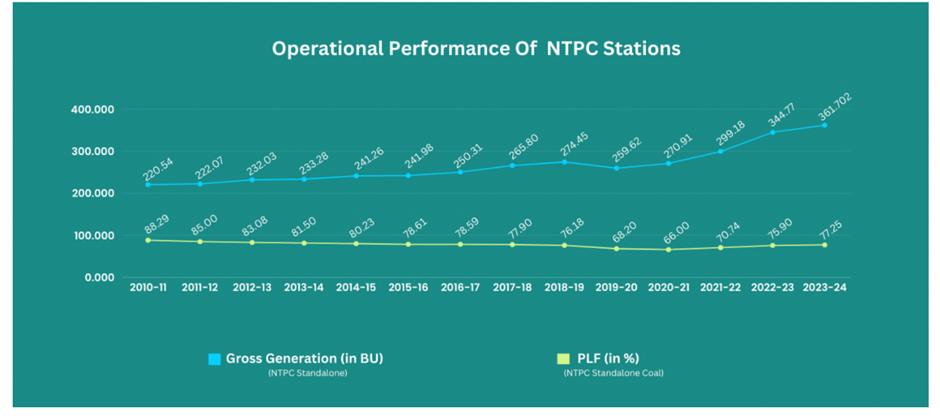
Source: NTPC Official Site
- Coal Power: As on March 31, 2023, NTPC has a total installed capacity of 77,393.18 MW, of which 53,850 MW is from coal. This constitutes approximately 69.6% of NTPC’s total capacity.
- Gas Power: NTPC’s gas-based power stations, of which seven have undertaken the initiative, contribute 4,017 MW, representing about 5.2% of its total installed capacity.
- Renewable Energy: NTPC is committed to achieving a targeted installation of 60 GW of renewable energy capacity by 2032 via solar, wind, and hydroelectric projects. This is expected to grow with 3 GW, 5 GW, and 8 GW of additional capacity planned for the fiscal year 2025, fiscal year 2026, and fiscal year 2027 respectively, as part of its trajectory toward achieving its 60 GW target by 2032.
- Nuclear Power & Future Projects: Collaboration between NTPC and Nuclear Power Corporation of India Limited for developing nuclear-based power plants enhances the diversity of NTPC’s portfolio. NTPC is engaged in coal mining for other fuel supplies that sustain thermal power plants.
Shareholding Pattern:
The shareholding structure of NTPC is well-diversified, ensuring stability and an assured confidence of the market.

Source: Market Screener
The shareholding structure of NTPC, based on the latest available data, is as follows:
- Government of India: Approximately 51.23% of the equity-shares; that is a majority control with strategic direction.
- Life Insurance Corporation of India: 4.46% shareholding; a reflection of strong institutional confidence.
- Foreign Institutional Investors: About 18.20%; indicates keen interest among the global investors.
- Domestic Institutional Investors: Approximately 26.76%; indicative of substantial support from domestic institutions.
- Retail Investors: 3.94%; they take a keen interest in NTPC’s story of growth.
Future Prospects:
NTPC is consciously putting in efforts to achieve net-zero emissions by expanding its renewable energy profile along with consolidating its leadership role in thermal power generation.
- Renewable Energy Expansion: NTPC has made huge investments in solar, wind, and green hydrogen projects.
- International Expansion: The company is now concentrating on energy trading and overseas power projects to enhance company outreach.
- Digital & Smart Energy Initiatives: NTPC is also embedding AI, automation, and smart grid technologies to improve operational efficiency.
PESTLE ANALYSIS
Political Factors
Operates under the Ministry of Power; subject to government regulations on pricing, electricity generation, and subsidies.
Strong push from the government to transition towards renewable energy (solar, wind, hydro).
Increasing competition due to policies encouraging private sector participation.
Bound by global energy agreements (e.g., Paris Agreement, COP26), pushing NTPC to reduce coal dependency.
Economic Factors
Rising power demand linked to economic growth and urbanization in India.
Global fluctuations in coal, gas, and oil prices affect operational costs and margins.
Inflation raises project costs; interest rate changes impact funding availability for expansion.
Access to international capital markets and green energy financing supports renewable initiatives.
Social Factors
Growing population and urban expansion increase electricity consumption.
Public environmental awareness drives demand for cleaner, sustainable energy sources.
NTPC contributes to employment and technical skill development across the energy sector.
Plays a critical role in rural electrification through distributed energy solutions.
Technological Factors
Significant investments in renewable energy technologies (solar, wind, green hydrogen).
Adoption of smart grids, AI, and IoT to enhance power distribution and operational efficiency.
Engaged in research and deployment of carbon capture and storage (CCS) to reduce emissions.
Focus on energy storage (battery systems) and hydrogen technology to support the green transition.
Legal Factors
Must comply with strict environmental norms from CPCB and MoEFCC (e.g., emission levels, water use).
Revenue backed by long-term Power Purchase Agreements (PPAs) with state electricity boards.
Faces legal hurdles in land acquisition for new projects due to rehabilitation laws.
Bound by labor laws and occupational safety regulations across its operations.
Environmental Factors
High coal dependency makes NTPC a major emitter of carbon, facing regulatory and societal pressure.
Committed to scaling up to 60 GW of renewable capacity by 2032 to reduce carbon footprint.
Thermal plants have high water requirements, leading to challenges in water-scarce regions.
Vulnerable to climate change risks such as extreme weather and rising temperatures affecting generation.
SWOT Analysis of Natural Thermal Power Corporation (NTPC)
Strengths:
Largest power producer in India, accounting for over 25% of the country’s electricity.
Diversified energy portfolio, including coal, solar, wind, hydro, and green hydrogen.
Strong government support as a Maharatna PSU.
Operational excellence with high plant load factors (PLFs) and optimal plant performance.
Long-term power purchase agreements (PPAs) ensuring predictable revenue.
International presence in Bangladesh, Sri Lanka, and the Middle East.
Weaknesses:
Heavy reliance on coal, which poses risks due to carbon emissions policies and climate change issues.
Regulatory delays in approvals, environmental clearances, and land acquisition.
Transmission and distribution (T&D) losses due to outdated infrastructure.
High debt levels resulting from capital-intensive projects, affected by interest rate fluctuations.
Slow transition to renewable energy compared to private sector rivals.
Opportunities:
Growth in renewable energy with India’s 500 GW non-fossil fuel target by 2030.
Government push for privatization, disinvestment, and private sector partnerships.
Digitalization and smart grid integration to enhance efficiency and reduce T&D losses.
Expansion into electric vehicle (EV) charging infrastructure.
International expansion into Africa, Southeast Asia, and the Middle East.
Investment in hydrogen energy, battery storage systems (BESS), and carbon capture technologies.
Threats:
Growing competition from private players, especially in the renewable energy sector.
Volatility in coal supply and pricing, impacting operational costs.
Stringent environmental regulations on emissions and coal plant shutdowns.
Financial stress of state electricity distribution firms (DISCOMs) affecting receivables.
Technological disruptions from decentralized energy systems like solar rooftops and microgrids.
Impact of climate change and extreme weather conditions on coal and hydro power plants.
Fundamental Analysis of Natural Thermal Power Corporation (NTPC)
NTPC, India’s largest power producer, has shown a strong financial performance despite some fluctuations in key financial metrics over the past few years. The company’s robust business model is driven by a diversified energy portfolio, which, although still dominated by coal-based power, is expanding into renewable energy sources like solar, wind, and green hydrogen. This diversification positions NTPC well for long-term growth as India moves toward its 2030 target of 500 GW of non-fossil fuel capacity.

NTPC’s net profit margin has fluctuated over the past five years. The margin increased significantly from 10.37% in FY 2020 to 13.87% in FY 2021 and 2022, reflecting strong financial performance during this period. However, the margin dropped slightly to 10.5% in FY 2023 but rebounded to 11.16% in FY 2024, indicating a recovery in profitability and an ability to maintain stable earnings despite cost pressures and other challenges.

The Return on Capital Employed (ROCE) has shown a steady improvement from 7.86% in FY 2020 to 11.02% in FY 2023. A slight dip to 10.55% in FY 2024 may indicate higher investment or increased costs. However, the overall trend signals that NTPC is utilizing its capital more efficiently, which bodes well for investors looking for stable, long-term returns.

NTPC’s Return on Equity (ROE) has demonstrated a strong and stable performance, peaking in FY 2022 at 17.35%. The company maintained relatively high ROE in the following years, indicating effective use of shareholders’ equity to generate profits. This trend reflects NTPC’s ability to provide consistent returns to its investors.

Similarly, NTPC’s Return on Assets (ROA) improved significantly from 2.5% in FY 2020 to 5.5% in FY 2024, showing better asset utilization. This trend underscores the company’s growing efficiency in generating profits from its capital-intensive assets.

In terms of liquidity, NTPC has shown a positive trend in its Current Ratio, which increased from 1.01 in FY 2020 to 1.06 in FY 2024. This suggests that NTPC has improved its ability to meet short-term liabilities with its short-term assets, signaling better financial health.

NTPC’s quick ratio also improved slightly from 0.81 in FY 2021 to 0.86 in FY 2023, reflecting better short-term liquidity. Despite minor fluctuations, NTPC remains capable of meeting its immediate obligations without relying heavily on inventory, which is crucial for maintaining financial flexibility.

The company has gradually increased its dividend payout ratio, which stood at approximately 40% in FY 2024, up from 25% in previous years. This indicates that NTPC is returning a higher share of profits to shareholders, which can attract income-focused investors.

Furthermore, NTPC’s Debt-to-Equity (D/E) ratio has decreased over the years, from 1.2 in FY 2020 to 0.8 in FY 2024. This indicates a reduced reliance on debt financing, improving the company’s financial stability. A lower D/E ratio also reduces the risks associated with debt, making NTPC a safer investment in terms of financial leverage.

The company’s Price-to-Earnings (P/E) ratio has surged to around 16 in FY 2024, indicating that NTPC is perceived as a high-growth stock with strong investor confidence. This increase is a positive sign, showing that NTPC is gaining favor in the market due to its strong earnings outlook.

NTPC’s EBITDA has shown a sharp increase in FY 2024, reaching ₹10.8 billion, marking the highest value in five years. This growth reflects the company’s improved operational performance and ability to generate higher revenues despite past fluctuations.
In conclusion, NTPC has shown resilience in its financial performance, maintaining profitability despite periodic challenges. Its focus on expanding into renewable energy and improving capital efficiency positions it well for sustainable growth. Investors can expect stable long-term returns, especially as the company continues to diversify its energy portfolio and strengthen its financial position.
Technical Analysis
- Relative Strength Index (RSI) Indicator
RSI is a momentum indicator which measures the recent price changes to evaluate overbought and oversold conditions. The RSI oscillates between 0 and 100. Traditionally the RSI is considered overbought when above 70 and oversold when below 20.
RSI = 100–100/(1 + Average Gain/Average Loss)
(The standard is to use 14 periods to calculate the initial RSI value.)
If RSI values go 70 or above, it indicates that the security is becoming overbought or overvalued and may lead to a trend reversal (fall). An RSI reading below 20 indicates oversold security and may indicate a trend reversal (rise).
RSI Divergence It occurs when the RSI indicator starts reversing before price does. A bearish divergence consists of an overbought RSI reading, followed by lower high on RSI. At the same time, price must make a higher high on the second peak, where the RSI is lower. In a bullish divergence situation, there must be an oversold condition on the RSI, followed by a higher low on the RSI graph. Simultaneously, price must form a lower low on the second peak.

- January 10: RSI was in the oversold zone (30 or below), indicating a potential buying opportunity as the stock was nearing exhaustion in selling pressure.
- Mid-January: RSI started recovering, moving above 30, signaling a possible trend reversal.
- End of January (28th Jan): RSI crossed 40–45, but still below 50, indicating that bullish momentum was building, though not yet strong.
- Stochastic Oscillator
The Stochastic Oscillator is a momentum indicator used in technical analysis to compare a particular closing price of a security to a range of its prices over a specific period. It helps traders identify overbought and oversold conditions, potential trend reversals, and price momentum.
Formula

where:
- Current Close = Most recent closing price
- Lowest Low = Lowest price over a given period (typically 14 periods)
- Highest High = Highest price over the same period
The Stochastic Oscillator is a momentum indicator that helps traders assess overbought and oversold conditions, potential trend reversals, and price momentum. When the oscillator moves above 80, the asset is considered overbought, indicating a possible price drop, whereas a reading below 20 suggests the asset is oversold, signaling a potential price increase. Traders also look at crossovers between the %K and %D lines to generate buy and sell signals. A bullish crossover occurs when %K crosses above %D, suggesting a buying opportunity, while a bearish crossover happens when %K crosses below %D, signaling a potential sell. Additionally, divergence between price and the Stochastic Oscillator can indicate trend reversals. If the price reaches a new high, but the oscillator fails to follow, it suggests a bearish divergence, hinting at a potential price decline. Conversely, if the price hits a new low, but the oscillator does not, it indicates a bullish divergence, implying a possible upward reversal. Traders use these signals to refine their market entry and exit strategies.

NTPC- Indicator: Stochastic
The stock of NTPC ltd. was purchased on 10th January, 2025. The candle closing at around 315–317 suggests a strong buy signal and may be viewed as a trend reversal. The stochastic oscillator (4,1,3) for NTPC Ltd. is currently at 25.99 and 24.44, indicating that the stock is nearing the oversold zone (typically below 20). If the values continue to decline, it could signal a potential reversal in price action.
Key price levels marked on the chart include ₹425.00, ₹375.00, ₹325.00, and ₹225.00, suggesting possible support and resistance zones. If the stock approaches the ₹325.00 level, it may find strong support, while resistance is likely near ₹375.00.
The recent price action shows NTPC Ltd. trading at ₹311.45, reflecting a 1.35% decline. If the downtrend persists, a test of lower support levels may occur. However, if the stochastic oscillator rebounds, it could indicate a bullish recovery.
Analyzing past trends, NTPC Ltd. has shown resilience near similar stochastic levels, often rebounding when approaching oversold conditions. Additionally, volume and moving averages should be considered for trend confirmation.
Overall, we monitored price action near key levels and looked for momentum shifts before making entry or exit decisions. A further decline in stochastic readings strengthens buying opportunities if the price stabilizes near support.
NTPC Limited, India’s largest power producer, demonstrates strong financial health, operational efficiency, and strategic foresight. With a diversified energy portfolio and government backing, NTPC shows stable returns, low volatility, and robust fundamentals, including steady cash flows and improving profitability metrics. While still reliant on coal, its ambitious push toward 60 GW of renewable capacity by 2032, investments in green hydrogen, international ventures, and smart energy technologies position it well for sustainable long-term growth. Despite moderate risks from regulatory challenges and coal dependency, NTPC remains a fundamentally sound and future-ready company
메타데이터
- post_id
- 3f2e9766c23b
- slug
- ntpc-limited-a-fundamentally-strong-and-future-ready-power-giant-3f2e9766c23b
- url
- https://medium.com/@mehak0402/ntpc-limited-a-fundamentally-strong-and-future-ready-power-giant-3f2e9766c23b
- canonical_url
- https://medium.com/@mehak0402/ntpc-limited-a-fundamentally-strong-and-future-ready-power-giant-3f2e9766c23b
- author_url
- https://medium.com/@mehak0402
- status
- ok
- fetched_at
- 2026-06-20 20:29:01



