The Truth About Moving Average Crossovers: Can This Classic Trading Strategy Still Beat the Market.
Introduction
The Truth About Moving Average Crossovers: Can This Classic Trading Strategy Still Beat the Market.
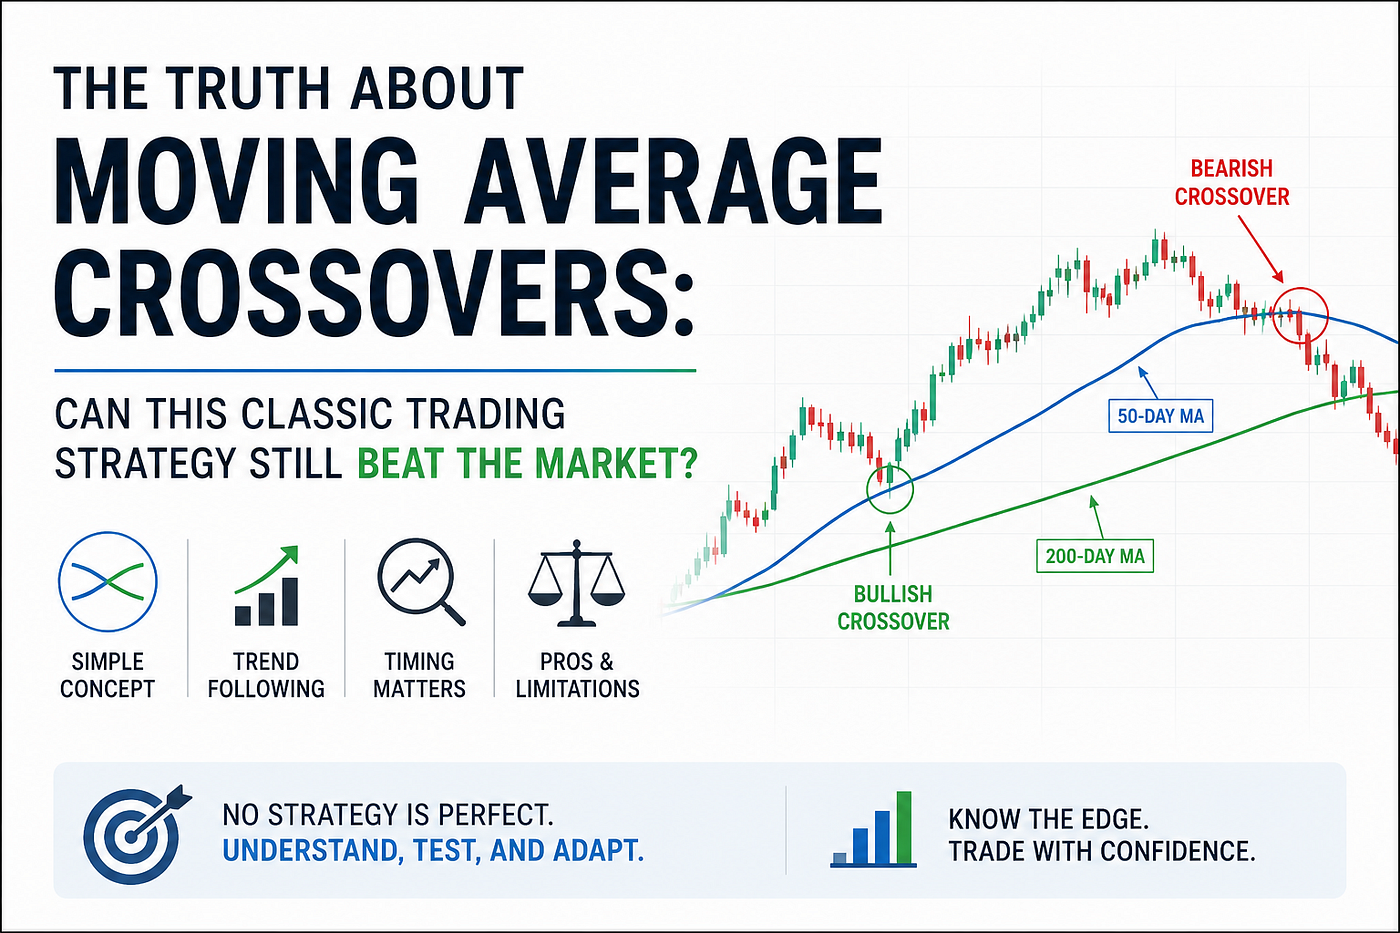
Moving Average Crossovers
Introduction
Among the countless trading strategies available to investors and traders, few have achieved the popularity and longevity of the Moving Average Crossover Strategy. For decades, traders have used moving averages to identify trends, generate buy and sell signals, and simplify complex market movements. Whether trading stocks, commodities, forex, cryptocurrencies, or market indices, moving average crossovers remain one of the most widely discussed techniques in technical analysis.
The appeal of the strategy is easy to understand. Moving averages smooth out market noise and help traders focus on the underlying trend. When a shorter-term moving average crosses above a longer-term moving average, many traders interpret it as a bullish signal. Conversely, when the shorter-term average crosses below the longer-term average, it often suggests bearish momentum.
Despite its popularity, an important question remains: Does the Moving Average Crossover Strategy really work? Some traders swear by it and consider it an essential part of their trading system. Others criticize it for producing delayed signals and false breakouts during volatile or range-bound markets.
The reality is more nuanced. Moving average crossovers can be highly effective under certain market conditions and less effective under others. Understanding when and how to use the strategy is critical for maximizing its value.
This comprehensive guide explores the mechanics of moving average crossovers, their historical significance, strengths, weaknesses, practical applications, and how modern traders can incorporate them into a robust technical analysis framework.
Understanding Moving Averages
Before examining crossover strategies, it is important to understand what moving averages are and why traders use them.
A moving average calculates the average price of a security over a specified period.
As new price data becomes available, the calculation updates continuously.
This creates a smooth line that helps traders identify trend direction more easily.
Moving averages reduce short-term volatility and make broader market trends easier to recognize.
They serve as one of the foundational tools of technical analysis.
The Evolution of Moving Average Trading
Moving averages have been used for many decades.
Long before advanced charting software existed, traders sought methods to simplify price fluctuations.
Moving averages emerged as a practical solution.
As computing technology improved, traders gained the ability to test various moving average combinations across different markets.
Over time, crossover systems became increasingly popular because they offered clear and objective trading signals.
Today, moving averages remain a core component of many professional trading strategies and algorithmic systems.
Types of Moving Averages
Several types of moving averages exist.
The most commonly used include:
Simple Moving Average (SMA)
The Simple Moving Average calculates the average closing price over a specific period.
Popular examples include:
- 20-day SMA
- 50-day SMA
- 100-day SMA
- 200-day SMA
SMAs are easy to understand and widely used.
Exponential Moving Average (EMA)
The Exponential Moving Average assigns greater weight to recent price data.
As a result, EMAs respond more quickly to changing market conditions.
Many active traders prefer EMAs because of their increased sensitivity.
Weighted Moving Average (WMA)
Weighted moving averages also emphasize recent prices but use different calculation methods.
Although less common, some traders prefer WMAs for specific strategies.
What Is a Moving Average Crossover?
A moving average crossover occurs when one moving average crosses another.
These intersections often generate trading signals.
The basic concept is straightforward.
A short-term moving average reacts faster to recent price changes.
A long-term moving average reacts more slowly.
When the short-term average crosses above the long-term average, momentum may be shifting upward.
When it crosses below, momentum may be weakening.
Traders use these signals to identify potential trend changes.
The Golden Cross
The Golden Cross is one of the most famous bullish signals in technical analysis.
It occurs when a shorter-term moving average rises above a longer-term moving average.
A common example involves:
- 50-day moving average
- 200-day moving average
When the 50-day average crosses above the 200-day average, many traders interpret the event as confirmation of a developing long-term uptrend.
Golden Cross signals often attract significant attention from investors and institutions.
The Death Cross
The Death Cross represents the bearish counterpart.
It occurs when a shorter-term moving average falls below a longer-term moving average.
Using the same example:
- 50-day moving average
- 200-day moving average
A crossover below the 200-day average may indicate deteriorating market conditions.
Many traders view the Death Cross as a warning sign of potential weakness.
Why Traders Use Moving Average Crossovers
Moving average crossovers remain popular because they offer several advantages.
Simplicity
The strategy is easy to understand and implement.
Even beginners can identify crossover signals quickly.
Objectivity
Crossovers generate clear signals.
This reduces emotional decision-making.
Trend Identification
Moving averages help traders align with prevailing market trends.
Broad Market Applicability
The strategy works across multiple asset classes and timeframes.
Its versatility contributes to its enduring popularity.
The Psychology Behind Moving Average Crossovers
Moving average crossovers reflect changing market sentiment.
A bullish crossover suggests that recent buying pressure exceeds longer-term selling pressure.
A bearish crossover suggests the opposite.
Because many traders monitor these signals, crossovers can become self-reinforcing.
Increased attention often leads to increased trading activity.
This psychological component contributes to their effectiveness.
When Moving Average Crossovers Work Best
Moving average crossovers perform particularly well in trending markets.
Strong directional movement allows moving averages to capture sustained momentum.
Examples include:
- Bull markets
- Strong sector trends
- Commodity rallies
- Extended cryptocurrency advances
During these conditions, crossover strategies may generate significant gains.
Trend-following environments are generally ideal.
The Biggest Weakness: Lagging Signals
One of the most common criticisms involves signal delay.
Moving averages are based on historical prices.
As a result, crossovers often occur after a trend has already begun.
This lag means traders may:
- Enter late
- Exit late
- Miss part of a move
The strategy sacrifices early entries in exchange for confirmation.
Understanding this trade-off is essential.
False Signals in Sideways Markets
Moving average crossovers struggle in range-bound conditions.
When prices move sideways, moving averages frequently cross back and forth.
This phenomenon creates:
- Whipsaws
- False breakouts
- Repeated losses
Many traders experience frustration during non-trending markets.
Recognizing market conditions helps reduce these challenges.
Popular Moving Average Combinations
Different traders use different moving average pairs.
Common combinations include:
9 EMA and 21 EMA
Popular among short-term traders.
20 EMA and 50 EMA
Frequently used for swing trading.
50 SMA and 200 SMA
Widely followed by long-term investors.
10 EMA and 30 EMA
Often used in forex and futures trading.
The ideal combination depends on trading style and timeframe.
Combining Crossovers with Support and Resistance
Moving average crossovers become more powerful when combined with support and resistance analysis.
For example:
A bullish crossover occurring near major support may carry greater significance.
Similarly, a bearish crossover near strong resistance may strengthen the signal.
Combining multiple technical factors improves probability.
Professional traders rarely rely on a single indicator.
Volume Confirmation
Volume adds another layer of confirmation.
Strong volume during a crossover suggests greater market participation.
This often increases confidence in the signal.
Weak volume may indicate limited conviction.
Volume analysis helps traders distinguish between meaningful moves and temporary fluctuations.
Using Multiple Time Frames
Experienced traders often analyze crossovers across multiple timeframes.
For example:
- Daily chart for trend direction
- Four-hour chart for setup confirmation
- Hourly chart for entry timing
Multi-timeframe analysis improves perspective and reduces false signals.
It helps traders align short-term decisions with broader market trends.
Risk Management and Moving Average Strategies
No trading strategy succeeds without risk management.
Before acting on a crossover signal, traders should determine:
- Entry point
- Stop-loss location
- Profit target
- Position size
Protecting capital remains more important than maximizing gains.
Risk management helps traders survive inevitable periods of underperformance.
Technology and Algorithmic Trading
Modern trading technology has expanded the use of moving average crossovers significantly.
Many algorithmic systems incorporate moving averages as core components.
Artificial intelligence can:
- Scan thousands of securities
- Identify crossover events instantly
- Monitor trend strength
- Generate alerts
Technology improves efficiency but does not eliminate the need for sound judgment.
Understanding market context remains essential.
Does the Moving Average Crossover Strategy Really Work?
The answer depends on expectations and execution.
Moving average crossovers are not magical prediction tools.
They do not guarantee profits.
However, they can be highly effective trend-following mechanisms.
The strategy works best when:
- Markets trend strongly
- Risk management is disciplined
- Signals receive confirmation
- Traders remain patient
Problems often arise when traders expect perfect accuracy.
No strategy wins every trade.
The goal is to capture meaningful trends while controlling risk.
Conclusion
The Moving Average Crossover Strategy has endured for decades because it provides a simple, objective, and effective method for identifying market trends. By comparing short-term and long-term moving averages, traders gain valuable insight into shifting momentum and potential changes in market direction. Although crossover signals can lag and occasionally produce false signals during sideways markets, they remain one of the most respected tools in technical analysis.
Successful traders understand that moving average crossovers work best when combined with broader market analysis, support and resistance levels, volume confirmation, risk management, and disciplined execution. Rather than viewing crossovers as standalone solutions, professionals use them as part of a comprehensive trading framework.
메타데이터
- post_id
- 3f7b00c52e72
- slug
- the-truth-about-moving-average-crossovers-can-this-classic-trading-strategy-still-beat-the-market-3f7b00c52e72
- url
- https://medium.com/@astroterminal/the-truth-about-moving-average-crossovers-can-this-classic-trading-strategy-still-beat-the-market-3f7b00c52e72
- canonical_url
- https://medium.com/@astroterminal/the-truth-about-moving-average-crossovers-can-this-classic-trading-strategy-still-beat-the-market-3f7b00c52e72
- author_url
- https://medium.com/@astroterminal
- status
- ok
- fetched_at
- 2026-08-09 00:50:17




