Ad Impact: Statistical A/B Testing on Marketing Conversion
A Marketing Campaign project on data, from hypothesis to business decision.
Ad Impact: Statistical A/B Testing on Marketing Conversion
A Marketing Campaign project on data, from hypothesis to business decision.
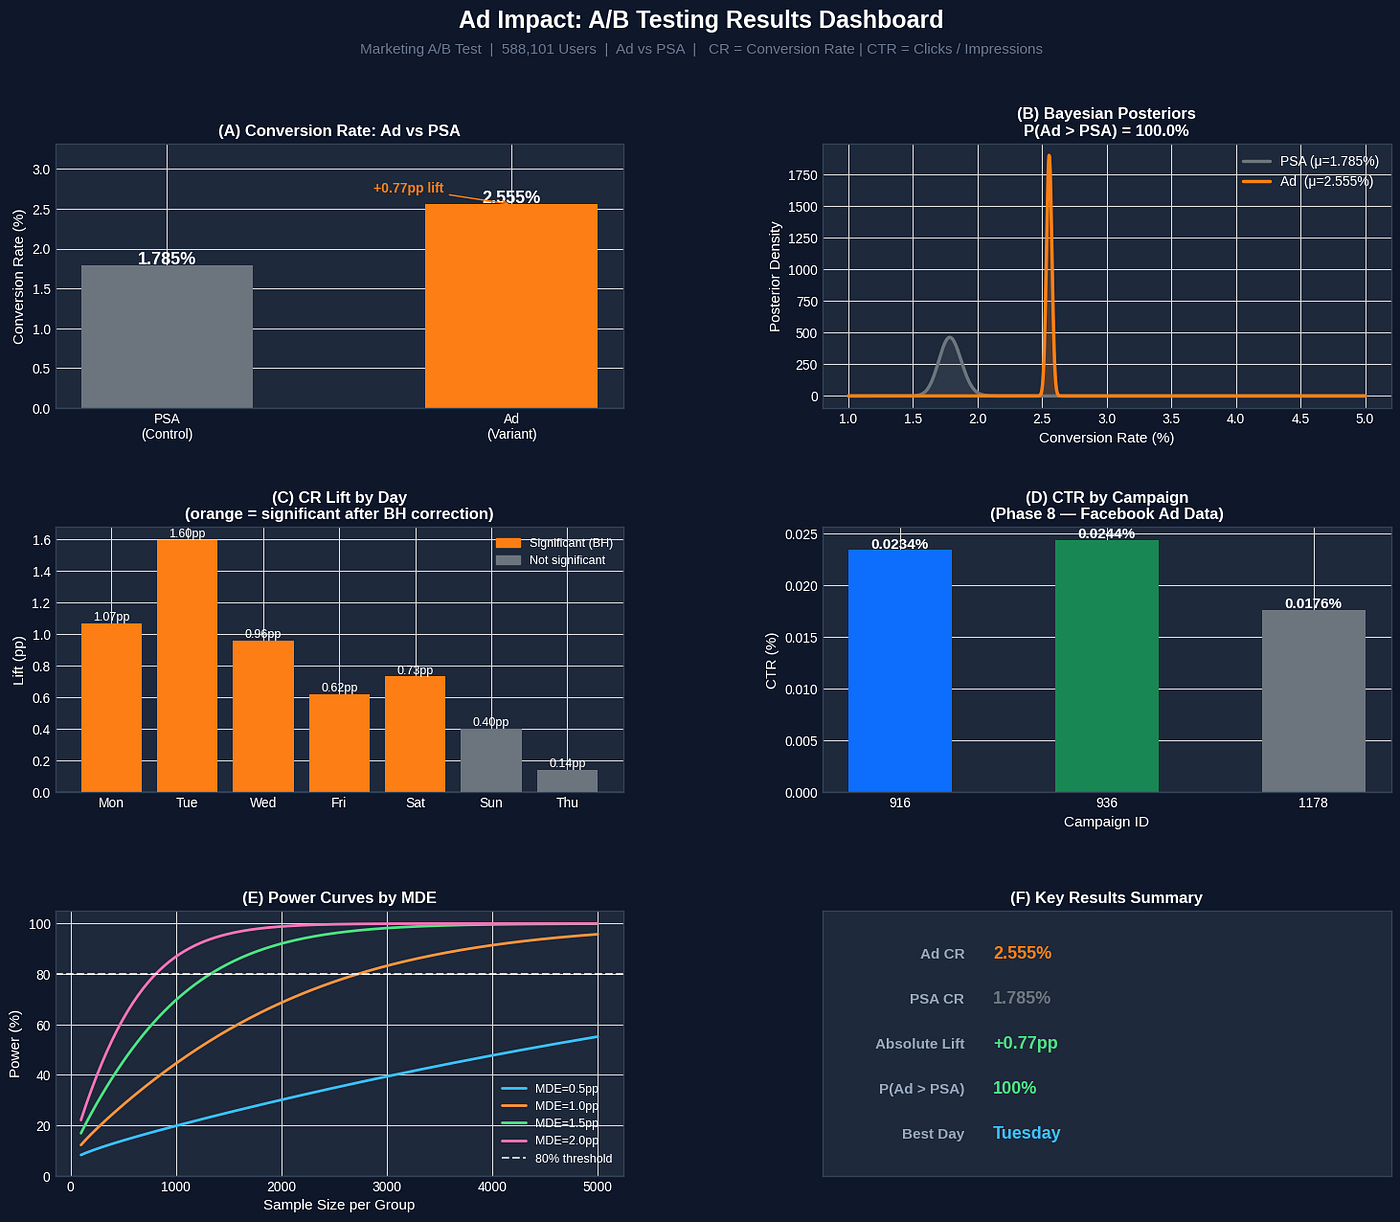
Report Dashboard
What This Project Is:
Most A/B testing tops at “run a z-test and check if p < 0.05.” This project doesn’t. It walks through the full lifecycle of a real marketing experiment, the kind of rigorous, defensible analysis that actually informs a go/no-go decision at a company, not just a notebook.
Two real datasets. One randomised experiment. One observational extension. Frequentist and Bayesian frameworks run side by side. Segment analysis with proper multiple-testing correction. Power analysis. And a final recommendation a non-technical stakeholder can act on immediately.
The Data:
Primary: Marketing A/B Testing kaggle datasets download -d faviovaz/marketing-ab-testing
588,101 real users randomly assigned to see either an ad or a neutral Public Service Announcement (PSA). Binary outcome: did they convert? This is a genuine randomised controlled experiment — causal conclusions are valid here.
Extension: Clicks Conversion Tracking kaggle datasets download -d loveall/clicks-conversion-tracking
1,143 records from three real Facebook ad campaigns. Contains actual Impressions and Clicks columns — this is where literal CTR = Clicks ÷ Impressions is computed. Observational data, associations only, no causal claims.
Project Structure:
- Setup & Data Sourcing
- Business framing, hypotheses & OEC definition,
- Data quality checks — missing values, duplicates, SRM test
- Frequentist hypothesis testing — z-test, effect size & CI
- Bayesian A/B testing — Beta-Binomial model, P(ad > PSA)
- Segment analysis — day & hour level, BH correction
- Power analysis — required N, achieved power, MDE
- CTR extension — Facebook campaign data, chi-square
- Results dashboard & Business Translation
- Q&A — 12 questions covering the full project
Key Results
Metric Value — Ad Conversion Rate 2.555% & PSA Conversion Rate 1.785%, Absolute Lift +0.77pp, Relative Lift + 43.1% Z-statistic 7.37 p-value<0.000001 P(Ad > PSA) — Bayesian 100%, 95% CI [0.59pp, 0.94pp] Achieved. Power 100% Best performing day Tuesday (+1.60pp lift) Best performing hours: 11 am, 1pm, 2pm, 8pm.
Recommendation
Ship the ad. Prioritise Tuesday — Wednesday, 11am — 2pm.
Both Frequentist Hypothesis Testing and Bayesian Frameworks were used because they both answer different questions. The frequentist test tells you whether to reject H₀. The Bayesian model tells you the direct probability the ad is genuinely better — the number a stakeholder can actually act on.
Multiple-testing correction — 31 segment tests were run (7 days + 24 hours). Without correction, the familywise false positive rate inflates to ~79%. Benjamini-Hochberg FDR correction was applied: 12 hour-level results appeared significant before correction, only 4 survived. Those 8 dropped results would have been acted on incorrectly without this step.
Observational vs experimental distinction — the Facebook extension dataset is explicitly treated as observational. The language used throughout is “associated with,” not “caused by.” This distinction matters and is flagged at every relevant point.
Tech Stack
Python 3.11, Pandas, NumPy, Data wrangling, SciPyZ-test, chi-square, Bayesian sampling, Statsmodels, Proportions, z-test, power analysis, BH correction, Matplotlib, Seaborn, Visualisation, Google Colab, Development environment, Kaggle API, Seaborn Visualisation, Google Colab Development environment, Kaggle API, Seaborn Visualisation
How to Run the code file
Code Repository on GitHub — Link
Open AdImpact_AB_Testing.ipynb in Google Colab (or any IDE) Connect Kaggle API token to Colab Secrets as KAGGLE_API_TOKEN (Kaggle → Settings → API → Create New Token) Run all cells in order — datasets download automatically via the API, no manual file uploads needed.
Built as part of a data science portfolio — grounded in real data, real methodology, and real business decisions.
Q&A Extracts from Phase 10
Q1: Walk me through this project.
A/B testing on real datasets — 588,101 users, ad vs PSA, measuring conversion rate. Full pipeline: data quality, frequentist + bayesian testing, segment analysis power analysis. Final output: a go/no-go recommendation with scheduling guidance.
Q2: Why one-tailed test?
The business question is directional — does the ad perform better than the PSA? If it underperforms, the action is the same either way: don’t roll out. One-tailed concentrates all statistical power into detecting improvement.
Q3: What is an SRM and what did you find?
SRM = observed group split deviates from intended design, signalling a pipeline bug. We found a 96/4 split — not 50/50. Tested against 96/4: chi-square ≈ 0, p = 0.9998. No SRM. Data quality confirmed clean.
Q4: What is a p-value — precise definition.
The probability of observing a result at least this extreme if H₀ were true. Not the probability the result is real. Not the probability H₀ is true. Our result: p < 0.000001 — the observed gap is effectively impossible under H₀.
Q5: What did Bayesian add that frequentist couldn’t?
Frequentist gives a binary decision: reject H₀ or not. Bayesian gives a direct probability: P(Ad > PSA) = 100%. A stakeholder can act on 100% immediately — they can’t easily act on p < 0.000001 without explanation.
Q6: What is the multiple testing problem and how did you handle it?
Running 31 tests at α = 0.05 inflates false positive risk to ~79%. Applied Benjamini-Hochberg correction. Hour-level result: 12 appeared significant, only 4 survived. 8 results were pure noise — BH caught them, a naive analyst wouldn’t.
Q7: Most actionable segment findings?
Best days by conversion rate lift: Tuesday (+1.60pp), Monday, Wednesday — all significant after BH correction. Thursday and Sunday: not significant. Best hours: 11am, 1pm, 2pm, 8pm. Recommendation: concentrate spend Tuesday–Wednesday, 11am–2pm.
Q8: Was the experiment adequately powered?
Yes, massively overpowered. Needed only 1,329 users per group for 80% power. PSA group had 23,524–18x the minimum. Achieved power: 100%. PSA group was the binding constraint, not the ad group.
Q9: Facebook data is observational, what does that mean?
We can identify associations, not causes. No random assignment means confounding factors may explain CTR differences. Correct language: campaigns are associated with different CTRs — not that they caused them.
Q10: Final business recommendation?
Unambiguously: ship the ad. Ad CR 2.555% vs PSA 1.785%, +0.77pp lift, P(Ad > PSA) = 100%, CI entirely above zero. All checks passed. Prioritise Tuesday–Wednesday, 11am–2pm for maximum impact.
Q11: A notebook is not production, how would this scale in a real company?
At scale, this analysis lives in an automated data pipeline pulling from a metrics store, a statistical testing module triggered automatically when sample size thresholds are hit, and a real-time dashboard, not a manually re-run notebook. The notebook is the proof of concept and methodology document. In production, the logic gets refactored into tested Python scripts, version controlled on GitHub, and scheduled via a workflow tool like Airflow.
Q12: How would you ship the statistical decision logic from this notebook to production?
Four steps:
- Modularise — extract the core statistical functions (z-test, Bayesian, SRM check) into clean, reusable Python scripts that any system can call.
- Validate first — wrap every analysis in a data quality gate. If the SRM check fails, the pipeline stops before any test runs. Bad data in, bad decisions out.
- Version control — every script lives on GitHub, reviewed and tested before touching production data. The notebook becomes the methodology document and audit trail — not the thing that runs in production.
- Schedule and automate — the pipeline runs on a schedule via a workflow tool like Airflow. It pulls fresh experiment data, runs the tests automatically, and pushes results to a dashboard or Slack alert when the experiment reaches a decision point.
The notebook answers “does this work and why?” Production answers “run this reliably, every day, without anyone manually pressing a button.”
References & Further Reading
This project was built alongside the following resources, each one shaped a specific analytical decision in the notebook:
Books
Kohavi, R., Tang, D., & Xu, Y. (2020). Trustworthy Online Controlled Experiments: A Practical Guide to A/B Testing. Cambridge University Press. — The field’s definitive reference. Chapter 21 covers SRM; Chapter 17 covers the OEC.
Bruce, P., Bruce, A., & Gedeck, P. (2020). Practical Statistics for Data Scientists. O’Reilly. — Applied coverage of hypothesis testing and resampling methods.
Siroker, D., & Koomen, P. (2013). A/B Testing: The Most Powerful Way to Turn Clicks Into Customers. Wiley. — Business-framed perspective on experimentation; useful for translating statistical results into go/no-go language.
Academic
Abdey, J. (2009). To p, or not to p? Towards a Balanced Approach to p-values. PhD thesis, London School of Economics. — Chapter 5 directly informed the multiple-testing correction methodology and the precise p-value interpretation used throughout this project.
Connect: If you found this project useful or want to discuss the methodology, feel free to reach out.
메타데이터
- post_id
- 3fa80f9c7d3d
- slug
- ad-impact-statistical-a-b-testing-on-marketing-conversion-3fa80f9c7d3d
- url
- https://medium.com/@akannilmd/ad-impact-statistical-a-b-testing-on-marketing-conversion-3fa80f9c7d3d
- canonical_url
- https://medium.com/@akannilmd/ad-impact-statistical-a-b-testing-on-marketing-conversion-3fa80f9c7d3d
- author_url
- https://medium.com/@akannilmd
- status
- ok
- fetched_at
- 2026-07-21 15:32:57



