Red vs Blue (vs Yellow) — benchmarking low latency, high concurrency analytics engines
Low latency, high concurrency analytics has been in the spotlight in the past few weeks, with benchmarks flying left right and centre.
Red vs Blue (vs Yellow) — benchmarking low latency, high concurrency analytics engines
Low latency, high concurrency analytics has been in the spotlight in the past few weeks, with benchmarks flying left right and centre.
In particular, ClickHouse has published a number of benchmarks across the TPC-H and ClickBench datasets, and Databricks joined the fray this week with some vague (and as we’ll see, misleading) bench-marketing for a product they’re yet to release.
Snowflake’s Interactive Warehouses have been conspicuously absent from many of these comparisons, so I thought I’d dig in and see if I could replicate some of the results myself, and in the process provide the transparency for anyone else looking to do the same.
And how do they perform? Well, while Snowflake generally doesn’t recommend synthetic benchmarks and I’d encourage you to always test things for yourself, my curiosity got the better of me.
The results below speak for themselves:
- Snowflake outperforms the Reyden engine by up to 3x on TPC-H, based on numbers shared in the keynote. This, in spite of claims during that same keynote that “Vendor 1 (interactive)” failed to run this same benchmark. I’d encourage you to try for yourself with the code.
- Snowflake outperforms both ClickHouse (1.2–5.6x) and Databricks (28–35x) across all scales of CostBench, a significantly more difficult benchmark on cost/performance (as defined in the official CostBench repo by ClickHouse).

Figure 1: A graphic from the Databricks keynote this week, updated with accurate numbers for Snowflake’s Interactive Warehouses in blue, which are 1.4x to 3x faster than the claimed Databricks Reyden performance at larger scale on the 22 query TPC-H benchmark. Note: “Vendor 2” numbers are sourced from Databricks, but as the benchmark details weren’t disclosed we can’t replicate those results. (code)

Figure 2: On “CostBench”, 43 queries against the ClickBench dataset, Snowflake Interactive delivers 1.2–5.6x better price performance than ClickHouse, and 28–35x better price performance than Databricks. Here, the 100B scale represents 18TB of raw data, i.e. 18x larger than the above TPC-H 1TB scale. We have used the optimal price-performance configuration for all engines at each scale. (code)

Figure 3: Drilling into “CostBench” at the largest 100B scale, we see the significant performance and cost advantages of Snowflake Interactive over traditional query engines (note the logarithmic scales). Here, Interactive was ~40% faster than ClickHouse, albeit at a ~30% premium. (code)
For the uninitiated, Snowflake Interactive Warehouses became Generally Available in December 2025 as Snowflake’s new in-memory architecture, ideal for workloads that require a combination of low latency and high concurrency. They’re specialised for low latency, high concurrency workloads such as observability, real-time dashboards and data-powered APIs.
These warehouses run against Interactive Tables, which can be created from standard Snowflake surfaces including open table formats such as Apache Iceberg, and exist within the same consistent Snowflake RBAC governance model. They also inherit the majority of features from Snowflake’s regular tables and warehouses — search optimisation, auto-scaling, replication, cross-AZ redundancy, strong performance on joins and complex queries, etc.
With that out the way, let’s dig a bit deeper. You can also get stuck straight into the code if you prefer.
Deep Dive 1: TPC-H (code)
The TPC-H benchmark entails running 22 queries at different scales, such as SF10 (10GB) and SF1000 (1TB). As it happens, I had recently run benchmarks for Interactive Warehouses at the SF10 and SF100 scale, after ClickHouse published a series of blogs ranking various engines by their cost-performance on this benchmark, and was planning to publish my working.
Conveniently for me, Databricks then used the same benchmark in their keynote this week, but added the SF1000 scale (1TB) and SF1 scale (a measly 1GB). I added SF1000 scale to my testing, and was particularly interested in this result as the Databricks keynote claimed that “Vendor 1 (interactive)” failed to run at this scale, something I was certain would not be true in my testing, having already completed the significantly larger 18TB ClickBench run using Snowflake Interactive Warehouses.
How the benchmark was run
All TPC-H numbers below follow the standard protocol used in other blogs. The 22 queries run at SF10 (10GB), SF100 (100GB) and SF1000 (1TB); the result cache is disabled; each query gets three untimed warm-up passes and then three hot runs, and the fastest hot run of each query is summed for the workload total.
I report server-side engine time, so the figures don’t include my laptop-to-Snowflake round trip. Cost uses the same basis ClickHouse applies to its always-on node: runtime x credits/hour x $3 / 3600, billed per second with no minimum and no idle (Enterprise, $3/credit). Interactive Tables are clustered on their primary join key (l_orderkey, o_orderkey, and so on), and any query that exceeds the ~5s Interactive limit transparently falls back to a same-size standard warehouse (and is billed at the standard rate).
The full harness, setup SQL and per-query results are public.
Scaling from small to big data
The Databricks keynote chart plotted Vendor 1 (Interactive), Vendor 2 and their unreleased Reyden engine across scales, with no warehouse size and no cost disclosed. Figure 1 (repeated below) keeps that same deliberate vagueness and simply substitutes Snowflake Interactive’s measured numbers into the Vendor 1 series, because a latency bar with no size and no price attached tells you very little on its own.
Figure 1: A graphic from the Databricks keynote this week, updated with accurate numbers for Snowflake’s Interactive Warehouses in blue. (code)
The numbers are below:

At 10GB the two are within ~60ms of each other per query, and at that size the gap is noise rather than architecture: 10GB fits comfortably in cache, so the run isn’t bottlenecked on compute. With query result cache enabled, as would be reflective of a normal workload, this could be a different picture. To check, I re-ran the 10GB suite on a double-the-compute X-Large warehouse and the total was unchanged at 4.3s; adding hardware to a workload that isn’t compute-bound does nothing. (Databricks went further still and benchmarked a single gigabyte uncompressed — I am curious which customers are doing analytics at such a tiny scale.)
The interesting region is where the data outgrows trivial: Snowflake Interactive is about 1.45x faster than Reyden’s claimed number at 100GB, and about 3x faster at 1TB. The lead grows with the data, which is the opposite of the competitors-fall-over-at-scale story repeated by Databricks.
Incidentally, I also successfully completed the TPC-DS benchmark they cite at the largest scale (1TB) with Interactive with proportional performance (vs Gen2 warehouses they include) that suggests we would be approximately twice as fast as Reyden. Strangely, Interactive was omitted from this part of their blog with no explanation. I’m happy to push this code if anyone is interested (let me know), but didn’t want to overload this blog.
The “failed to run” claim
The keynote claimed “Vendor 1 (interactive)” failed to run this benchmark at 1TB. If they were referring to Snowflake Interactive, it does not. An Interactive Warehouse completed the full 22-query suite at 1TB in 23.6 seconds with zero fallbacks: every query was served inside the in-memory engine, none even falling back to a standard warehouse, which would otherwise complete the query.
The tables build straight from SNOWFLAKE_SAMPLE_DATA, so anyone can reproduce the result with the linked code.
Of the lofty claims made in the keynote, I can’t validate the performance of the unreleased Reyden engine, but can confidently say that the figures used to represent Snowflake’s Interactive warehouse performance are somewhere on the spectrum between misleading and false. Not only that, but once we substitute in actual performance, Interactive comes out ahead of the claimed Reyden performance numbers.
How Snowflake Interactive compares to engines you can run today
Reyden is unreleased, but the other engines on that keynote chart are not. Below is the full field from ClickHouse’s own TPC-H benchmark, with Snowflake Interactive added. At 100GB, Interactive takes the top three cost-performance positions outright; at 10GB it is in a near-tie between Snowflake Interactive and ClickHouse, both far ahead of Databricks, BigQuery and Redshift. These are the products you can actually run today.

Figure 4: TPC-H at 100GB, ranked by cost-performance (runtime x cost); Snowflake Interactive holds the top three positions, outperforming the best ClickHouse configuration by a factor of 2.3x and Databricks by 5.9x.

Figure 5: TPC-H at 100GB across every generally-available engine, runtime (bars) and cost (line), with Snowflake Interactive in light blue.
At 10GB, the same field, again ranked by cost-performance:
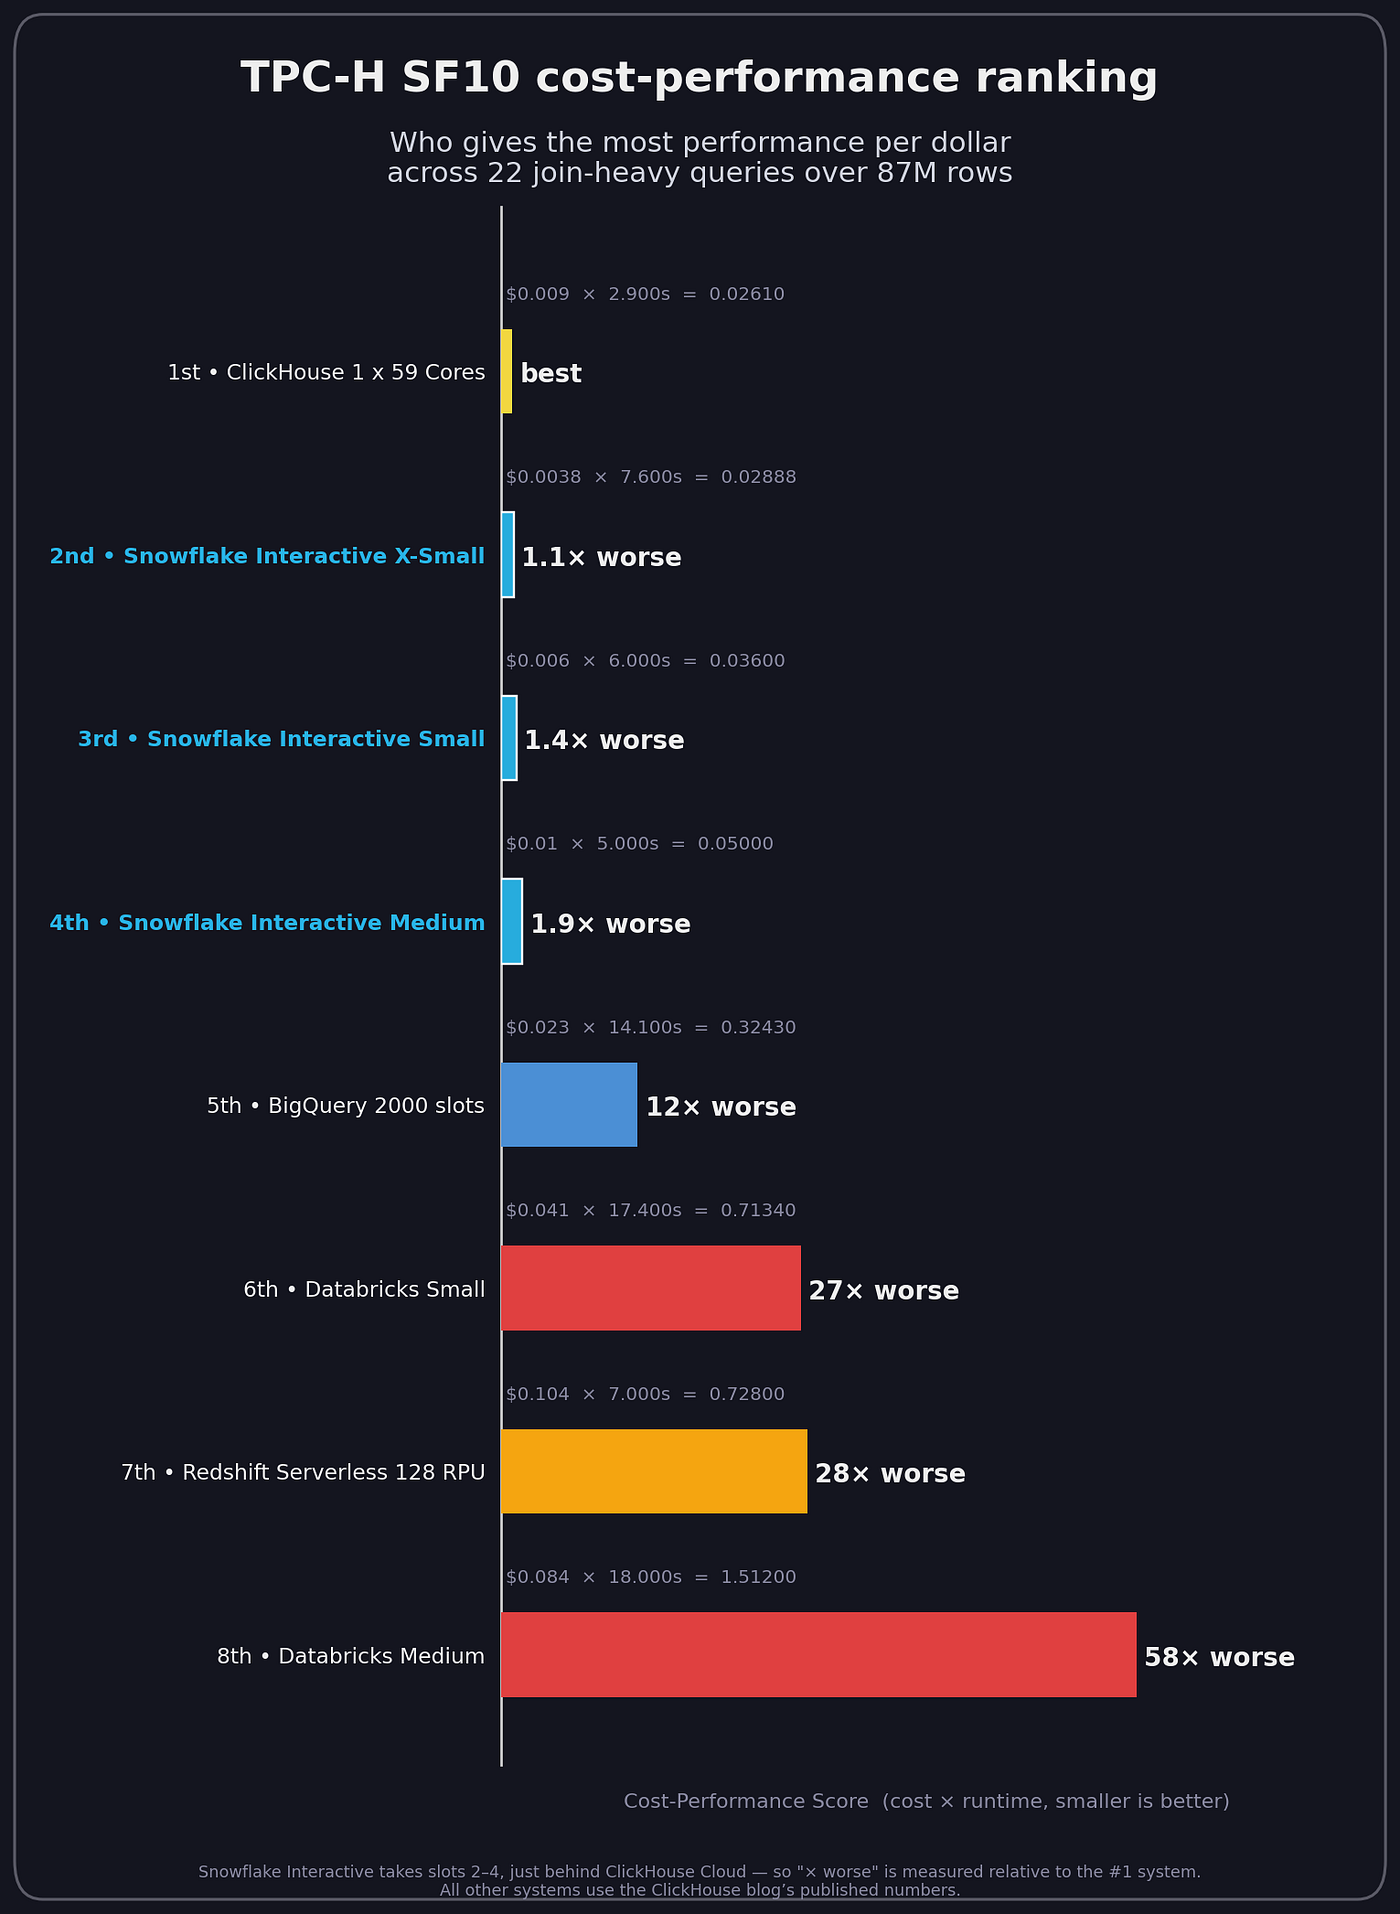
Figure 6: TPC-H at 10GB, the same engines and metrics. ClickHouse and Snowflake Interactive X-Small are within 10% of each other, with the other engines well behind. At this small scale, with only 6–8 seconds of total execution time and less than 1 cent in cost, top results are close to the noise floor. However, other engines trail by more significant factors >12x, providing greater confidence.
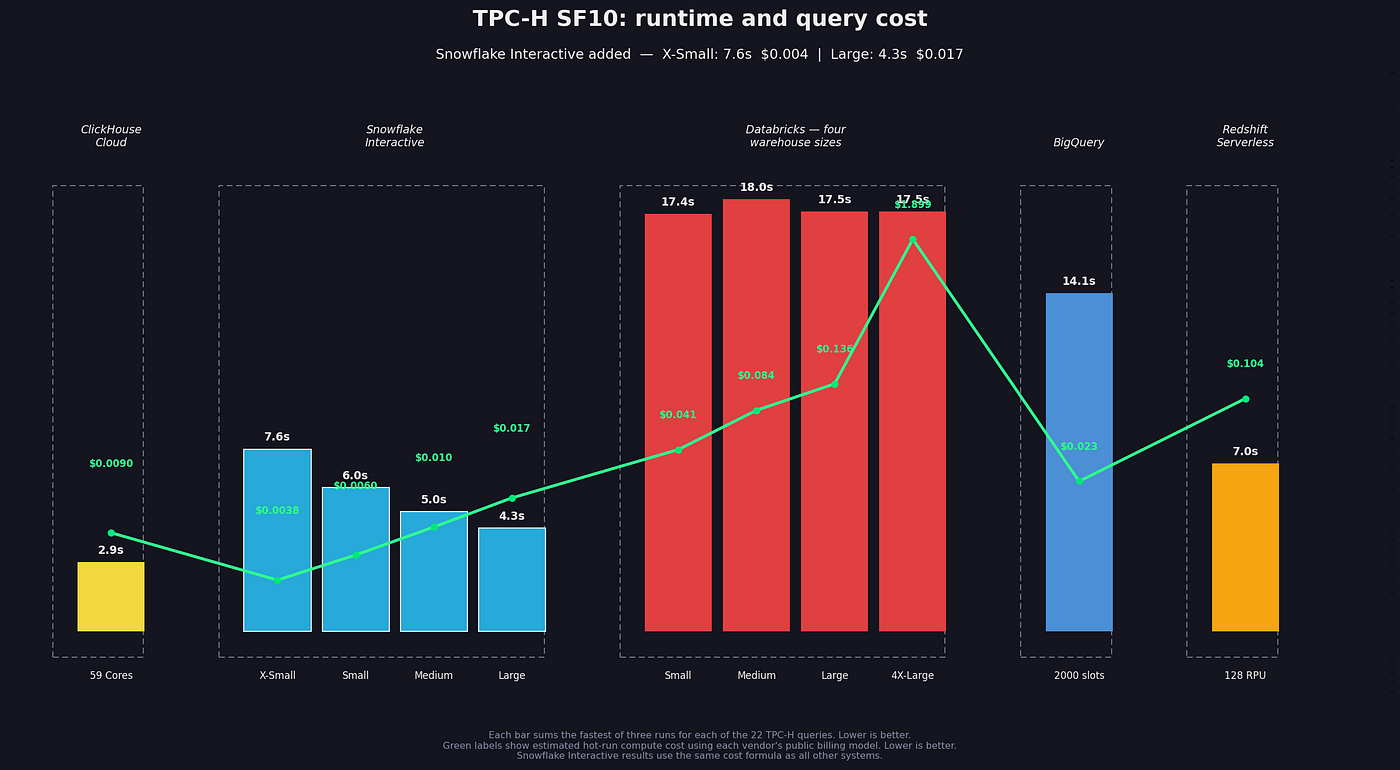
Figure 7: TPC-H at 10GB, the same engines and metrics. ClickHouse and Snowflake Interactive are within 10% of each other, with the other engines well behind.
Non-Interactive figures are ClickHouse’s published blog numbers; Snowflake Interactive is my measured result. Rows are ordered by cost-performance (runtime x cost, lower is better) and show the best configuration per engine; the SF100 table uses the Small/Medium/Large Interactive sizes that line up with ClickHouse’s Snowflake configs, while the 2X-Large (9.1s) from the Reyden chart above is faster still but trades cost-performance for raw speed.
Two things stand out. At 100GB, Snowflake Interactive holds the top three cost-performance positions outright, ahead of ClickHouse Cloud, every Databricks size, BigQuery and Redshift. It also beats ClickHouse Cloud on both raw runtime and cost (12.7s / $0.051 versus 19.8s / $0.063), the very engine ClickHouse’s own blog left out. Against Snowflake’s own same-size standard Gen2 warehouse, Interactive is about 1.6x faster and about 4x cheaper, which is exactly the point of the in-memory serving tier. At 10GB the field is tighter, with ClickHouse and Interactive in a near-tie at the top and the rest some way back.
TPC-H is a useful, well-understood yardstick, but at 22 join queries and up to 1TB it is the easy end of the pool for a serving engine. The more revealing test is CostBench: 43 queries against 18TB of ClickBench data, where the cost-performance gaps get much wider.
While I can’t share any further comparisons with Databricks, but below is the larger summary compared with ClickHouse. Here, I have kept the results reported by ClickHouse in their initial benchmark blog, but added Snowflake Interactive (a rather suspicious omission from the initial blog).
Validating against ClickHouse’s reported numbers
Before adding Interactive, I reproduced the Snowflake standard-warehouse numbers from ClickHouse’s blog to confirm my harness matched theirs. It does, closely, at SF10. At SF100 my standard numbers run about 30% slower than the blog’s, which must come down to standard variance.

Deep Dive 2: CostBench (code)
Cost-performance ranking (shorter bar = better) and runtime-vs-cost scatter (lower-left = better) for each scale.
Snowflake standard warehouses are excluded; ClickHouse and the other engines are CostBench’s published points from the public repo while the Interactive values are accessible in my fork of CostBench.
A couple of notes on the benchmarking experience:
- CostBench is a significantly more challenging benchmark overall — there are 43 queries, and the scale of data is significant at 100B scale (18TB). This appears to play to Snowflake’s strengths on complex query profiles.
- Clustering makes a significant difference to scan performance and pruning — ClickHouse use a carefully chosen primary key which results in strong compression and performance (buried deep in their repo on table creation), which I exactly imitate to cluster for our Interactive Warehouse runs:
PRIMARY KEY (CounterID, EventDate, UserID, EventTime, WatchID)- Snowflake’s Interactive Warehouses allow the option of a standard warehouse as a fallback for very heavy queries, which would otherwise block threads designed for the typical high-concurrency profile of Interactive. For the large 100B scale (18TB), this fallback warehouse was used on 16 queries. Importantly, this means that even if an Interactive Warehouse isn’t the ideal fit for a query, it will still execute and complete transparently, even at enterprise scale. And at least in this case, it did so at better price-performance than any other measured engine.
- At 100B scale, Snowflake’s 4XL Gen2 warehouse achieved slightly better price performance than even the 4XL Interactive configuration (1.28x better than the best ClickHouse configuration), once the data was clustered in line with ClickHouse’s key. I haven’t included this result, since the focus here is low latency, high concurrency, but would be happy to share the code if anyone is interested. Of note, standard warehouses can suspend and resume in seconds, leading to lower costs for sporadic batch workloads, while ClickHouse’s architecture will punish this type of query pattern since the cache needs to be warmed for adequate performance, adding significant spin up / spin down costs. With Snowflake, you have a wide toolkit to match to different workloads — ClickHouse is closer to a point solution for low latency, high concurrency, roughly the same domain as Snowflake Interactive Warehouses.
Results Summary
Figure 2: repeated for clarity, and showing the cost-performance score rating between Snowflake, ClickHouse, and Databricks at the 1B, 10B and 100B scales for CostBench.
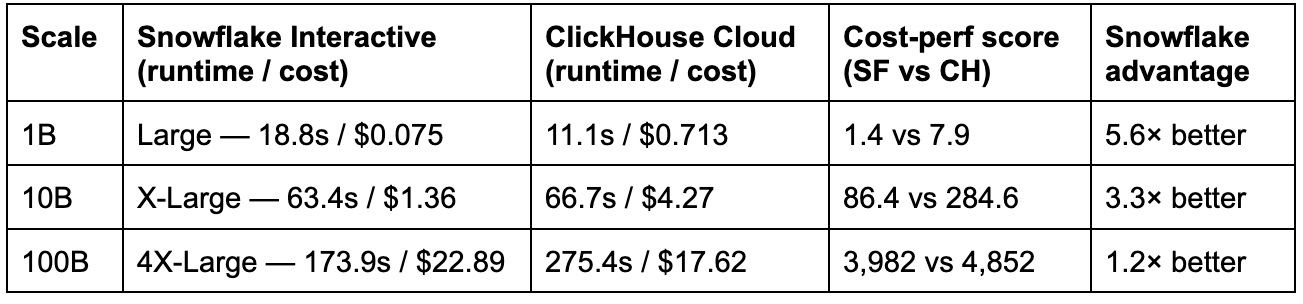
1B rows — Snowflake Interactive Large is 1st
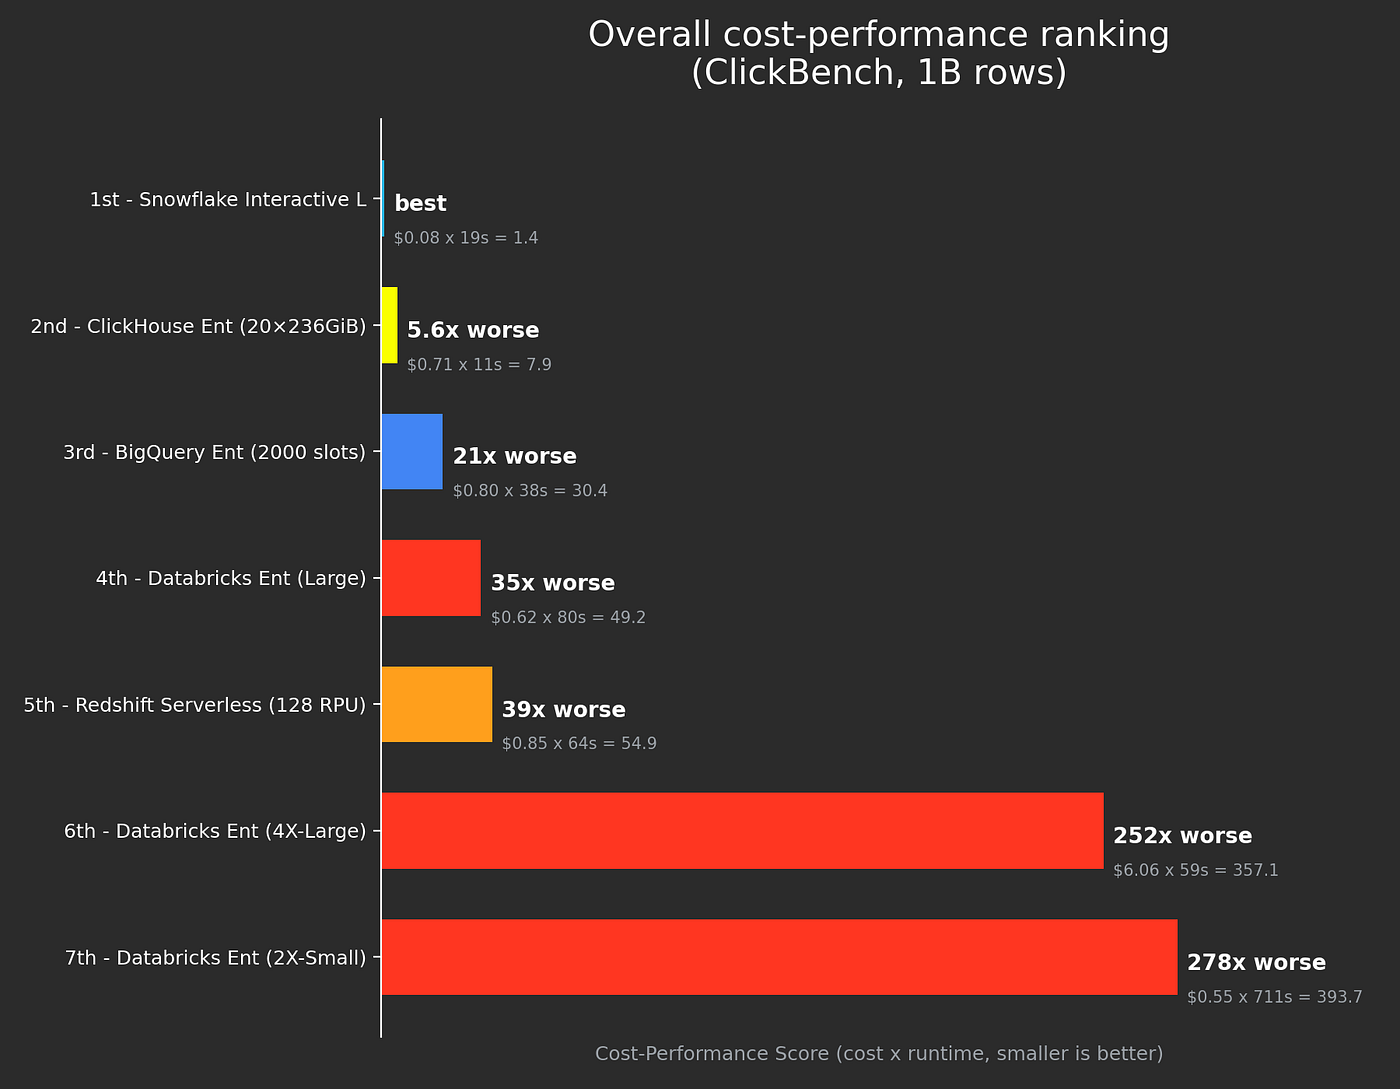
Figure 8: cost-performance for CostBench @ 1B rows
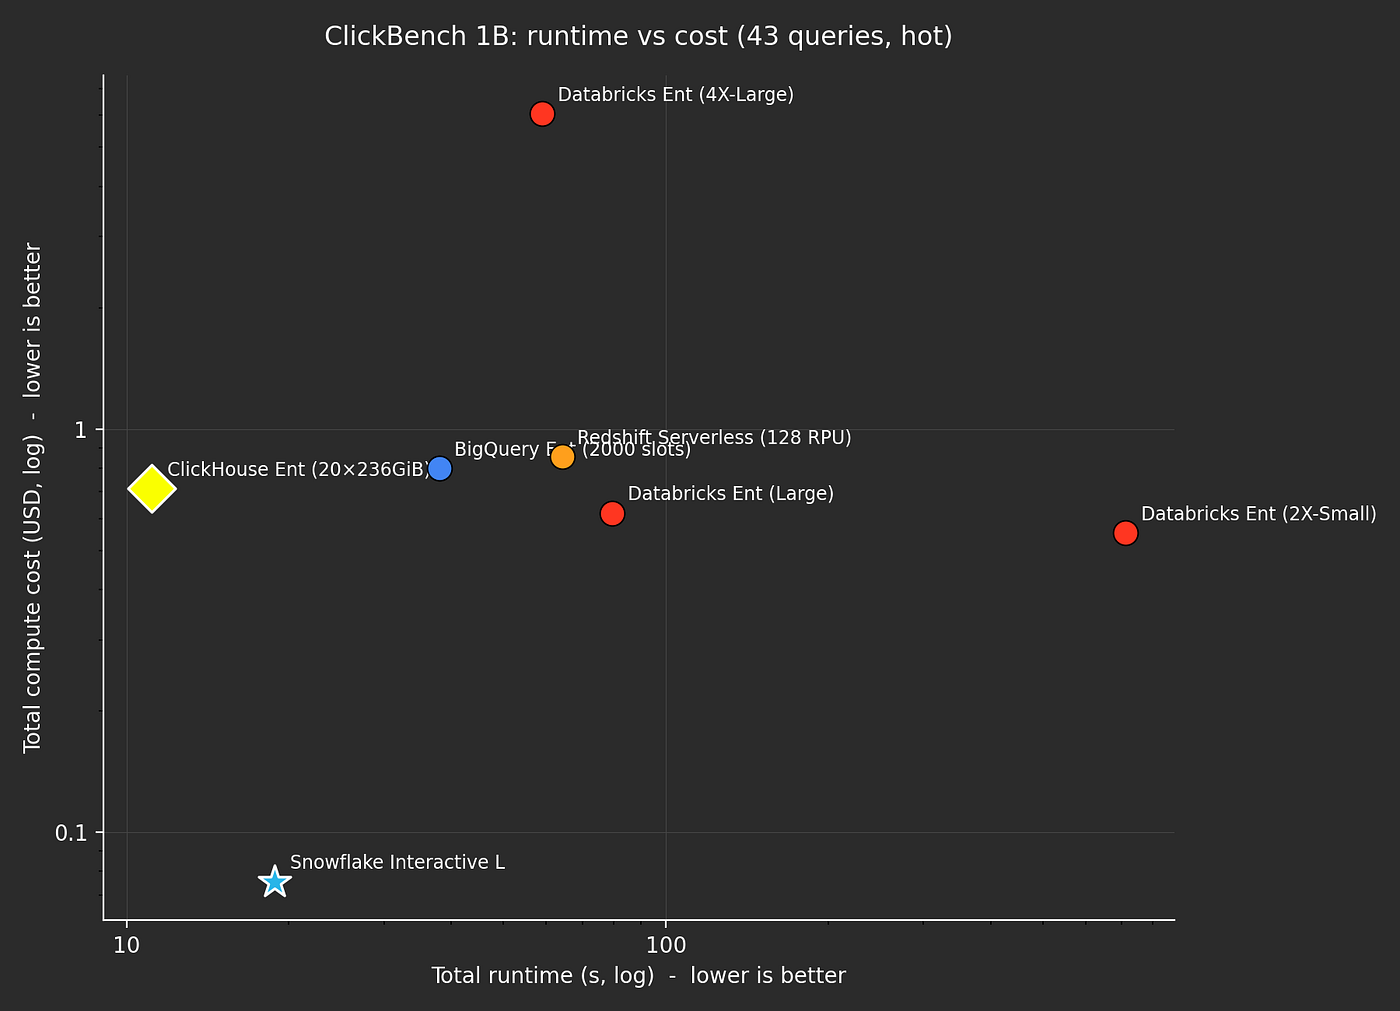
Figure 9: cost vs performance for CostBench @ 100B rows
10B rows — Snowflake Interactive X-Large is 1st
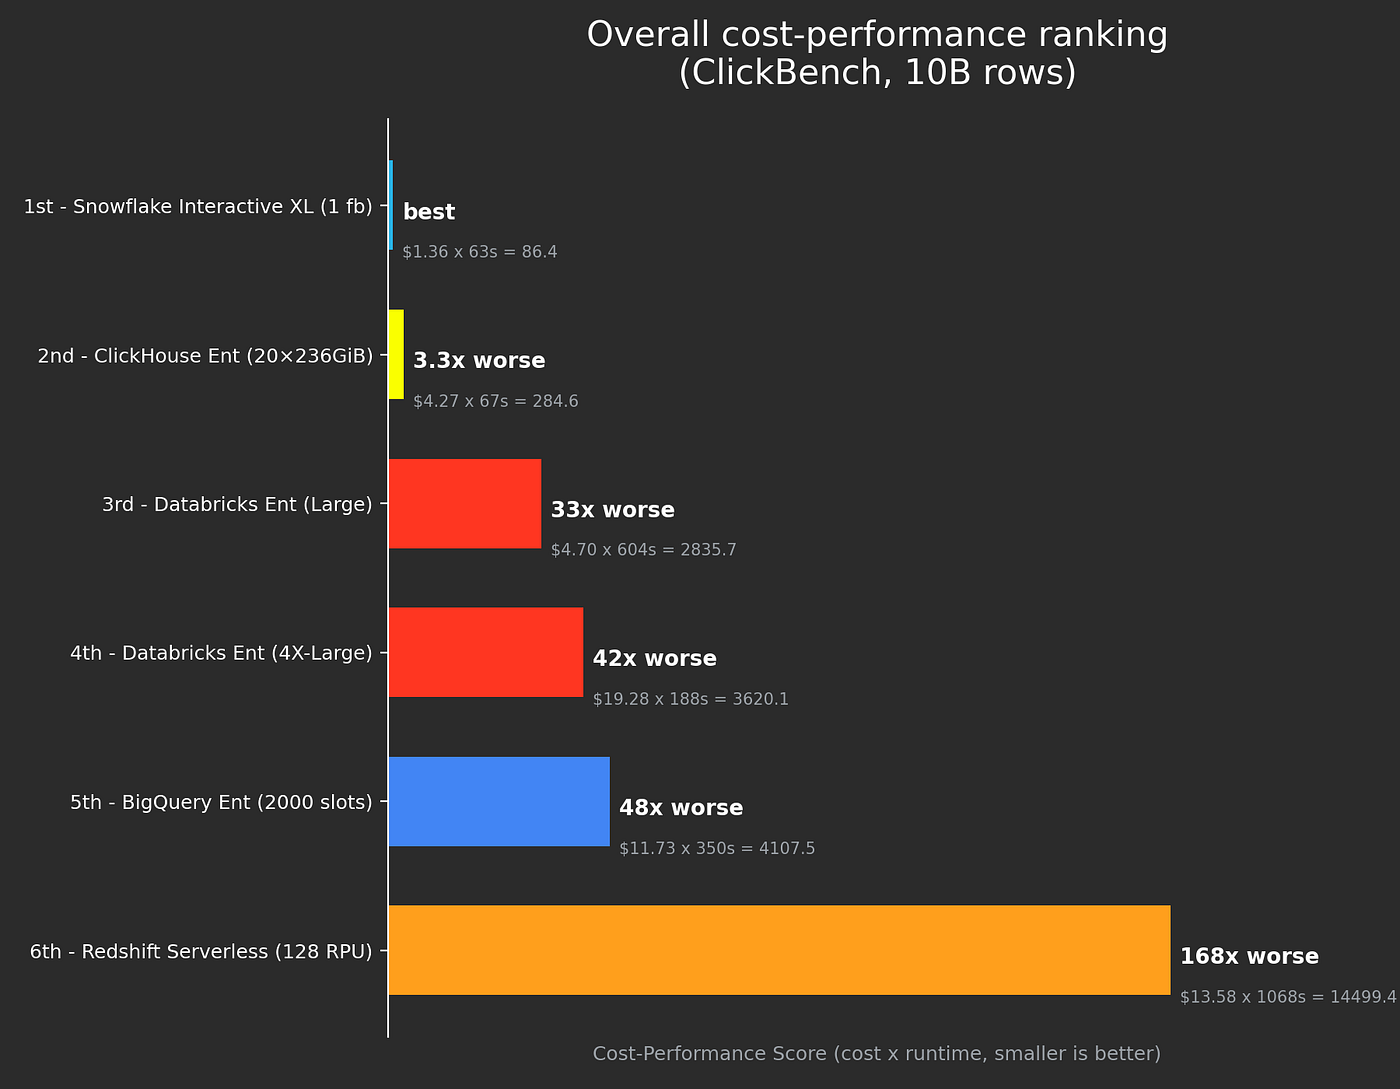
Figure 10: cost-performance for CostBench @ 10B rows

Figure 11: cost vs performance for CostBench @ 100B rows
100B rows — Snowflake Interactive 4X-Large is 1st

Figure 12: cost-performance for CostBench @ 100B rows

Figure 13: cost vs performance for CostBench @ 100B rows
메타데이터
- post_id
- 3fc748ae6967
- slug
- red-vs-blue-vs-yellow-benchmarking-low-latency-high-concurrency-analytics-engines-3fc748ae6967
- url
- https://medium.com/@dans_floor/red-vs-blue-vs-yellow-benchmarking-low-latency-high-concurrency-analytics-engines-3fc748ae6967
- canonical_url
- https://medium.com/@dans_floor/red-vs-blue-vs-yellow-benchmarking-low-latency-high-concurrency-analytics-engines-3fc748ae6967
- author_url
- https://medium.com/@dans_floor
- status
- ok
- fetched_at
- 2026-06-22 12:55:45