Instalar Istio, k6, testkube y microservices-demo (Online Boutique) en Orbstack
Armar un cluster k8s con Istio, k6, teskube y una aplicacion de ejemplo en Orbstack corriendo en un Macbook para efectos de aprendizaje.
Instalar Istio, k6, testkube y microservices-demo (Online Boutique) en Orbstack
Prerrequisitos
- Mac con 16 GB RAM
- Tener OrbStack instalado y funcionando en el Mac
- Tener habilitado el Kubernetes en la consola de OrbStack
- Tener instalado istioctl, kubectl y helm (se pueden instalar con brew)
- Habilitar Rosetta en Orbstack para ejecutar imágenes Intel (las imágenes ARM dan problemas)
Paso 1: Instalar Istio en OrbStack
Verificación del cluster
Primero, asegúrate que tu cluster de Kubernetes en OrbStack esté funcionando correctamente:
kubectl get nodesInstalación de Istio
Utiliza istioctl para instalar Istio con el perfil predeterminado:
istioctl install --set profile=default -yEste comando instalará los componentes principales de Istio, incluyendo istiod, istio-ingressgateway e istio-egressgateway.
Habilitar inyección automática de sidecar
Habilita la inyección automática de sidecar en el namespace por defecto (o en el que vayas a utilizar):
kubectl label namespace default istio-injection=enabledPaso 2: Instalar microservices-demo (Online Boutique)
La aplicación microservices-demo de Google es un ejemplo de arquitectura de microservicios pensada para demostrar, probar y enseñar conceptos de Kubernetes, Istio y herramientas de observabilidad. Simula una tienda online llamada Hipster Shop, compuesta por múltiples servicios independientes (como catálogo, carrito, pagos, recomendaciones, etc.) que se comunican entre sí vía gRPC y HTTP/REST. Cada servicio está desarrollado en un lenguaje diferente y empaquetado en un contenedor, lo que permite mostrar buenas prácticas de despliegue, escalado, monitoreo y trazabilidad en entornos de microservicios, así como integrar fácilmente herramientas como Prometheus, Grafana, Jaeger y Kiali para observación y análisis.
Instalación
kubectl apply -f <https://raw.githubusercontent.com/GoogleCloudPlatform/microservices-demo/main/release/kubernetes-manifests.yaml>Arreglar el healthcheck de cartservice
el servicio cartservice tiene un delay de 15 segundos para el healtcheck, luego de eso considera que el servició no subió apropiadamente y lo reinicia. En un cluster corriendo en un pc de escritorio ese delay es muy poco para la tecnología que corre ese pod (.net). Ejecuta el siguiente comando para cambiar el valor de 15 seg a 60 seg.
kubectl patch deployment cartservice --type='json' -p='[
{
"op": "replace",
"path": "/spec/template/spec/containers/0/livenessProbe/initialDelaySeconds",
"value": 60
},
{
"op": "replace",
"path": "/spec/template/spec/containers/0/livenessProbe/timeoutSeconds",
"value": 5
},
{
"op": "replace",
"path": "/spec/template/spec/containers/0/readinessProbe/initialDelaySeconds",
"value": 60
},
{
"op": "replace",
"path": "/spec/template/spec/containers/0/readinessProbe/timeoutSeconds",
"value": 5
}
]'
Arregla el problema de 00MKilled del cartservice.
Este mismo pod se reinicia por problemas de memoria, la solución es asignarle más memoria, duplicando el valor de requests y limits el el deployment.
kubectl patch deployment cartservice --type='json' -p='[ { "op": "replace", "path": "/spec/template/spec/containers/0/resources/limits/memory", "value": "256Mi" }, { "op": "replace", "path": "/spec/template/spec/containers/0/resources/requests/memory", "value": "128Mi" }]'Paso 3: Configurar la aplicación para que use Istio.
Instala los CRD necesarios para poder desplegar los gateway
kubectl apply -f <https://github.com/kubernetes-sigs/gateway-api/releases/download/v1.3.0/standard-install.yaml>Instala los manifiestos de Istio
kubectl apply -f <https://raw.githubusercontent.com/GoogleCloudPlatform/microservices-demo/main/release/istio-manifests.yaml>Solucionar los problemas de duplicidad de IngressGateway
Orbstack usa K3s como servidor Kubernetes. en K3s cada Service LoadBalancer dispara un svclb (DaemonSet con rancher/klipper-lb). El Gateway de Gateway API (istio-gateway) que que se crea con el manifiesto de Istio aplicado gatilla que el controlador de Istio genere un Service istio-gateway-istio (type LoadBalancer) y su Deployment (istio-gateway-istio). K3s intentará publicarlo en los puertos 80 y 15021, pero estos puertos ya están siendo utilizados por svclb-istio-ingressgateway-, Esa es la razón de que el pod quede en estado Pending.*
vamos a usar el IngressGateway creado con la instalación de Istio y eliminar el que se creó por defecto y que quedó Pending:
kubectl delete -n default [gateway.gateway.networking.k8s.io](<http://gateway.gateway.networking.k8s.io/>) istio-gateway
kubectl delete -n default [httproute.gateway.networking.k8s.io](<http://httproute.gateway.networking.k8s.io/>) frontend-route
Crea un Gateway “clásico” de Istio que seleccione tu istio-ingressgateway existente:
Crea un archivo llamado frontend-gw.yaml con el siguiente contenido.
# frontend-gw.yaml
apiVersion: networking.istio.io/v1beta1
kind: Gateway
metadata:
  name: frontend-gw
  namespace: default
spec:
  selector:
    istio: ingressgateway   # << usa el istio-ingressgateway ya desplegado
  servers:
  - port:
      number: 80
      name: http
      protocol: HTTP
    hosts:
    - "*"
Aplica este recurso con:
kubectl apply -f frontend-gw.yamlVincula el VirtualService existente (frontend) a este gateway:
kubectl patch virtualservice frontend -n default --type='merge' -p '{"spec":{"gateways":["frontend-gw"]}}'Borrar el Service instalado originalmente (antes de istio) que figura como Pending
kubectl delete service frontend-externalPaso 4: Instalar Kiali, Prometheus y Grafana para observabilidad.
Prometheus, Kiali y Grafana cumplen roles complementarios en la observabilidad de un clúster Kubernetes y su malla de servicios. Prometheus se encarga de recolectar, almacenar y consultar métricas de los servicios y del propio clúster, gracias a su modelo de series temporales y su lenguaje de consultas PromQL. Kiali actúa como la consola de gestión y visualización para Istio (u otras mallas de servicios compatibles), mostrando gráficamente el tráfico entre microservicios, la topología de la malla y el estado de los componentes, además de facilitar el troubleshooting. Grafana se utiliza para crear dashboards interactivos y visualizaciones personalizadas a partir de datos que provienen de Prometheus (y muchas otras fuentes), permitiendo monitoreo en tiempo real y análisis histórico de métricas.
💡 Para efectos de este laboratorio se instalará la versión 1.26 (que coincide con la versión de Istio instalada anteriormente.
kubectl apply -f <https://raw.githubusercontent.com/istio/istio/release-1.26/samples/addons/kiali.yaml>
kubectl apply -f <https://raw.githubusercontent.com/istio/istio/release-1.26/samples/addons/prometheus.yaml>
kubectl apply -f <https://raw.githubusercontent.com/istio/istio/release-1.26/samples/addons/grafana.yaml>
Ahora se puede acceder a la consola de Kiali (desde orbstack se puede buscar el servicio y dar click en el enlace). En la consola de Kiali podrás ver las aplicaciones que están siendo observadas por Istio. Anda al menú Traffic Graph y filtra por el Namespace Default (que es donde tenemos instalada la aplicación microservices-demo)
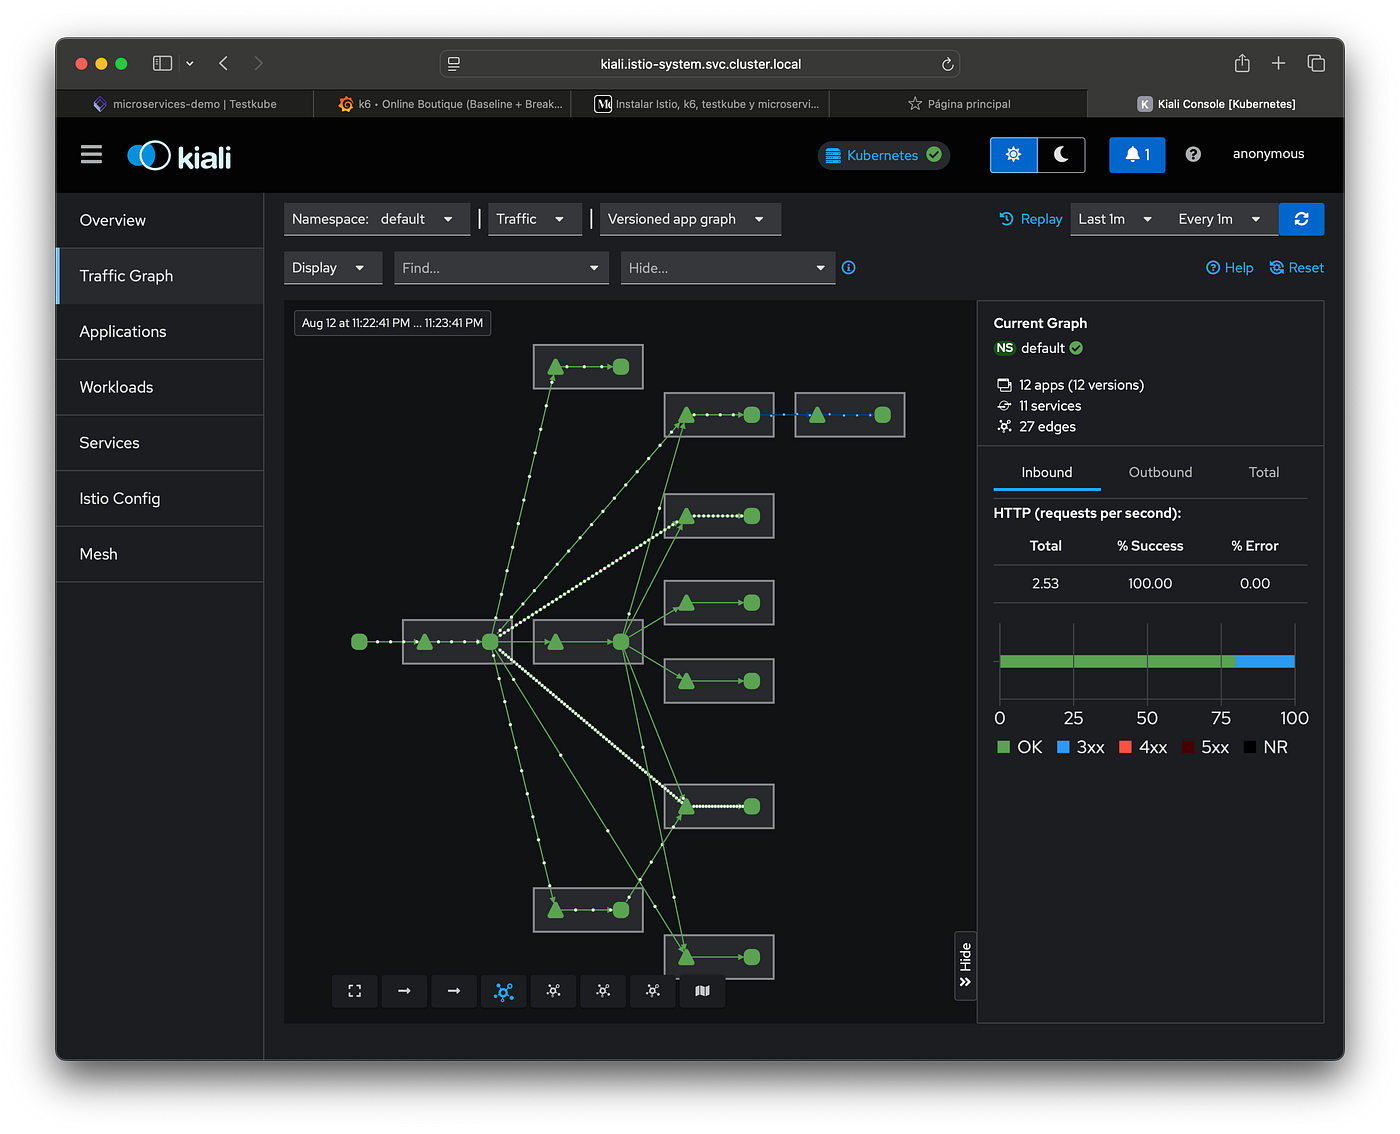
Vista de microservices-demo desde Kiali
Paso 5: Instalar k6 y testkube para hacer pruebas de stress a microservices-demo
Testkube es una plataforma de testing nativa para Kubernetes que permite ejecutar y orquestar pruebas directamente dentro de un clúster, sin tener que salirte del entorno donde corre tu aplicación.
A nivel técnico, Testkube instala recursos en el clúster (CRDs, controladores y servicios) que:
- Registran tipos de pruebas y configuraciones.
- Ejecutan las pruebas como Jobs o Pods en Kubernetes.
- Guardan los resultados en su backend (puede ser en el propio clúster o remoto).
- Exponen una API REST/CLI para que las ejecutes y consultes desde fuera.
Para instalarla ejecuta:
helm repo add kubeshop <https://kubeshop.github.io/helm-charts>
helm repo update
helm upgrade --install testkube kubeshop/testkube \\
-n testkube --create-namespace \\
--wait --timeout 5m --atomic
Esto instala el testkube, pero no instala el dashboard puesto que se eliminó en versiones posteriores a la 1.17 de la dsitribución Open Source (se sigue entregando en la distribución comercial), por tanto hay que instalar el dashboard aparte:
helm install testkube-dashboard kubeshop/testkube-dashboard --version 1.16.7 -n testkube💡 La versión 1.16.7 es la ultima que se distribuyó con el dashboard.
Configurar una nueva prueba (test)
Ahora hay que ejecutar una prueba de carga sobre microservices-demo. Para esto crearemos una prueba (new test). En el dashboard de testkube ir a la opción nuevo test, usar la opción “k6/test” y pegar el siguiente script:
import http from 'k6/http';
import { check, sleep } from 'k6';

// ==================== CONFIGURACIÓN (Perfil: Baseline) ====================
export const options = {
  scenarios: {
    baseline: {
      executor: 'ramping-vus',
      startVUs: 0,
      stages: [
        { duration: '1m', target: 10 }, // warm-up
        { duration: '3m', target: 40 }, // carga estable
        { duration: '1m', target: 0 },  // cool-down
      ],
      gracefulRampDown: '30s',
    },
  },
  thresholds: {
    http_req_failed: ['rate<0.01'],
    http_req_duration: ['p(95)<1000', 'p(99)<2000'],
    'http_req_duration{step:checkout}': ['p(95)<1400'],
    'checks{step:checkout}': ['rate>0.97'],
  },
  noConnectionReuse: __ENV.NO_CONN_REUSE === 'true',
};

// ==================== PARÁMETROS ====================
const BASE = __ENV.BASE_URL || 'http://frontend.default.svc.cluster.local';

// IDs válidos frecuentes en Online Boutique
const PRODUCT_IDS = [
  'OLJCESPC7Z', // Lens
  '1YMWWN1N4O', // Camera
  '66VCHSJNUP', // Hoodie
  '2ZYFJ3GM2N', // Shoes
  '6E92ZMYYFZ', // Socks
  '9SIQT8TOJO', // T-shirt
];

// ==================== HELPERS ====================
function get(url, tags) {
  return http.get(url, { tags });
}
function postForm(url, body, tags) {
  return http.post(url, body, {
    headers: { 'Content-Type': 'application/x-www-form-urlencoded' },
    tags,
  });
}
function pickProductId() {
  // elige un ID al azar de la lista
  const i = Math.floor(Math.random() * PRODUCT_IDS.length);
  return PRODUCT_IDS[i];
}

// ==================== TEST MIX ====================
export default function () {
  // 1) Home
  let res = get(`${BASE}/`, { step: 'home' });
  check(res, { 'home 200': (r) => r.status === 200 }, { step: 'home' });

  // 2) Ver producto
  const PID = pickProductId();
  res = get(`${BASE}/product/${PID}`, { step: 'product' });
  check(res, { 'product 200': (r) => r.status === 200 }, { step: 'product' });

  // 3) Añadir al carrito (form-urlencoded)
  res = postForm(`${BASE}/cart`, `product_id=${PID}&quantity=1`, { step: 'add_to_cart' });
  check(res, { 'add to cart 200/302': (r) => r.status === 200 || r.status === 302 }, { step: 'add_to_cart' });

  // 4) Ver carrito y confirmar que contiene el ítem
  res = get(`${BASE}/cart`, { step: 'cart' });
  const hasItem = res.status === 200 && (res.body || '').includes(PID);
  check(null, { 'cart contiene item': () => hasItem }, { step: 'cart' });

  // 5) Mix de tráfico: ~30% hace checkout
  const doCheckout = Math.random() < 0.30;

  if (doCheckout && hasItem) {
    // Checkout (endpoint correcto es /cart/checkout)
    const checkoutBody =
      'email=test%40example.com' +
      '&street_address=1600+Amphitheatre+Pkwy' +
      '&zip_code=94043' +
      '&city=Mountain+View' +
      '&state=CA' +
      '&country=USA' +
      '&credit_card_number=4111111111111111' +   // sólo dígitos
      '&credit_card_expiration_month=1' +
      '&credit_card_expiration_year=2030' +
      '&credit_card_cvv=672';

    res = postForm(`${BASE}/cart/checkout`, checkoutBody, { step: 'checkout' });
    check(res, { 'checkout 200/302': (r) => r.status === 200 || r.status === 302 }, { step: 'checkout' });
  }

  // pacing entre iteraciones
  sleep(1);
}
El Script simula tráfico realista sobre Online Boutique (microservices‑demo) para:
- Validar la disponibilidad y latencia de las rutas clave (home, producto, carrito, checkout).
- Medir p95/p99 y tasa de errores bajo una carga moderada y escalonada.
- Generar métricas aptas para Prometheus/Grafana (si se configura la salida de k6).
Flujo funcional por cada iteración
- Home: GET / — verifica 200.
- Producto: GET /product/{id} — elige un ID válido al azar y verifica 200.
- Agregar al carrito: POST /cart con application/x-www-form-urlencoded — acepta 200/302.
- Ver carrito: GET /cart — confirma que el HTML contenga el product_id agregado.
- Checkout (30% de las veces): POST /cart/checkout con form-urlencoded — acepta 200/302.
- Pacing: sleep(1) antes de la siguiente iteración.
Los IDs de producto válidos se toman de una lista fija (6 elementos).
Escenario de carga
- Executor: ramping-vus.
- Etapas:
- 1 min → 10 VUs (warm‑up)
- 3 min → 40 VUs (carga estable)
- 1 min → 0 VUs (cool‑down)
- Ramp‑down: gracefulRampDown: 30s.
- Conexiones: noConnectionReuse controlable por env var NO_CONN_REUSE (útil si Istio genera 503/EOF).
Umbrales (thresholds)
- Errores globales: http_req_failed: rate < 1%.
- Latencia global: http_req_duration: p(95) < 1000 ms y p(99) < 2000 ms.
- Latencia en checkout: p(95) < 1400 ms.
- Éxito de checks en checkout: rate > 97%.
Si un umbral no se cumple, k6 finaliza con exit code ≠ 0 (útil para CI/CD).
Enviar las métricas a Grafana para poder armar un dashboard
Para poder armar un Dashboard en Grafana primero tenemos que configurar testkube para que tribute las métricas de cada ejecución de pruebas hacia prometheus, con esto podremos luego armar un Dashboard que se alimente de estas series de datos almacenadas. Se requiere en primer lugar configurar la prueba para que escriba los resultados directo a prometheus. Para esto, en la ventana de creación del script, bajo la opción de “Variables & Secrets” bajo la sección de argumentos agregar :
-o
experimental-prometheus-rw=http://prometheus.istio-system.svc.cluster.local:9090/api/v1/write
además hay que agregar una variable del tipo “basic” que se llame :
K6_PROMETHEUS_RW_SERVER_URL = <http://prometheus.istio-system.svc.cluster.local:9090/api/v1/write>Esto le dice a K6 que los resultados de las pruebas los escriba remotamente a prometheus que está en esa dirección.
Como el prometheus que trae Istio por defecto no tiene habilitada la opción de escritura remota se debe habilitar, de lo contrario k6 tributará las series de datos pero prometheus no sabra escucharlas. La manera más fácil es parchando el deployment de Prometheus para que acepte escritura remota:
kubectl patch deployment prometheus \\
-n istio-system \\
--type='json' \\
-p='[{"op": "add", "path": "/spec/template/spec/containers/1/args/-", "value": "--web.enable-remote-write-receiver"}]'
Para probarlo hay que ejecutar el script creado en testkube y mirar que corra sin errores.
Creación del Dashboard en Grafana
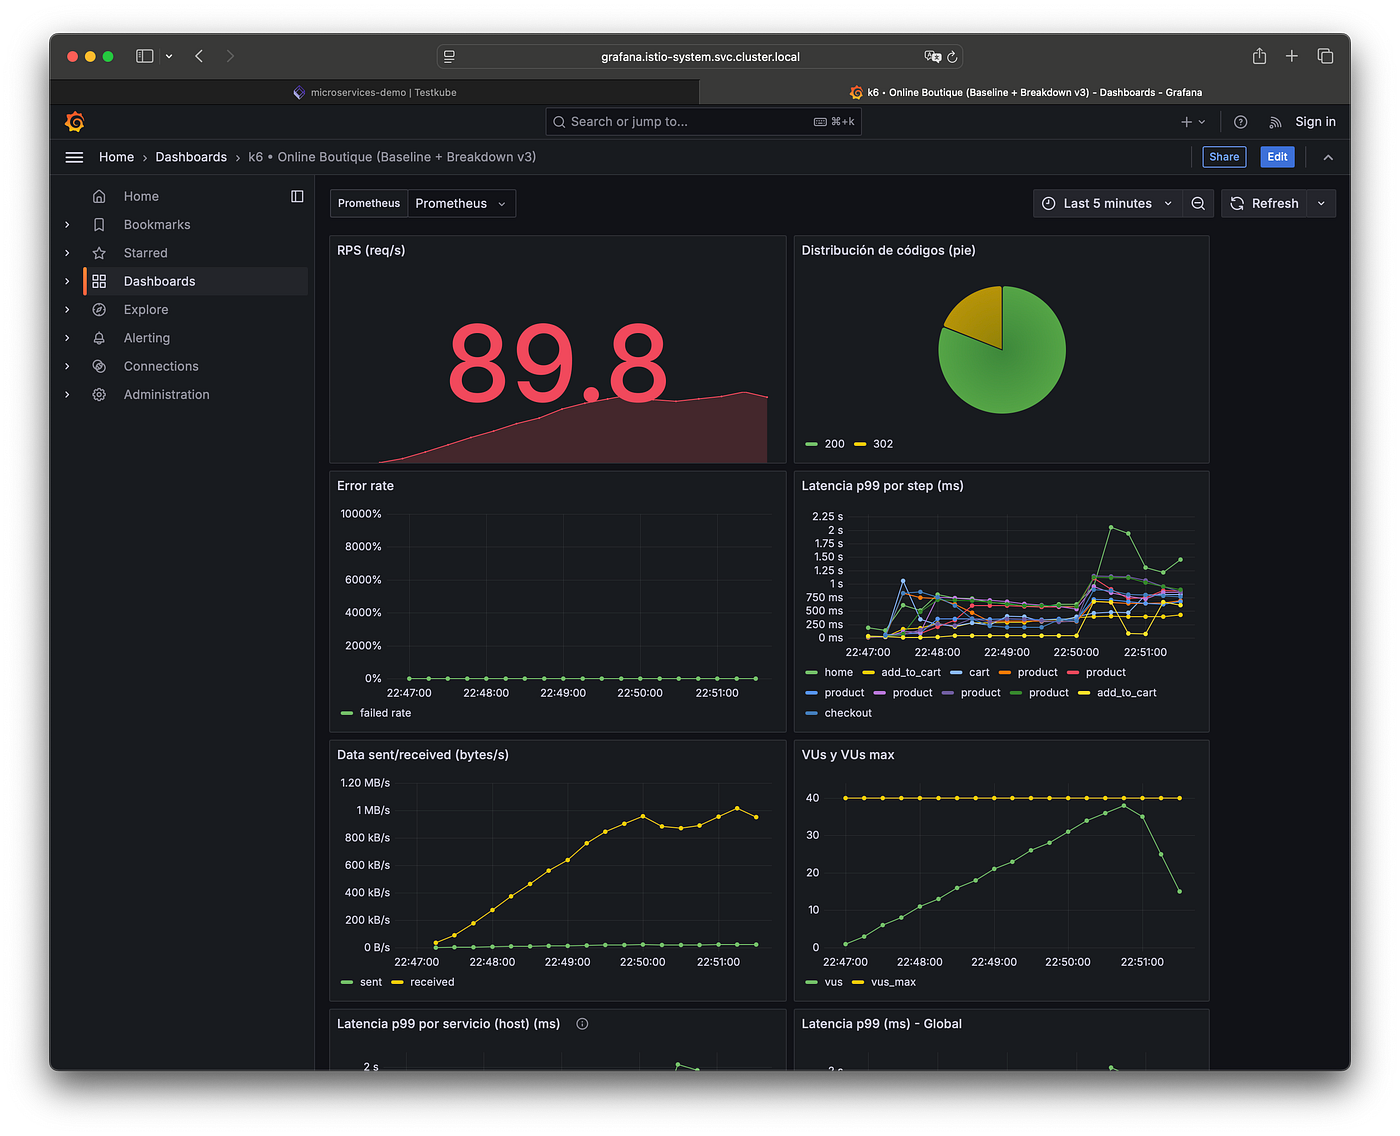
Dashboard de testkube con una ejecución en curso
Crearemos un dashboard en grafana que monitoree en tiempo real el rendimiento de pruebas de carga hechas con k6 sobre la aplicación Online Boutique. Este Dashboard presenta métricas clave como solicitudes por segundo (RPS), latencias globales y por paso del flujo, tasa de errores, validaciones funcionales (checks), número de usuarios virtuales activos, y tráfico de red. Además, segmenta el comportamiento por servicio (host) y por código HTTP, permitiendo detectar rápidamente cuellos de botella o fallas específicas.
También incluye vistas detalladas como distribución de códigos en formatos pie y barra, y un ranking de las 10 URLs más lentas según su percentil 99 de latencia. Gracias al uso de etiquetas como step y url en las métricas de k6, el tablero facilita el diagnóstico granular, permitiendo correlacionar picos de latencia o errores con pasos concretos del flujo de usuario o con servicios específicos.
Para Crear el Dashboard:
- En Grafana: Dashboards → New → Import.
- Pega el JSON de abajo.
- Selecciona tu datasource Prometheus cuando lo pida.
{
"annotations": {
"list": [
{
"builtIn": 1,
"datasource": {
"type": "grafana",
"uid": "-- Grafana --"
},
"enable": true,
"hide": true,
"iconColor": "rgba(0, 211, 255, 1)",
"name": "Annotations & Alerts",
"type": "dashboard"
}
]
},
"editable": true,
"fiscalYearStartMonth": 0,
"graphTooltip": 0,
"id": 10,
"links": [],
"panels": [
{
"datasource": {
"type": "prometheus",
"uid": "$DS_PROMETHEUS"
},
"fieldConfig": {
"defaults": {
"mappings": [],
"thresholds": {
"mode": "absolute",
"steps": [
{
"color": "green",
"value": null
},
{
"color": "red",
"value": 80
}
]
}
},
"overrides": []
},
"gridPos": {
"h": 7,
"w": 11,
"x": 0,
"y": 0
},
"id": 1,
"options": {
"colorMode": "value",
"graphMode": "area",
"justifyMode": "auto",
"orientation": "auto",
"percentChangeColorMode": "standard",
"reduceOptions": {
"calcs": [
"lastNotNull"
],
"fields": "",
"values": false
},
"showPercentChange": false,
"textMode": "auto",
"wideLayout": true
},
"pluginVersion": "11.3.1",
"targets": [
{
"expr": "sum(rate(k6_http_reqs_total[1m]))",
"legendFormat": "RPS",
"refId": "A"
}
],
"title": "RPS (req/s)",
"type": "stat"
},
{
"datasource": {
"type": "prometheus",
"uid": "$DS_PROMETHEUS"
},
"fieldConfig": {
"defaults": {
"color": {
"mode": "palette-classic"
},
"custom": {
"hideFrom": {
"legend": false,
"tooltip": false,
"viz": false
}
},
"mappings": []
},
"overrides": []
},
"gridPos": {
"h": 7,
"w": 10,
"x": 11,
"y": 0
},
"id": 10,
"options": {
"legend": {
"displayMode": "list",
"placement": "bottom",
"showLegend": true
},
"pieType": "pie",
"reduceOptions": {
"calcs": [
"lastNotNull"
],
"fields": "",
"values": false
},
"tooltip": {
"mode": "single",
"sort": "none"
}
},
"pluginVersion": "11.3.1",
"targets": [
{
"expr": "sum by (status) (rate(k6_http_reqs_total[1m]))",
"legendFormat": "{{status}}",
"refId": "A"
}
],
"title": "Distribución de códigos (pie)",
"type": "piechart"
},
{
"datasource": {
"type": "prometheus",
"uid": "$DS_PROMETHEUS"
},
"fieldConfig": {
"defaults": {
"color": {
"mode": "palette-classic"
},
"custom": {
"axisBorderShow": false,
"axisCenteredZero": false,
"axisColorMode": "text",
"axisLabel": "",
"axisPlacement": "auto",
"barAlignment": 0,
"barWidthFactor": 0.6,
"drawStyle": "line",
"fillOpacity": 0,
"gradientMode": "none",
"hideFrom": {
"legend": false,
"tooltip": false,
"viz": false
},
"insertNulls": false,
"lineInterpolation": "linear",
"lineWidth": 1,
"pointSize": 5,
"scaleDistribution": {
"type": "linear"
},
"showPoints": "auto",
"spanNulls": false,
"stacking": {
"group": "A",
"mode": "none"
},
"thresholdsStyle": {
"mode": "off"
}
},
"mappings": [],
"thresholds": {
"mode": "absolute",
"steps": [
{
"color": "green",
"value": null
},
{
"color": "red",
"value": 80
}
]
},
"unit": "percentunit"
},
"overrides": []
},
"gridPos": {
"h": 8,
"w": 11,
"x": 0,
"y": 7
},
"id": 4,
"options": {
"legend": {
"calcs": [],
"displayMode": "list",
"placement": "bottom",
"showLegend": true
},
"tooltip": {
"mode": "single",
"sort": "none"
}
},
"pluginVersion": "11.3.1",
"targets": [
{
"expr": "avg(k6_http_req_failed_rate)",
"legendFormat": "failed rate",
"refId": "A"
}
],
"title": "Error rate",
"type": "timeseries"
},
{
"datasource": {
"type": "prometheus",
"uid": "$DS_PROMETHEUS"
},
"fieldConfig": {
"defaults": {
"color": {
"mode": "palette-classic"
},
"custom": {
"axisBorderShow": false,
"axisCenteredZero": false,
"axisColorMode": "text",
"axisLabel": "",
"axisPlacement": "auto",
"barAlignment": 0,
"barWidthFactor": 0.6,
"drawStyle": "line",
"fillOpacity": 0,
"gradientMode": "none",
"hideFrom": {
"legend": false,
"tooltip": false,
"viz": false
},
"insertNulls": false,
"lineInterpolation": "linear",
"lineWidth": 1,
"pointSize": 5,
"scaleDistribution": {
"type": "linear"
},
"showPoints": "auto",
"spanNulls": false,
"stacking": {
"group": "A",
"mode": "none"
},
"thresholdsStyle": {
"mode": "off"
}
},
"mappings": [],
"thresholds": {
"mode": "absolute",
"steps": [
{
"color": "green",
"value": null
},
{
"color": "red",
"value": 80
}
]
},
"unit": "ms"
},
"overrides": []
},
"gridPos": {
"h": 8,
"w": 10,
"x": 11,
"y": 7
},
"id": 3,
"options": {
"legend": {
"calcs": [],
"displayMode": "list",
"placement": "bottom",
"showLegend": true
},
"tooltip": {
"mode": "single",
"sort": "none"
}
},
"pluginVersion": "11.3.1",
"targets": [
{
"expr": "k6_http_req_duration_p99{step!=\"\"} * 1000",
"legendFormat": "{{step}}",
"refId": "A"
}
],
"title": "Latencia p99 por step (ms)",
"type": "timeseries"
},
{
"datasource": {
"type": "prometheus",
"uid": "$DS_PROMETHEUS"
},
"fieldConfig": {
"defaults": {
"color": {
"mode": "palette-classic"
},
"custom": {
"axisBorderShow": false,
"axisCenteredZero": false,
"axisColorMode": "text",
"axisLabel": "",
"axisPlacement": "auto",
"barAlignment": 0,
"barWidthFactor": 0.6,
"drawStyle": "line",
"fillOpacity": 0,
"gradientMode": "none",
"hideFrom": {
"legend": false,
"tooltip": false,
"viz": false
},
"insertNulls": false,
"lineInterpolation": "linear",
"lineWidth": 1,
"pointSize": 5,
"scaleDistribution": {
"type": "linear"
},
"showPoints": "auto",
"spanNulls": false,
"stacking": {
"group": "A",
"mode": "none"
},
"thresholdsStyle": {
"mode": "off"
}
},
"mappings": [],
"thresholds": {
"mode": "absolute",
"steps": [
{
"color": "green",
"value": null
},
{
"color": "red",
"value": 80
}
]
},
"unit": "Bps"
},
"overrides": []
},
"gridPos": {
"h": 8,
"w": 11,
"x": 0,
"y": 15
},
"id": 7,
"options": {
"legend": {
"calcs": [],
"displayMode": "list",
"placement": "bottom",
"showLegend": true
},
"tooltip": {
"mode": "single",
"sort": "none"
}
},
"pluginVersion": "11.3.1",
"targets": [
{
"expr": "rate(k6_data_sent_total[1m])",
"legendFormat": "sent",
"refId": "A"
},
{
"expr": "rate(k6_data_received_total[1m])",
"legendFormat": "received",
"refId": "B"
}
],
"title": "Data sent/received (bytes/s)",
"type": "timeseries"
},
{
"datasource": {
"type": "prometheus",
"uid": "$DS_PROMETHEUS"
},
"fieldConfig": {
"defaults": {
"color": {
"mode": "palette-classic"
},
"custom": {
"axisBorderShow": false,
"axisCenteredZero": false,
"axisColorMode": "text",
"axisLabel": "",
"axisPlacement": "auto",
"barAlignment": 0,
"barWidthFactor": 0.6,
"drawStyle": "line",
"fillOpacity": 0,
"gradientMode": "none",
"hideFrom": {
"legend": false,
"tooltip": false,
"viz": false
},
"insertNulls": false,
"lineInterpolation": "linear",
"lineWidth": 1,
"pointSize": 5,
"scaleDistribution": {
"type": "linear"
},
"showPoints": "auto",
"spanNulls": false,
"stacking": {
"group": "A",
"mode": "none"
},
"thresholdsStyle": {
"mode": "off"
}
},
"mappings": [],
"thresholds": {
"mode": "absolute",
"steps": [
{
"color": "green",
"value": null
},
{
"color": "red",
"value": 80
}
]
}
},
"overrides": []
},
"gridPos": {
"h": 8,
"w": 10,
"x": 11,
"y": 15
},
"id": 6,
"options": {
"legend": {
"calcs": [],
"displayMode": "list",
"placement": "bottom",
"showLegend": true
},
"tooltip": {
"mode": "single",
"sort": "none"
}
},
"pluginVersion": "11.3.1",
"targets": [
{
"expr": "k6_vus",
"legendFormat": "vus",
"refId": "A"
},
{
"expr": "k6_vus_max",
"legendFormat": "vus_max",
"refId": "B"
}
],
"title": "VUs y VUs max",
"type": "timeseries"
},
{
"datasource": {
"type": "prometheus",
"uid": "$DS_PROMETHEUS"
},
"description": "Aplica label_replace para tener 'host' a partir de 'url'.",
"fieldConfig": {
"defaults": {
"color": {
"mode": "palette-classic"
},
"custom": {
"axisBorderShow": false,
"axisCenteredZero": false,
"axisColorMode": "text",
"axisLabel": "",
"axisPlacement": "auto",
"barAlignment": 0,
"barWidthFactor": 0.6,
"drawStyle": "line",
"fillOpacity": 0,
"gradientMode": "none",
"hideFrom": {
"legend": false,
"tooltip": false,
"viz": false
},
"insertNulls": false,
"lineInterpolation": "linear",
"lineWidth": 1,
"pointSize": 5,
"scaleDistribution": {
"type": "linear"
},
"showPoints": "auto",
"spanNulls": false,
"stacking": {
"group": "A",
"mode": "none"
},
"thresholdsStyle": {
"mode": "off"
}
},
"mappings": [],
"thresholds": {
"mode": "absolute",
"steps": [
{
"color": "green",
"value": null
},
{
"color": "red",
"value": 80
}
]
},
"unit": "ms"
},
"overrides": []
},
"gridPos": {
"h": 8,
"w": 11,
"x": 0,
"y": 23
},
"id": 9,
"options": {
"legend": {
"calcs": [],
"displayMode": "list",
"placement": "bottom",
"showLegend": true
},
"tooltip": {
"mode": "single",
"sort": "none"
}
},
"pluginVersion": "11.3.1",
"targets": [
{
"expr": "label_replace(k6_http_req_duration_p99, \"host\", \"$1\", \"url\", \"https?://([^/]+).*\") * 1000",
"legendFormat": "{{host}}",
"refId": "A"
}
],
"title": "Latencia p99 por servicio (host) (ms)",
"type": "timeseries"
},
{
"datasource": {
"type": "prometheus",
"uid": "$DS_PROMETHEUS"
},
"fieldConfig": {
"defaults": {
"color": {
"mode": "palette-classic"
},
"custom": {
"axisBorderShow": false,
"axisCenteredZero": false,
"axisColorMode": "text",
"axisLabel": "",
"axisPlacement": "auto",
"barAlignment": 0,
"barWidthFactor": 0.6,
"drawStyle": "line",
"fillOpacity": 0,
"gradientMode": "none",
"hideFrom": {
"legend": false,
"tooltip": false,
"viz": false
},
"insertNulls": false,
"lineInterpolation": "linear",
"lineWidth": 1,
"pointSize": 5,
"scaleDistribution": {
"type": "linear"
},
"showPoints": "auto",
"spanNulls": false,
"stacking": {
"group": "A",
"mode": "none"
},
"thresholdsStyle": {
"mode": "off"
}
},
"mappings": [],
"thresholds": {
"mode": "absolute",
"steps": [
{
"color": "green",
"value": null
},
{
"color": "red",
"value": 80
}
]
},
"unit": "ms"
},
"overrides": []
},
"gridPos": {
"h": 8,
"w": 10,
"x": 11,
"y": 23
},
"id": 2,
"options": {
"legend": {
"calcs": [],
"displayMode": "list",
"placement": "bottom",
"showLegend": true
},
"tooltip": {
"mode": "single",
"sort": "none"
}
},
"pluginVersion": "11.3.1",
"targets": [
{
"expr": "k6_http_req_duration_p99 * 1000",
"legendFormat": "p99",
"refId": "A"
}
],
"title": "Latencia p99 (ms) - Global",
"type": "timeseries"
},
{
"datasource": {
"type": "prometheus",
"uid": "$DS_PROMETHEUS"
},
"fieldConfig": {
"defaults": {
"color": {
"mode": "palette-classic"
},
"custom": {
"axisBorderShow": false,
"axisCenteredZero": false,
"axisColorMode": "text",
"axisLabel": "",
"axisPlacement": "auto",
"barAlignment": 0,
"barWidthFactor": 0.6,
"drawStyle": "line",
"fillOpacity": 0,
"gradientMode": "none",
"hideFrom": {
"legend": false,
"tooltip": false,
"viz": false
},
"insertNulls": false,
"lineInterpolation": "linear",
"lineWidth": 1,
"pointSize": 5,
"scaleDistribution": {
"type": "linear"
},
"showPoints": "auto",
"spanNulls": false,
"stacking": {
"group": "A",
"mode": "none"
},
"thresholdsStyle": {
"mode": "off"
}
},
"mappings": [],
"thresholds": {
"mode": "absolute",
"steps": [
{
"color": "green",
"value": null
},
{
"color": "red",
"value": 80
}
]
},
"unit": "percentunit"
},
"overrides": []
},
"gridPos": {
"h": 8,
"w": 11,
"x": 0,
"y": 31
},
"id": 5,
"options": {
"legend": {
"calcs": [],
"displayMode": "list",
"placement": "bottom",
"showLegend": true
},
"tooltip": {
"mode": "single",
"sort": "none"
}
},
"pluginVersion": "11.3.1",
"targets": [
{
"expr": "avg by (check) (k6_checks_rate)",
"legendFormat": "{{check}}",
"refId": "A"
}
],
"title": "Checks por nombre",
"type": "timeseries"
},
{
"datasource": {
"type": "prometheus",
"uid": "$DS_PROMETHEUS"
},
"fieldConfig": {
"defaults": {
"custom": {
"align": "auto",
"cellOptions": {
"type": "auto"
},
"inspect": false
},
"mappings": [],
"thresholds": {
"mode": "absolute",
"steps": [
{
"color": "green",
"value": null
},
{
"color": "red",
"value": 80
}
]
},
"unit": "ms"
},
"overrides": []
},
"gridPos": {
"h": 8,
"w": 10,
"x": 11,
"y": 31
},
"id": 12,
"options": {
"cellHeight": "sm",
"footer": {
"countRows": false,
"fields": "",
"reducer": [
"sum"
],
"show": false
},
"showHeader": true
},
"pluginVersion": "11.3.1",
"targets": [
{
"expr": "topk(10, k6_http_req_duration_p99{url!=\"\"} * 1000)",
"instant": true,
"legendFormat": "{{url}}",
"refId": "A"
}
],
"title": "Top 10 URLs más lentas (p99 ms)",
"type": "table"
},
{
"datasource": {
"type": "prometheus",
"uid": "$DS_PROMETHEUS"
},
"description": "Extrae host desde la label 'url' y suma RPS por host.",
"fieldConfig": {
"defaults": {
"color": {
"mode": "palette-classic"
},
"custom": {
"axisBorderShow": false,
"axisCenteredZero": false,
"axisColorMode": "text",
"axisLabel": "",
"axisPlacement": "auto",
"barAlignment": 0,
"barWidthFactor": 0.6,
"drawStyle": "line",
"fillOpacity": 0,
"gradientMode": "none",
"hideFrom": {
"legend": false,
"tooltip": false,
"viz": false
},
"insertNulls": false,
"lineInterpolation": "linear",
"lineWidth": 1,
"pointSize": 5,
"scaleDistribution": {
"type": "linear"
},
"showPoints": "auto",
"spanNulls": false,
"stacking": {
"group": "A",
"mode": "none"
},
"thresholdsStyle": {
"mode": "off"
}
},
"mappings": [],
"thresholds": {
"mode": "absolute",
"steps": [
{
"color": "green",
"value": null
},
{
"color": "red",
"value": 80
}
]
}
},
"overrides": []
},
"gridPos": {
"h": 8,
"w": 11,
"x": 0,
"y": 39
},
"id": 8,
"options": {
"legend": {
"calcs": [],
"displayMode": "list",
"placement": "bottom",
"showLegend": true
},
"tooltip": {
"mode": "single",
"sort": "none"
}
},
"pluginVersion": "11.3.1",
"targets": [
{
"expr": "sum by (host) ( rate(label_replace(k6_http_reqs_total, \"host\", \"$1\", \"url\", \"https?://([^/]+).*\")[1m]) )",
"legendFormat": "{{host}}",
"refId": "A"
}
],
"title": "RPS por servicio (host)",
"type": "timeseries"
},
{
"datasource": {
"type": "prometheus",
"uid": "$DS_PROMETHEUS"
},
"fieldConfig": {
"defaults": {
"mappings": [],
"thresholds": {
"mode": "absolute",
"steps": [
{
"color": "green",
"value": null
},
{
"color": "red",
"value": 80
}
]
},
"unit": "req/s"
},
"overrides": []
},
"gridPos": {
"h": 8,
"w": 10,
"x": 11,
"y": 39
},
"id": 11,
"options": {
"displayMode": "gradient",
"legend": {
"calcs": [],
"displayMode": "list",
"placement": "bottom",
"showLegend": false
},
"maxVizHeight": 300,
"minVizHeight": 16,
"minVizWidth": 8,
"namePlacement": "auto",
"orientation": "auto",
"reduceOptions": {
"calcs": [
"lastNotNull"
],
"fields": "",
"values": false
},
"showUnfilled": true,
"sizing": "auto",
"valueMode": "color"
},
"pluginVersion": "11.3.1",
"targets": [
{
"expr": "sum by (status) (rate(k6_http_reqs_total[1m]))",
"legendFormat": "{{status}}",
"refId": "A"
}
],
"title": "Distribución de códigos (bar gauge)",
"type": "bargauge"
}
],
"preload": false,
"schemaVersion": 40,
"tags": [],
"templating": {
"list": [
{
"current": {
"text": "Prometheus",
"value": "PBFA97CFB590B2093"
},
"label": "Prometheus",
"name": "DS_PROMETHEUS",
"options": [],
"query": "prometheus",
"refresh": 1,
"type": "datasource"
}
]
},
"time": {
"from": "now-30d",
"to": "now"
},
"timepicker": {},
"timezone": "browser",
"title": "k6 • Online Boutique (Baseline + Breakdown)",
"uid": "aeulllsr7k35sf",
"version": 2,
"weekStart": ""
}메타데이터
- post_id
- 3fdebcdd4bd2
- slug
- instalar-istio-y-y-microservices-demo-online-boutique-en-orbstack-3fdebcdd4bd2
- url
- https://medium.com/@macine/instalar-istio-y-y-microservices-demo-online-boutique-en-orbstack-3fdebcdd4bd2
- canonical_url
- https://medium.com/@macine/instalar-istio-y-y-microservices-demo-online-boutique-en-orbstack-3fdebcdd4bd2
- author_url
- https://medium.com/@macine
- status
- ok
- fetched_at
- 2026-06-22 12:55:45


