How to center and zoom to your GeoJSON in GeoPandas, Plotly and Folium.
Using in both library methods and Shapely to determine center and zoom.
How to center and fit your GeoJSON on a map in GeoPandas, Plotly and Folium.
Using both in-library methods, and GeoJSON and Shapely to determine center, zoom level, and bounds.
Somehow, the center of your map is in the middle of the Gulf of Guinea. Or, your Plotly map is either too far zoomed in or zoomed out for all the data. If, for example, you’re making a map in an unfamiliar library or on a dataset you haven’t completely explored, this could happen. How can we center our maps and zoom to a desired level using three popular geographical libraries: GeoPandas, Plotly, and Folium? Although most of it can eventually be found somewhere in the reference manuals, sometimes deeply buried, this story brings all the required elements together to get you started immediately.
Image created with www.magicstudio.com
First things first, what is centering a map? In this case, I mean have the center point of your data being at the center of the mapped area. It can either be the centroid, of all the data points and shapes, or the mean or median of their coordinates. Secondly, an appropriate zoom level for a map is the level at which all (desired) points and shapes are visible on the map.
There are two common patterns:
- Manually calculating the center and the desired zoom level, and then explicitly setting it,
- Or, using a fit to bounds method of a library that centers and scales to the plotted locations.
We’ll go through this in three parts: first, how to set the maps as desired. Then how to calculate/get the center, zoom level, and bounds. And finally, code and explanation on some elements I used in making the maps.
Part 1: Centering and zooming the maps
GeoPandas
In GeoPandas, the plot is fit to the bounds of the data by default. Thereby, it is centered on the GeoJSON and zoomed correctly by default.
import geopandas as gpd

gdf = gpd.read_file("filepath_of_geojson")
gdf.plot()
This simple code example will provide the following plot.
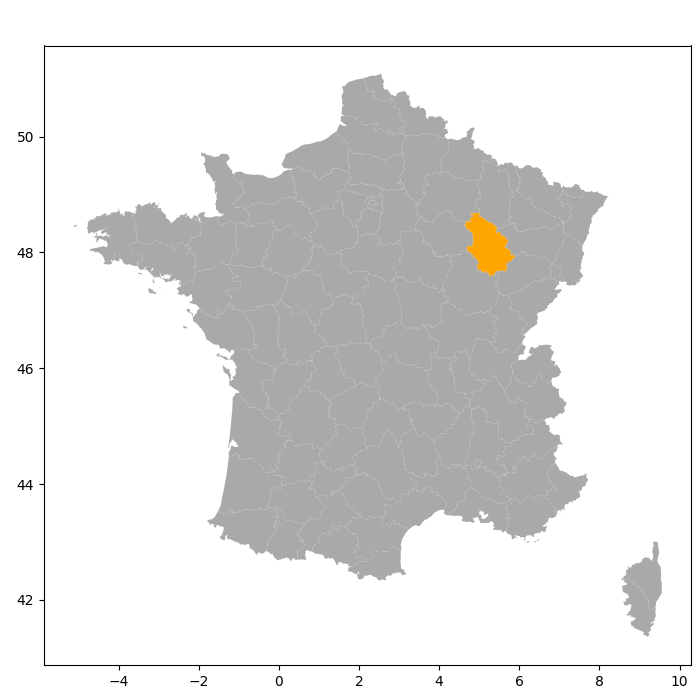
Plot with GeoPandas without additional parameters. The department Haute-Marne is highlighted for future reference. Image created by author.
If we want to manually set the bounds, we can do that by modifying the limits of the axes (see note [1]). To get the bounds from the GeoPandas GeoDataFrame, we use the total_bounds property to get a tuple containing minx, miny, maxx, maxy for the entire set of shapes.²
figure, ax = plt.subplots()
colors = ["orange" if nom == "Haute-Marne" else "darkgrey"
          for nom in gdf["nom"]]
gdf.plot(kind="geo",  # Explicitly defining kind of plot
         color=colors,
         ax=ax)
xmin, ymin, xmax, ymax = gdf.loc[gdf["nom"] == "Haute-Marne"].total_bounds
ax.set_xlim(xmin, xmax)
ax.set_ylim(ymin, ymax)
figure.suptitle("Geopandas: center and zoom")
This will give the plot below.
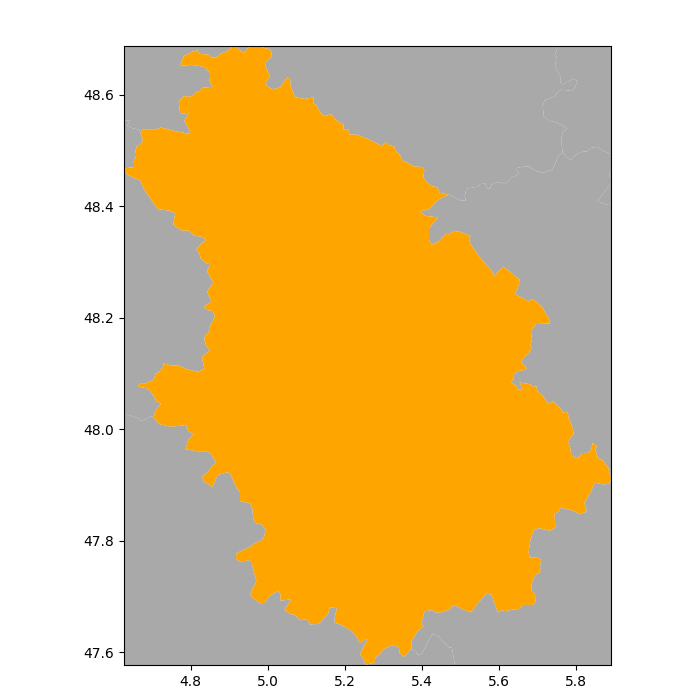
Plot with GeoPandas fit to the bounds of the department. The department Haute-Marne is highlighted for future reference. Image created by author.
In GeoPandas or Matplotlib, there are no options to move the center of the map or zoom other than setting the limits on the axes or shifting the data (see for example [3]).
Plotly
Plotly has two types of maps: Mapbox (or tile-based) maps and Geo (or outline-based) maps⁴’⁵.
Mapbox maps
Maps, such as made with px.scatter_map, px.line_map, px.choropleth_map, and px.density_map, all support two options i.e.: zooming and centering the map, and fitting it to the bounds. The first can be done directly while creating the figure⁶ or by updating the layout⁷’⁸.
px.density_map(lat=[], lon=[],
               zoom=5,
               center={"lat": 46.55811141091715,
                       "lon": 2.549687309671112})

# or

fig = px.density_map(lat=[], lon=[])
fig.update_layout({"map": {"center": {"lat": 46.55811141091715,
                                      "lon": 2.549687309671112},
                           "zoom": 5
                           }
                   })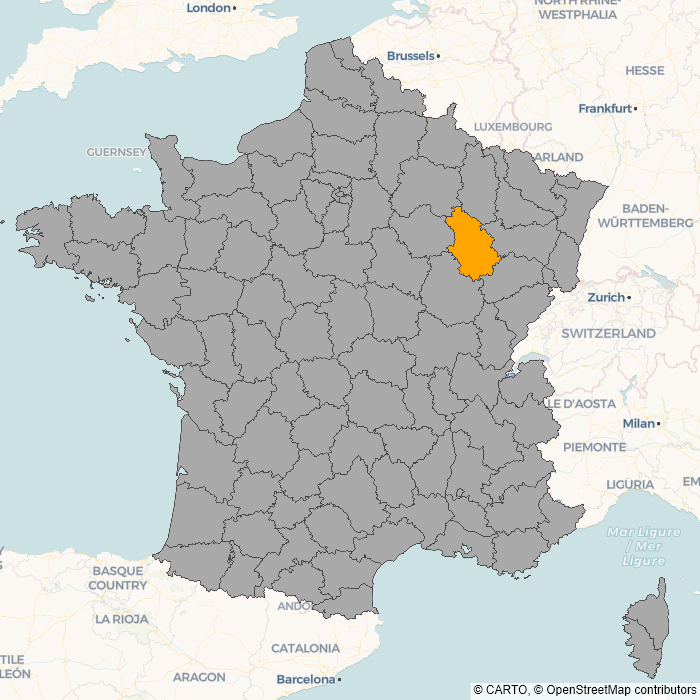
Plotly Mapbox-type map centered and zoom to fit. Image created by author.
Fitting to the bounds is done like this⁷’⁸ and will result in a figure as shown below.
fig = ...
fig.update_layout({"map": {"bounds":
                           {"west": xmin,
                            "east": xmax,
                            "south": ymin,
                            "north": ymax}
                           }
                   })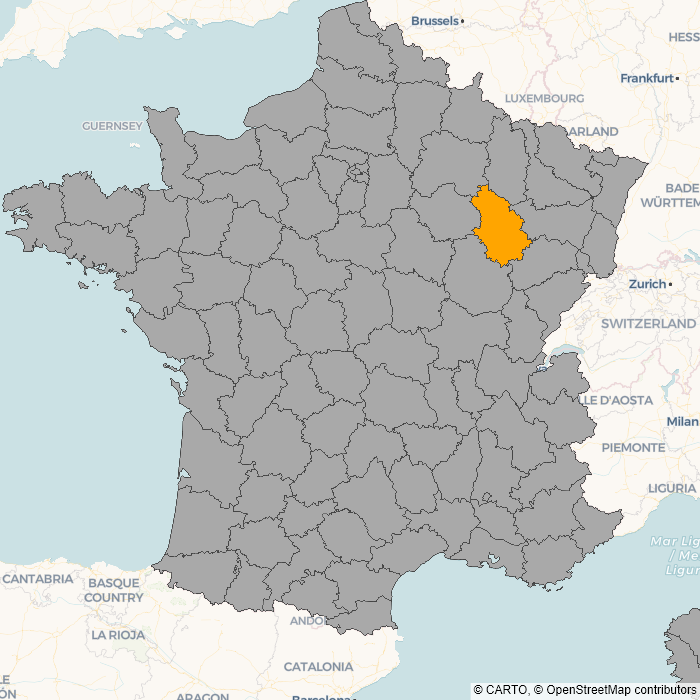
Plotly Mapbox-type map fitted to bounds. Image created by author.
Geo maps
Maps, such as made with px.choropleth, px.scatter_geo , or px.line_geo, all support the option of fitbounds. This can be done directly while creating the figure⁹ or by updating the layout⁷’¹⁰. The possibilities are to fit the bounds of the "geojson" or the bounds of the "locations". Fitting to "geojson" is shown first.
fig = px.choropleth(
        data_frame=gdf,  # locations
        geojson=data,  # geojson
        featureidkey="properties.nom",
        locations="nom",
        color="nom",
        color_discrete_map=colormap,
        projection="mercator")
fitbounds="geojson")
# or
fig = px.choropleth()
fig.update_geos(fitbounds="geojson")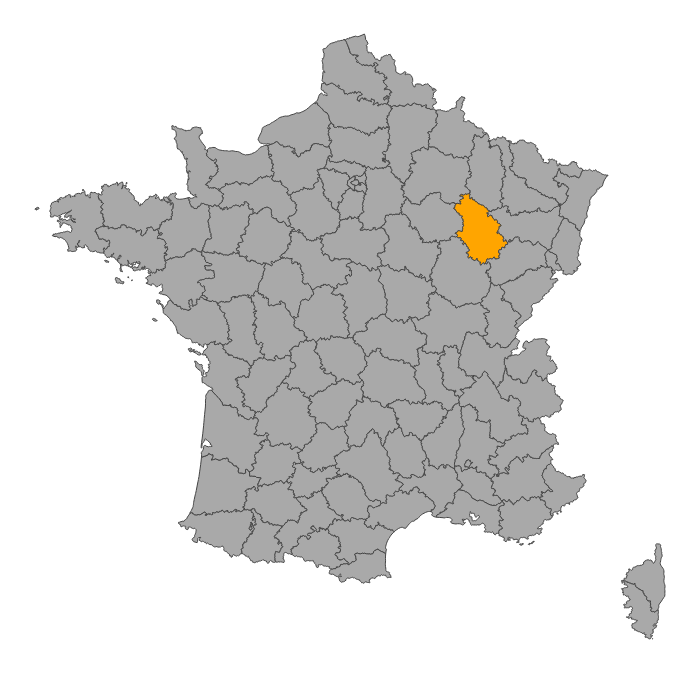
Plotly Geo-type map fit to the extent of the geojson. Image created by author.
The other option is fitting to the extent of the area of interest being the locations. In the map below, the location is the one department.
fig = px.choropleth(fitbounds="locations")
# or
fig = px.choropleth()
fig.update_geos(fitbounds="locations")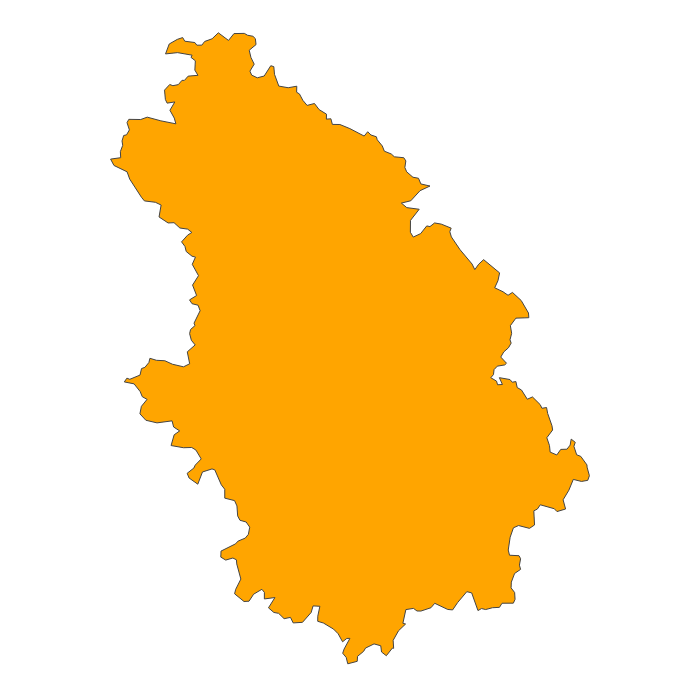
Plotly Geo-type map fit to the extent of the locations. Image created by author.
Folium
Folium maps support two approaches. The first is center and zoom, which can be done when creating the map.¹¹
map_: folium.Map = folium.Map(location=center, zoom_start=zoom)
folium.GeoJson("filepath_of_geojson").add_to(map_)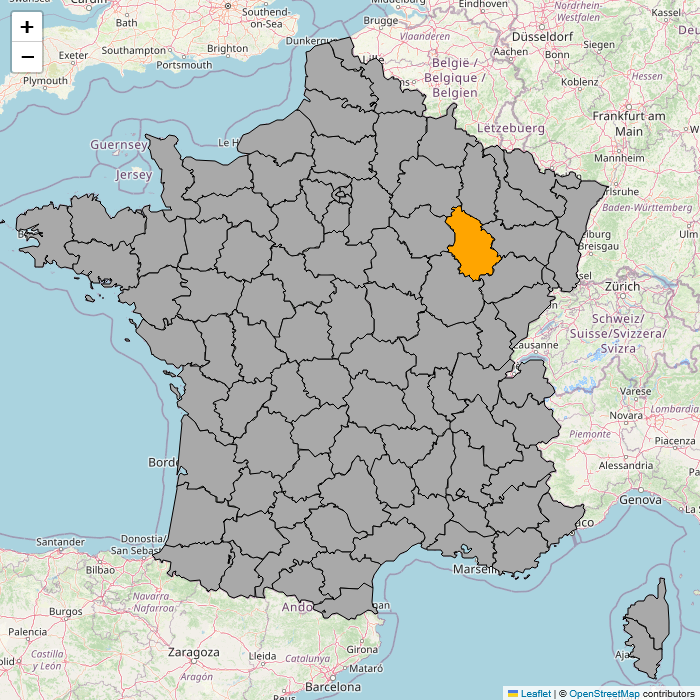
Folium map centered and zoomed to fit. Image created by author.
The second is fit to bounds by using fit_bounds¹¹ method on the map object.
map_: folium.Map = folium.Map()
folium.GeoJson("filepath_of_geojson").add_to(map_)
map_.fit_bounds([[ymin, xmin], [ymax, xmax]])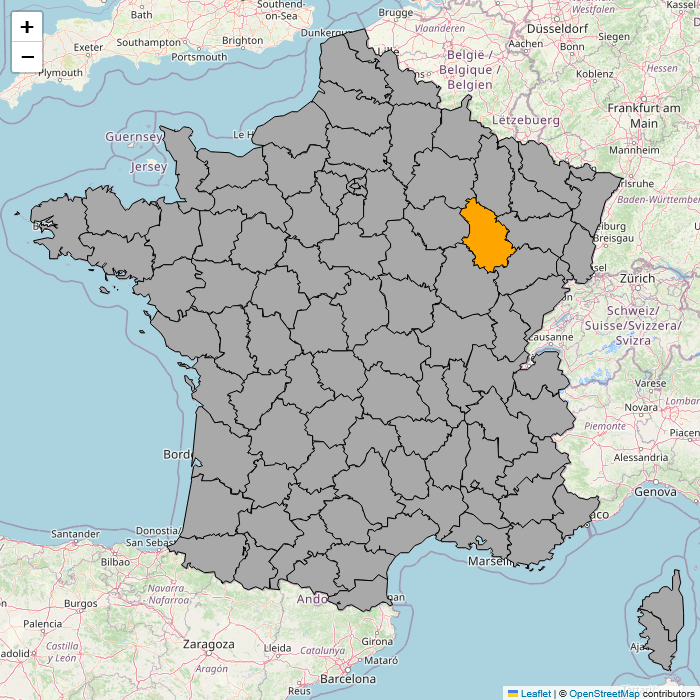
Folium map fitted to the bounds. Image created by author.
All the code used to create these plots can be found here.
Part 2: How the determine the center, the zoom level and the bounds?
Next, how do we get the center, the zoom level, and the bounds. If we do not want to iteratively test or guess values, luckily, there are methods to derive them from the data we want to plot.
The center of a set of geographical points
There are three ways to determine the center: the centroid, the mean, and the median.
Getting the centroid
The centroid is the center point of the object.
The shapely library has a centroid function¹² that computes the geometric center of geometry. To use this, create a shapely object and apply the function to it. The final step is to ensure that the keys are in the same as they are inputted as arguments in Plotly , where the center parameter takes a dictionary with keys ‘lat’ and ‘lon’⁶, and in Folium where the location parameter takes a tuple or list of latitude and longitude¹¹.
polygon: shapely.GeometryCollection = shapely.from_geojson(bytes_object)
centroid: shapely.Point = shapely.centroid(polygon)
center: dict = dict(zip(["lat", "lon"], list(*centroid.coords)[::-1]))
Getting the mean
The mean, or the arithmetic mean, of a list of numbers is the sum of the entire list divided by the number of items in the list.¹³
To determine the mean of both the latitudes and the longitudes, first, we use the map_coords¹⁴ iterator to apply a function to all coordinates. In this case, we add them all to a list. Next, we separate the list with all the odd places going to a list of latitudes and the even places to a list of longitudes. This is the order in which they are stored in the GeoJSON: lon, lat, lon, lat… Finally, we use np.mean¹⁵ to get the mean values and create a dictionary with it.
coordinates = []

# Load GeoJSON data and map coordinates
with open(geojson_file) as file:
    geojson.utils.map_coords(lambda coord: coordinates.append(coord),
                             geojson.load(file))

# Separate latitude and longitude
latitudes = coordinates[1::2]
longitudes = coordinates[::2]

median = {"lat": np.mean(latitudes), "lon": np.mean(longitudes)}
Getting the median
The Median is the number found at the exact middle of the set of values.¹³
To get a dictionary with the medians, the start is similar to the example above. Now, we end with using np.median¹⁶ to get the mean values and create a dictionary with it.
median = {"lat": np.median(latitudes), "lon": np.median(longitudes)}When we plot these three methods of determining a center, we can see that they are close to each other but not in the same location.
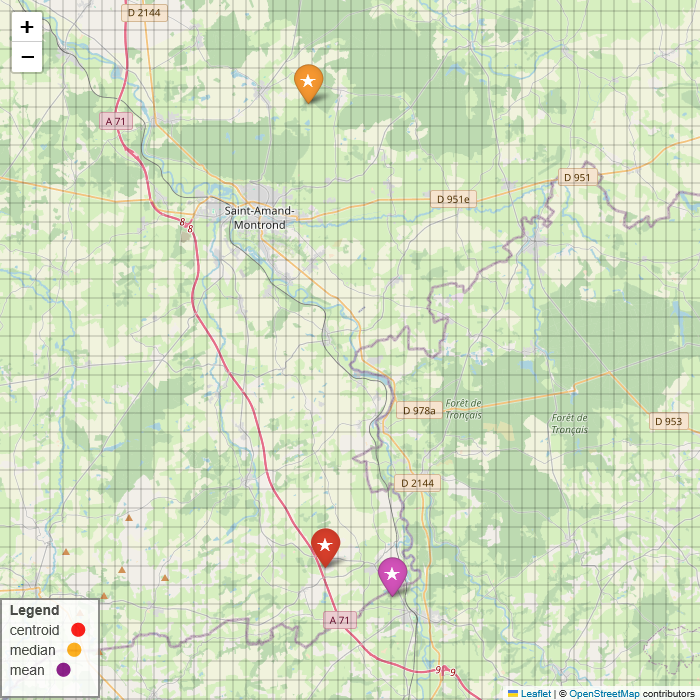
Folium Map displaying the three determined centers of the GeoJSON. The grid lines are roughly one kilometer apart. Image created by author.
Determining the zoom level
Next, to a center point for the map, we need a zoom level. For GeoPandas, this is not needed as it does not use one. For Plotly and Folium, both are created by mapping the size or area of the map content to the scale of zoom levels. The zoom scales are both logarithmic¹⁷. To get the estimated value, I have used np.interp¹⁸’¹⁹ to map the area to the zoom scale.
Plotly
For Plotly maps, the zoom scale ranges from 0 to 20⁶. The method shown below first calculates the area based on the difference in degrees of longitude and latitude. It is derived from a solution on Stack Overflow²⁰. I have iteratively changed the area sizes to include the entire zoom range for this map extent and latitude. The final call uses the interpolation to get an appropriate zoom level for the area size, which is in turn rounded to an integer.
xmin, ymin, xmax, ymax = bounds
area: float = (xmax - xmin) * (ymax - ymin)
area_sizes = [0, 5*10**-7, 5*10**-5, 1.5*10**-2, 150, (180 * 360)]
zoom_level = [20, 17.5, 14, 10, 5, 0]
zoom = int(np.interp(area, xp=area_sizes, fp=zoom_level))
An alternative solution for Plotly found on the Stack Overflow page uses a logarithmic scale²⁰.
Folium
The zoom levels in Folium work in a similar way. The scale range between 0 and value depending on the chosen tile provider.¹¹’²¹ Just like for the Plotly zoom levels, I’ve iteratively found a mapping that works for Folium.
xmin, ymin, xmax, ymax = bounds
area: float = (xmax - xmin) * (ymax - ymin)
area_sizes = [0, 10**-5, 10**-4, 10**-2, 150, (180 * 360)]
zoom_level = [20, 17, 14, 12, 6, 0]
zoom = int(np.interp(area, xp=area_sizes, fp=zoom_level))
Getting the bounds
Option 1
To get the bounds of the locations in a GeoJSON, one method is to use the same lists of longitudes and latitudes we made for determining mean and median. From these lists, we create a list with the minimal and maximal values of both longitudes and latitudes.
bounds: list = [min(longitudes), min(latitudes), max(longitudes), max(latitudes)]Option 2
Secondly, when we are working with GeoPandas we can use the total_bounds property² as mentioned before.
bounds = gdf.total_boundsThe code for these function can be found here.
Part 3: Bonus code examples
Adding a GeoJSON layer to Plotly Maps
To add a layer based on a GeoJSON to a Plotly Mapbox map, you can add it as a layer. The minimal working example is shown below. Map layers are provided as a dictionary to the list of layers which in turn are added to the figure using the update_layout method. The minimal needed keywords are type, and source, although when provided a GeoJSON only source is needed as type defaults to “geojson”.⁷
figure.update_layout(
    map_layers=[{"below": "traces",
                 "type": "fill",
                 "color": color,
                 "source": json.load(open("filepath_of_geojson"))}])
Adding a GeoJSON layer to Folium Maps
The GeoJson class is a method to add a GeoJSON layer to a Folium map²². The styling of the layer is provided to the style_function argument by a lambda function.²² Additional keyword-value combinations that can be used are found in the Leaflet documentation.²³
folium.GeoJson("filepath_of_geojson",
               style_function=folium_style_function()).add_to(map_)
#
def folium_style_function():
    return lambda feature: {"fillColor": ORANGE_COLOR,
                            "fillOpacity": 1,
                            "color": "black",
                            "weight": 1}
Adding a legend to a Folium map
To add a legend to a Folium map are multiple options, some of them are described by Geeks for Geeks²⁴. I’ve chosen to adapt method two because I didn’t want to use another library. In my version, shown below, the elements for the legend are added by iterating over the GeoDataFrame containing the points.
centers : gpd.GeoDataFrame = ...
colors: dict = ...
legend_html: str = (
'<div style="position: fixed;'
'\n\tbottom: 70px; left: 0px; width: 100px; height: 100px;'
'\n\tborder:2px solid grey; z-index:9999; font-size:14px;'
'\n\tbackground-color:white; opacity: 0.85;">'
'\n\t <b>Legend</b> <br>'
)
map_: folium.Map = folium.Map()
for _, row in centers.iterrows():
legend_html += (
f'\n\t {row["name"]} <i class="fa fa-circle" '
f'style="color:{colors[row["name"]]}"></i><br>'
)
legend_html += "\n</div>"
map_.get_root().html.add_child(folium.Element(legend_html))Adding grid lines to a Folium map
To make the geographical distance between the three center points more clear I added grid line. Based on this Stack Overflow answer²⁵, I created this function.
def add_gridline(
    start: float,
    end: float,
    is_horizontal: bool
        ) -> None:
    INTERVAL = 1 / 111  # 1 km to degrees, gives ~0.009
    for value in np.arange(start, end + 1, INTERVAL):
        coords: typing.List[typing.List[typing.Union[int, float]]] = (
            [[value, -180], [value, 180]] if is_horizontal
            else [[-90, value], [90, value]]
        )
        folium.PolyLine(coords,
                        **{"color": "black",
                           "weight": 0.5,
                           "opacity": 0.5}
                        ).add_to(map_)
To conclude
With the options I’ve shown, your first attempt of making a fitting map can be closer to what you would want when trying to fit everything in the plot. My takeaways from researching and writing this are:
- Fitting a map to the bounds of your data is the quick and dirty option, however you might want to add a little padding to create some space on the map;
- Determining which center point works best is an iterative process;
- Creating a function to determine the zoom scale is either a lot of hand work test all the cases to come up with good enough results or it requires a lot of knowledge of projections and logarithmic scales to have working solution;
- Although al three libraries have options for either zooming or fitting the maps, these are not always that easy to find or well-documented.
- However, in the end, it has been a nice learning experience to come to this insight.
This story is my way to share my coding experience and the lessons I learned, and to document my solutions. All claps, comments, and highlights are appreciated, as well as sharing the story. For more code and my other links see: https://github.com/UnicornOnAzur/.
[1] https://stackoverflow.com/questions/58014498/how-to-restrict-a-geopandas-plot-by-coordinates
[2] https://geopandas.org/en/stable/docs/reference/api/geopandas.GeoSeries.total_bounds.html
[3] https://stackoverflow.com/questions/58750837/set-centre-of-geopandas-map
[4] https://plotly.net/geo-map-charts/geo-vs-mapbox.html
[5] https://plotly.com/python/map-configuration/
[6] https://plotly.com/python-api-reference/generated/plotly.express.scatter_map.html; https://plotly.github.io/plotly.py-docs/generated/plotly.express.line_map.html; https://plotly.github.io/plotly.py-docs/generated/plotly.express.choropleth_map.html; https://plotly.github.io/plotly.py-docs/generated/plotly.express.density_map.html
[7] https://plotly.com/python/reference/layout/
[8] https://plotly.com/python/reference/layout/mapbox/
[9] https://plotly.com/python-api-reference/generated/plotly.express.scatter_geo.html; https://plotly.github.io/plotly.py-docs/generated/plotly.express.line_geo.html; https://plotly.github.io/plotly.py-docs/generated/plotly.express.choropleth.html
[10] https://plotly.com/python/reference/layout/geo/
[11] https://python-visualization.github.io/folium/latest/reference.html
[12] https://shapely.readthedocs.io/en/stable/reference/shapely.centroid.html
[13] https://www.diffen.com/difference/Mean_vs_Median
[14] https://pypi.org/project/geojson/#map-coords
[15] https://numpy.org/doc/stable/reference/generated/numpy.mean.html
[16] https://numpy.org/doc/stable/reference/generated/numpy.median.html
[17] https://docs.mapbox.com/help/glossary/zoom-level/
[18] https://numpy.org/doc/stable/reference/generated/numpy.interp.html
[19] https://www.geeksforgeeks.org/numpy-interp-function-python/
[20] https://stackoverflow.com/questions/63787612/plotly-automatic-zooming-for-mapbox-maps
[21] https://xyzservices.readthedocs.io/en/latest/api.html#xyzservices.TileProvider
[22] https://python-visualization.github.io/folium/latest/user_guide/geojson/geojson.html
[23] https://leafletjs.com/reference.html#path
[24] https://www.geeksforgeeks.org/create-a-legend-on-a-folium-map-a-comprehensive-guide/
[25] https://stackoverflow.com/questions/78112526/adding-1km-grids-to-folium-map
메타데이터
- post_id
- 3fe3fd9c0d54
- slug
- how-to-center-and-zoom-to-your-geojson-in-geopandas-plotly-and-folium-3fe3fd9c0d54
- url
- https://medium.com/pythoneers/how-to-center-and-zoom-to-your-geojson-in-geopandas-plotly-and-folium-3fe3fd9c0d54
- canonical_url
- https://medium.com/pythoneers/how-to-center-and-zoom-to-your-geojson-in-geopandas-plotly-and-folium-3fe3fd9c0d54
- author_url
- https://medium.com/@unicornonazur
- status
- ok
- fetched_at
- 2026-06-21 19:25:17