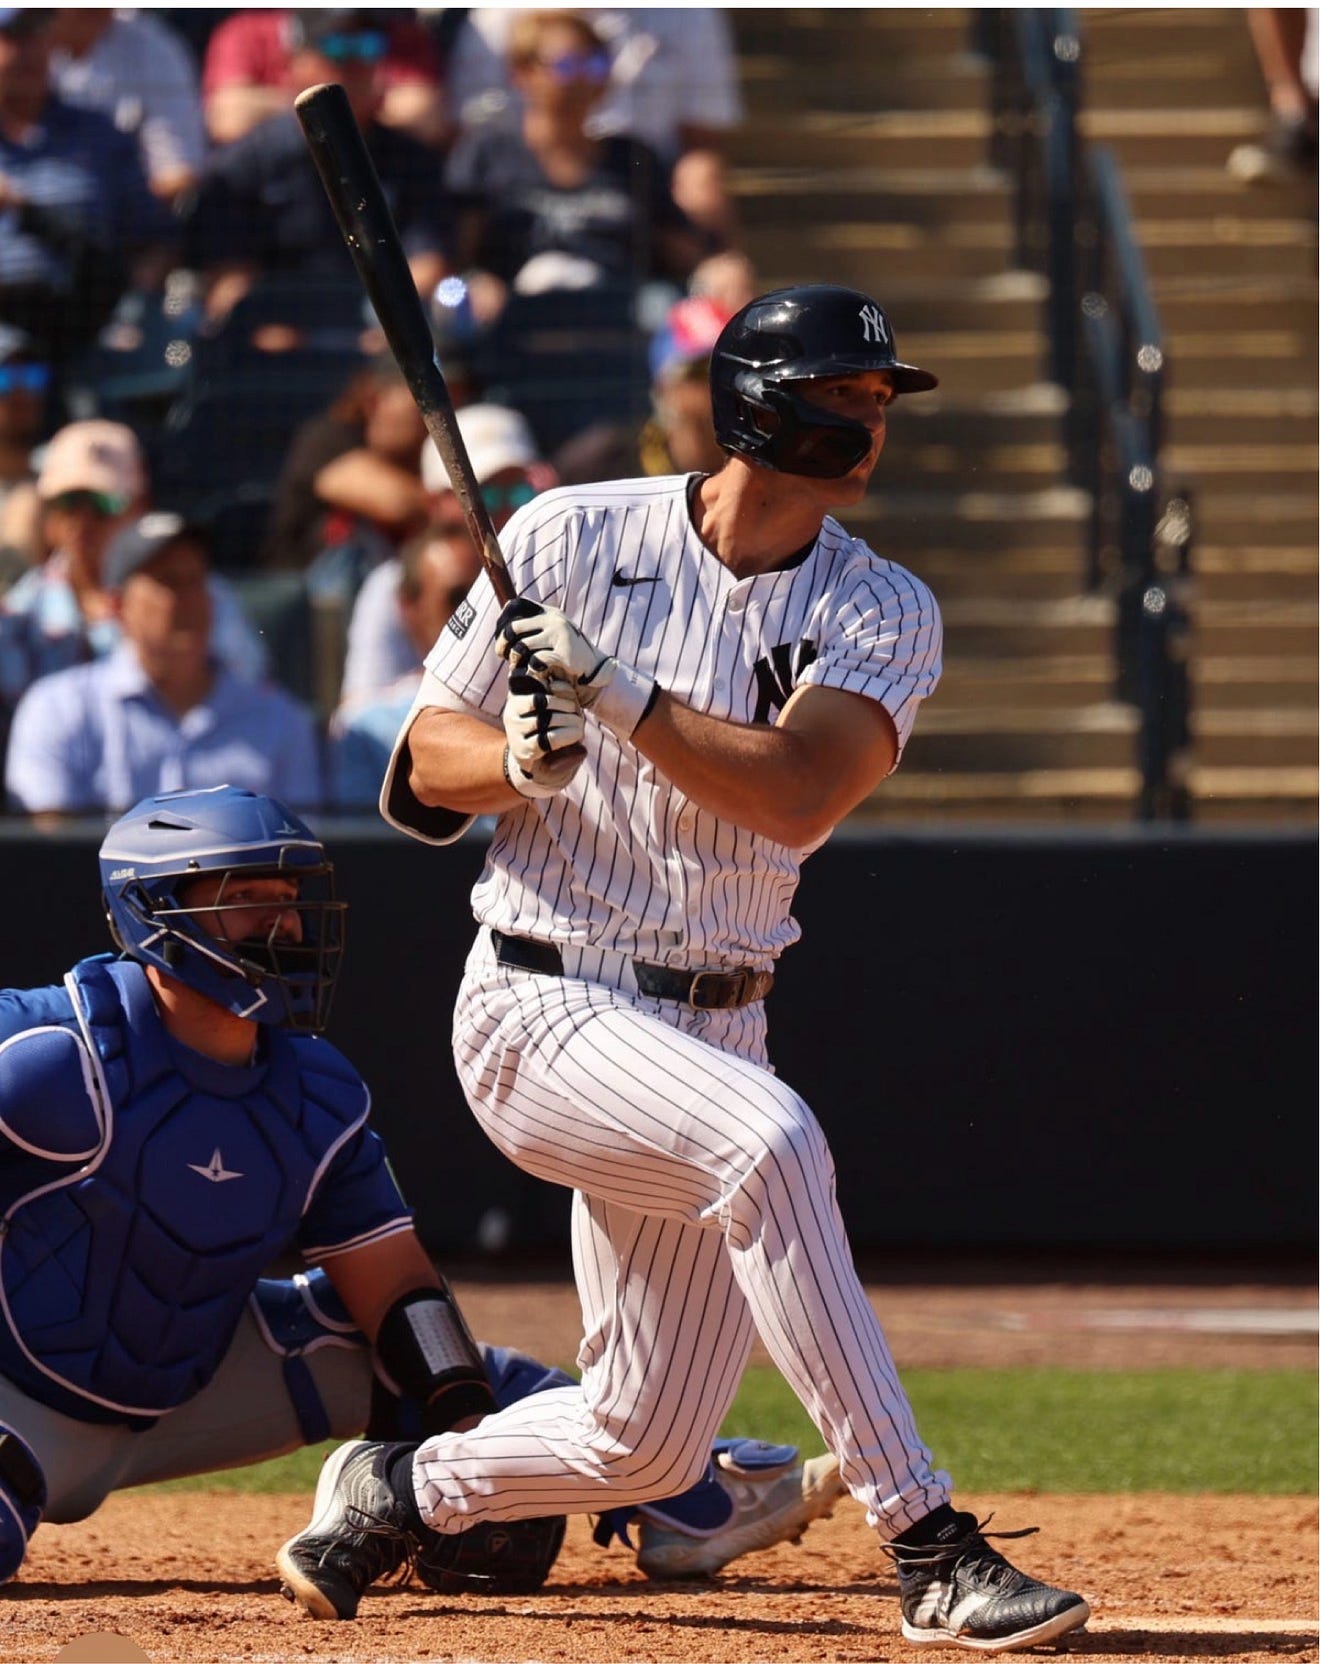
2026 NCAA Division 1 Baseball advanced metric leaderboards
Who to watch for in the College World Series and the MLB draft
2026 NCAA Division 1 Baseball advanced metric leaderboards
Who to watch for in the College World Series and the MLB draft
The regular season is over, and the dust has settled after an exciting 64-team Regionals saw top-ranked UCLA and Georgia Tech ousted, not a single squad from the 2025 CWS advance, and two #4 seeds (St. John’s and Little Rock) sweep. The sweet-16 Super-Regionals begin today. Seems like as good a time as any to publish some annual player leaderboards.
In this article, I combine raw Trackman and Synergy data products, using approaches I have described in other publications. I will not go into details about my assumptions or methods here, but I will link to the SABR Tooth Tiger articles that do. My goal is to provide a fresh look at the readily available data using the metrics I find most powerful (and not readily available), not to present an exhaustive set of traditional statistics or a new draft board.
I measure a player’s general offensive skill using **xJOPS+ *(Figure 1). The ‘x’ means it is an expected statistic, generated by using {Exit Velocity, Launch Angle, Spray Direction} triplets to simulate 1000 seasons for every hitter in an attempt to zero-out park effects and luck. JOPS=3.28OBP + SLG is a weighted form of OPS designed to be the best simple predictor of runs scored per game (where getting on base is more important in D1 Baseball than in MLB). And the ‘+’ means that the metric has been scaled and recentered so that 100 is league average, and 120 means 20% better than league average.

Figure 1. Each hitter’s expected (x) line is built by re-simulating every batted ball in play (BIP) from 2026 with the HitOrNot model: the {exit velocity, launch angle, spray direction} triplet from Trackman is compared to a grid of empirical outcome probabilities (P), yielding per-BIP P(Out/1B/2B/3B/HR) that aggregate into xOBP and xSLG. These metrics are combined into JOPS = a·OBP + SLG, where the weight ‘a’ (3.28 for D1) is fit on pooled 2024–26 team-season runs/game — ‘a’ is the OBP vs SLG run-value ratio implied by scoring, so it up-weights on-base relative to the equal-weight xOPS+ more appropriate for predicting MLB success. All variants are normalized to 100 = D1 league mean (a ‘+’ metric, higher is better). The x/t/c prefixes are the same statistic computed three ways: x = HitOrNot simulation, t = Trackman actual counts, c = Synergy actual counts; gaps between the simulated and counted lines flag a hitter’s batted-ball fortune — A batter like the Gators’ Brendan Lawson has a higher xJOPS+ than tJOPS+, suggesting he got fairly unlucky, and with another few hundred plate appearances, might significantly improve his actual JOPS+ (which is a scary thought!). Error bars are combined ±1σ Monte-Carlo simulation noise, uncertainty in the fitted ‘a’, and league-mean sampling noise. (BB+HBP)/K is a proxy for plate discipline (high is better). Hitters qualify at tPA ≥ 150 (Trackman plate appearances).
In addition to xJOPS+, I assess swing quality with a few contact- and power-specific metrics. In-Zone-Contact-Rate (IZCR) measures how often you hit the ball when you swing at pitches in the 95%-called-strike-zone, and is a check-engine-light for your swing mechanics (Figure 2).

Figure 2. IZCR (in-zone contact rate) — contact per non-check swing on pitches inside the D1 strike-plus-shadow zone. I show both raw and shrunk versions of the statistic. ‘Shrunk’ means that I use a beta-binomial empirical-Bayes approach to pull individuals toward the league mean at a rate inversely proportional to the amount of data we have for that player (posterior weight ‘n/(n+κ)’) — so low-sample hitters are pulled toward average rather than topping the board on noise. All of these top-50 contact hitters are pulled toward lower IZCR values closer to the league mean (see inset box-and-whisker plot) because no D1 hitters have enough plate appearances to stabilize this statistic.
Mean-Swing-Quality (MSQ; Figure 3) and inferred Bat Speed (iBS; Figure 4) are new metrics that I have not published on yet (coming soon). With a little sleight of hand, I use MLB Statcast data (where bat speed is available) to calibrate a model that can predict a player’s 95th percentile bat speed (iBS) and their barrel accuracy (MSQ) based on the joint distribution of their exit velocities, launch angles, and contact locations.

Figure 3. MSQ (mean swing quality) is per-swing quality on a 0–1 scale derived from pitch-speed-adjusted exit velocity and launch angle relative to the hitter’s own shrunk 95th-percentile exit velocity. MSQ_IZ only considers swings on pitches in the D1 strike-plus-shadow zone. Think of MSQ_IZ as a proxy for barrel accuracy — when you swing, regardless of what bat speed you have, do you barrel the ball (i.e., hit the ball the maximum possible exit velocity).

Figure 4. iBS (inferred bat speed) represents a player’s 95th percentile bat speed (i.e., their hardest swings). In college baseball, there is only one equation (relating pitch speed, exit velocity, bat speed, and the material properties of the bat), but there are two unknowns (1. bat speed, which is not measured by trackman; and 2. the material properties of the bat, which vary with manufacturing inconsistency, temperature, rolling, and shaving). However, if a D1 player has enough BIP over the course of a season, mostly with the same bat, I can study the distributions of pitch_speed+exit_velocity, and build an MLB-calibrated model that infers 95th percentile bat speed. Think of iBS as my best estimate of how hard you swing in game situations.
I like to think of IZCR (do you hit the ball), MSQ (do you barrel the ball), and iBS (do you have the potential to hit the ball with great force) as the three primary ingredients for evaluating a player’s hit tool. I summarize swing quality in Figure 5, which simultaneously depicts contact metrics IZCR and MSQ, and power metrics iBS and expected bases on in-zone pitches resulting in balls in play (xBIZ).

Figure 5. The two axes (IZCR, xBIZ) are an orthogonal contact-vs-power skill pair. The filled color field is a thin-plate-spline surface fit of xJOPS+ (simulated production; Figure 1) over the pooled (IZCR, xBIZ) cloud and masked to the data’s convex hull, so position on the plane reads directly as xJOPS+ value. The standardized linear fit in the title decomposes that surface: a +1σ move in xBIZ lifts xJOPS+ by ~1.9× as much as a +1σ move in IZCR (1σ means one-standard-deviation) — power-on-contact bends the value surface faster than contact frequency at this level (although not as fast as it does in MLB, where power has even more value). Dashed lines are MSQ (Figure 3) contours and dotted lines are iBS (Figure 4) contours. Here is how to read the Pareto frontier: imagine moving left to right, increasing IZCR as you go. At most locations on the graph, there are players with both higher IZCR and xBIZ than you. However, when you reach the Pareto frontier, further increasing IZCR will only decrease your xBIZ. In other words, the frontier represents the location on the graph where trade-offs are enforced, and a player can no longer improve both contact and power. Use this graph to understand a player’s fastest route to improved production (xJOPS+) by working on some combination of their IZCR, MSQ, xBIZ, and iBS.
Lastly, I evaluate offensive production in leverage situations (Figure 6). Modified Run Expectancy (mRE24) measures how many runs above average your plate appearances were worth, given their base-out states. Win Probability Added (WPA) measures how many wins above average your plate appearances were worth, given their base-out-inning-score states. Both mRE24 and WPA have large uncertainties, but I have increased the size of the training dataset and improved reliability since my July 2025 article.

Figure 6. mRE24 is the change in run expectancy across each plate appearance, scored on an empirical 24-state base-out run-expectancy matrix and summed to runs above average. Think of mRE24 as the situational-value of a PA: a homer with the bases loaded is worth more than a solo shot. WPA is the change in win expectancy across each plate appearance, scored on an empirical win-probability matrix (base-out, inning, run-differential), summed to wins above average. WPA looks at the same events as mRE24, but weighs them by how much each PA actually swung the game, so late-and-close production dominates. Both mRE24 and WPA are measures of clutch performance: I can measure mRE24 more accurately, while WPA is a noisier but more sensitive leverage indicator. Mercer’s Chris Katz wins clutch performer of the year by this analysis.
I can also report a few coarse fielding and baserunning metrics. Outs Above Average (OAA) uses Gayan’s catch probability model to rank outfielders (Figure 7). Unfortunately, there are not enough data to reliably measure outfielder arms (but shout-out to Princeton’s RF Jake Koonin with 17 outfield assists in just 42 games!).

Figure 7. OAA (outs above average) credits each outfield play with ‘actual − expected’, where ‘actual’ ∈ {0,1} is whether the ball was caught and ‘expected’ is the modeled catch probability for that play. The catch-probability model depends on run direction/distance/speed and wall-distance, and is well-calibrated (expected calibration error ≈ 0.004, near-zero centering bias). One update from the original Gayan OAA model is that now I attribute catches to the fielder Synergy’s scorer names on the play, not the geometrically closest outfielder, which fixes mis-credited poaches. I report OAA / 100 opportunities so that players can be compared. Sam Houston State has 3 of the top 15 outfielders!
For catchers, I can measure conference-aware Catcher Framing (cgCF+) to evaluate receiving receiving (Figure 8), and I can rank arms by estimating steal-suppression (rSB) and pickoff runs above average (Figure 9).

Figure 8. cgCF+ (conference-group aware catcher framing, ‘+’) allows for the fact that umpire strike zones differ systematically by conference. For example, SEC catchers are not penalized compared to an Ivy League catcher just because the SEC strike zone is smaller. cgCF+ averages two components: 3Zr+ is a three-concentric-zone polygon rule (credit a stolen strike on a ball, debit a lost strike in the zone, score shadow-zone pitches against the conference baseline); IWr+ is an influence-weighted version using a smoothed called-strike-probability surface so that borderline takes count in proportion to how surprising the call was. σ is a 1000-iteration within-catcher bootstrap (each catcher resamples his own pitches). For the second year in a row, Arkansas’ Ryder Helfrick is among the top framers.

Figure 9. Catcher run prevention on the bases is stacked from two sources: rSB (steal-suppression runs) measures the caught-stealing credit above the league baseline advance value, minus the run cost of steals allowed. rSB is not a particularly reliable statistic, because steals are as much attributable to the pitcher as they are to the catcher. I add an even less certain extension for pickoffs in which the catcher participated. Bethune-Cookman’s Maikol Lucena is the class of D1, while Columbia’s Owen Estabrook is a strong representative from the Ivy League.
Lastly for position players, I measure base running runs above average (BsR; Figure 10).

Figure 10. BsR is runs added on the bases above average, from an advancement model that predicts the probability of each end-base given the context (start base, batter’s outcome, outs, hit location), and then values the runner’s ‘actual’ advance against that expectation. BsR includes inter-PA events (steals, caught-stealing, pickoffs) priced as base-out transitions, so it captures the whole baserunning game, not just first-to-third on singles.
I have to admit, I ran out of steam for pitchers (at least for this article). I do measure their general run prevention ability using Total Bases Per Innings Pitched (xTBIP-; Figures 11&12). The ‘x’ means it is an expected statistic, generated by using {Exit Velocity, Launch Angle, Spray Direction} triplets to simulate 1000 seasons for every pitcher in an attempt to zero-out park effects and luck. TBIP = BB + HBP + 1B + 22B + 33B + 4*HR is the best simple predictor of runs scored against per game. And the ‘-’ means that the metric has been scaled and recentered so that 100 is league average, and 80 means 20% better than league average.

Figure 11. TBIP (total bases allowed per inning pitched) = (BB + HBP + TB) / IP measures the damage-per-inning rate that best predicts runs allowed in D1 baseball. The expected ‘x’ version re-simulates every batted ball the pitcher allowed through HitOrNot (Trackman {EV, LA, SD}), stripping out defense and luck. The ‘t’ and ‘c’ markers are the same TBIP from Trackman and Synergy actual counts. All metrics are normalized to 100 = D1 league mean and shown as a ‘−’ metric, so the best arms sit at the bottom and the dashed line marks league-average damage. Error bars are ±1σ combining Monte-Carlo BIP simulations and league-mean uncertainty. Last year I ranked Oregon State’s Dax Whitney’s slider as the best swing-and-miss pitch in D1, and this year he is at the top of the xTBIP- leaderboard with neutral luck. Note: Pitchers with tTBIP- higher than xTBIP- suffered from bad luck (they allowed more baserunners than their BIP {EV, LA, SD} suggest they should have).

Figure 12. Please see the caption to Figure 11.
I also report mRE24 and WPA for pitchers (Figure 13).

Figure 13. mRE24 is the change in run expectancy across each batter faced (BF), scored on an empirical 24-state base-out run-expectancy matrix and summed to runs above average. Think of mRE24 as the situational-value of a BF: allowing a homer with the bases loaded is worse than allowing a solo shot. WPA is the change in win expectancy across each BF, scored on an empirical win-probability matrix (base-out, inning, run-differential), summed to wins above average. WPA looks at the same events as mRE24, but weighs them by how much each BF actually swung the game, so allowing baserunners in close games and late innings is particularly bad. Both mRE24 and WPA are measures of clutch performance: I can measure mRE24 more accurately, while WPA is a noisier but more sensitive leverage indicator. UC Santa Barbara’s Jackson Flora (an MLB draft board favorite) wins clutch pitcher of the year, no matter how you measure it. Yale’s Tate Evans is the class of the Ivy league, with his remarkable ability to eat innings in any situation.
I also use Stuff Or Not to see who threw some of the most effective pitches in 2026 (Figures 14–17). I am not a big fan of Stuff+ style measures of pitch nastiness, and prefer to focus on the relationship between pitch shape and outcome. Stuff or Not uses only four Trackman descriptors — release speed, horizontal break, induced vertical break, and approach angle — and creates an expected‑outcome grid using all Division‑I Trackman pitches (2023–2026) — Like Hit or Not, but for pitches! So for every quartet of Trackman observations, I measure the groundball rate, and the whiff rate in one or two strike counts. I define a pitcher’s distinct offerings (their arsenal) using TopoTagger, and summarize each pitch with its median shape. While Stuff or Not does not account for tunneling or other effects of pitch sequencing, you can see from the difference between expected and actual outcomes how well a specific pitch shape fits into a player’s arsenal (Figure 14).

Figure 14. (A) ranks the 15 best‑graded pitch-shapes thrown at least 25 times against the relevant matchup (in this case, same-side matchups resulting in batted balls in play). The open ring is the shape grade (Stuff or Not expected rate from pitch-shape) and sets the ranking. The area of the open ring is proportional to the pitcher’s zone percentage with that pitch (can they throw the pitch for a strike). The filled dot is this pitch’s actual groundball rate this season, with the thin line depicting the bootstrap interquartile range (2,000 resamples of that pitch’s real outcomes). A pitch with an open ring above the dot shows that the expected ground ball rate is higher than the actual ground ball rate, suggesting that this pitcher sequenced the pitch with the rest of their arsenal at a below average tunneling/confusion rate. High ground ball rate pitches in same side matchups are dominated by sinkers thrown from 3/4 or sidearm (SA) arm slots. (B) shows the expected‑outcome surface (horizontal vs. induced‑vertical break) sliced at the release speed of the #1‑ranked groundball pitch (green square), and drawn in that pitcher’s own handedness frame (from the pitcher’s perspective, looking in at the catcher). At velocities ~90 mph, ground ball rates plumet as fastballs sink and/or run less.

Figure 15. See the caption to Figure 14 for details. The best groundball pitches in opposite-side matchups tend to be splitters and changeups.

Figure 16. See the caption to Figure 14 for details. The best whiff pitches in same-side matchups tend to be sliders and sweepers, although a fourseam fastball with extreme ride (high IVB) and some cut (low HB) also performs well (B).

Figure 17. See the caption to Figure 14 for details. The best whiff pitches in opposite-side matchups tend to be slow curves (A), although a hard gyro (low HB and IVB) slider also can be effective (B).
I’ll leave it at that, and let you rank the top D1 players based on your favorite combination of metrics.
메타데이터
- post_id
- 407d35e4e61b
- slug
- 2026-ncaa-division-1-baseball-advanced-metric-leaderboards-407d35e4e61b
- url
- https://medium.com/sabr-tooth-tigers/2026-ncaa-division-1-baseball-advanced-metric-leaderboards-407d35e4e61b
- canonical_url
- https://medium.com/sabr-tooth-tigers/2026-ncaa-division-1-baseball-advanced-metric-leaderboards-407d35e4e61b
- author_url
- https://medium.com/@maloofa
- status
- ok
- fetched_at
- 2026-06-09 15:37:30