Stateful Order Fill Matching with Kafka Streams - Part 4: Horizontal Scaling, Partitions, and …
An experimental look at partition ownership, workload distribution, and horizontal scaling in Kafka Streams.
Stateful Order Fill Matching with Kafka Streams — Part 4: Horizontal Scaling, Partitions, and Ownership
Introduction
In the previous parts of this series, we focused primarily on correctness and state modeling: how to aggregate orders, support hierarchies, and handle time-related challenges.
Previous articles:
At this point, we can finally look at another important property of stream processing systems: horizontal scalability.
This is not simply a question of raw performance. The main challenge is how processing load behaves as the number of incoming events grows.
Traditional database-centric architectures often rely on a shared datastore where multiple processing nodes coordinate access to the same state. As throughput grows, this shared state can become a scalability bottleneck.
Stream processing systems approach this problem differently.
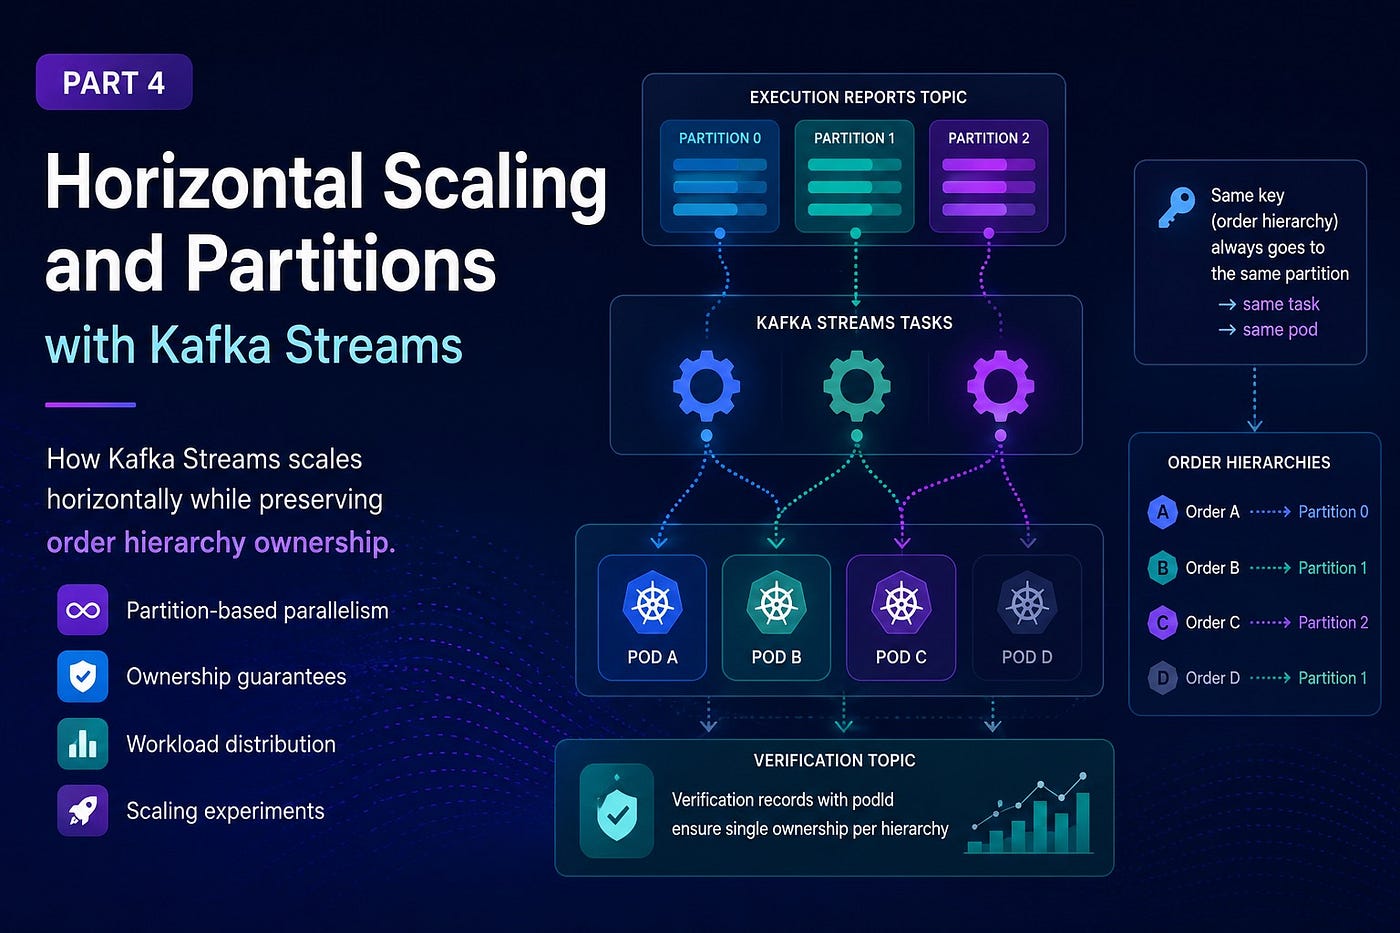
In our example, we use orderId — or more precisely parentOrderId, representing the entire order hierarchy — as the message key.
This design has an important consequence:
all events belonging to the same order hierarchy are routed to the same partition and therefore processed by the same Kafka Streams task.
At the same time, different order hierarchies can be processed independently and in parallel across multiple application instances.
As the number of orders grows, additional processing nodes can be introduced and Kafka partitions redistributed automatically, allowing the workload to scale horizontally without introducing cross-node coordination for individual order hierarchies.
In this chapter we will examine how Kafka Streams achieves this behavior and verify experimentally whether order hierarchies remain isolated when processing is distributed across multiple application instances.
The interesting question is not whether multiple instances process events in parallel – that is expected.
The real question is:
Can Kafka Streams scale horizontally while preserving ownership of stateful aggregates?
In this article we will examine how Kafka Streams achieves this behavior and verify experimentally whether order hierarchies remain isolated when processing is distributed across multiple application instances.
The test environment
To evaluate how workload is distributed across multiple Kafka Streams instances, we need an environment where the number of application nodes can be adjusted easily.
Kubernetes provides exactly this capability.
The test setup consists of:
- a single Kafka broker
- multiple order-state-processor instances
- an integration-test job generating test traffic
- a verification topic used to observe partition ownership
You will find the deployment configuration here, in the k8s folder.
The detailed test execution plan is available in the repository : Detailed test execution plan
For some scenarios we are going to change the number of partitions for the executions topic using command line just before installing our application.

Verifying Partition Ownership
Measuring throughput alone does not prove that order hierarchies are processed correctly.
We also need to verify that all events belonging to a given hierarchy are handled by a single application instance.
That’s why we are going to introduce a new verification topic where we will store the podId and timestamp:
public record VerificationRecord(
    String hierarchyKey,
    String podId,
    String processedAt
) {}
and write records to this topic in the separate stream:
processed each order key
            orderStates.toStream()
                    .mapValues((key, _) ->
                            new VerificationRecord(
                                    key,
                                    podId,
                                    Instant.now().toString()
                            ))
                    .to(verificationTopic, Produced.with(Serdes.String(), verificationRecordSerde));
This way we can track which messages using the same key are consumed by which pod instance.
After sending thousands of messages for multiple order hierarchies in our integration test we are going to pull the information from that topic and put the aggregated information here:
private record VerificationResult(
            int hierarchyKeys,
            Set<String> podIds,
            Map<String, Long> hierarchyCountByPod,
            long processingWindowMs
    ) {}
and make sure the single hierarchy key doesn’t contain more than one podId — for correctness.
Additionally we are going to measure throughput and some time metrics.
With the verification mechanism in place, we can now execute a series of scaling experiments and observe both correctness and workload distribution.
How Kafka Streams Achieves Parallelism
- Kafka Streams creates one task per partition.
- Tasks are distributed among application instances.
- Events with the same key always go to the same partition.
- Therefore events belonging to the same hierarchy are always processed by the same task.
This means that partition count determines the maximum available parallelism of the application.

Executing test scenarios
The detailed plan of executing test scenarios resides here in the repository: Detailed test execution plan
In general we are going to execute 6 scenarios:
- 3 partitions / 4 pods -> one idle (1 000 test Iterations)
- 3 partitions / 4 pods -> one idle (10 000 test Iterations)
- 6 partitions / 3 pods (10 000 test Iterations)
- 6 partitions / 6 pods (10 000 test Iterations)
- 6 partitions / 3 pods (100 000 test Iterations)
- 6 partitions / 6 pods (100 000 test Iterations)
Here are the results:
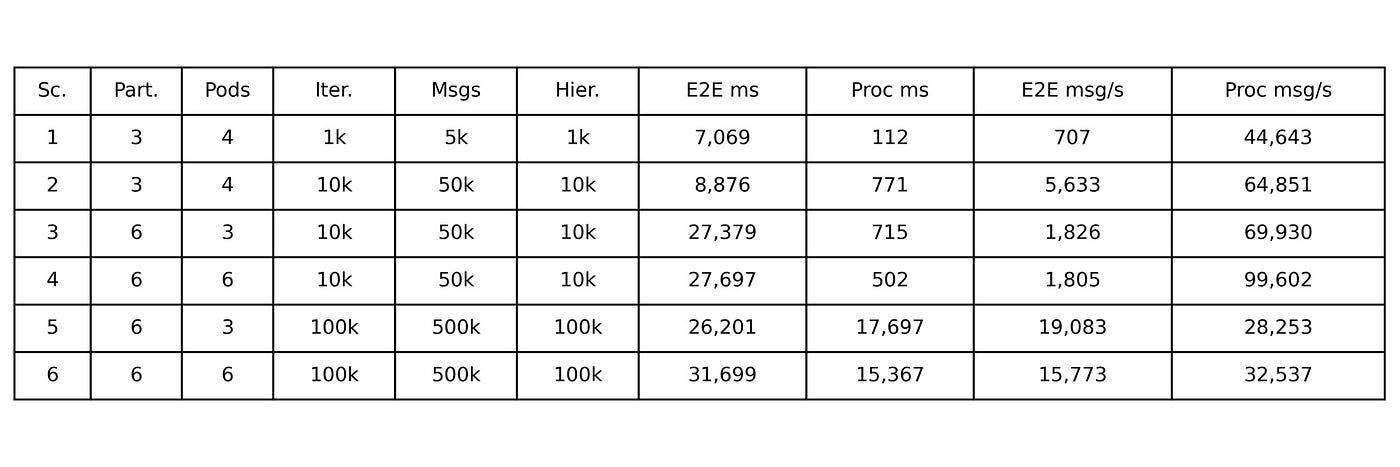
Two throughput metrics are reported:
- End-to-End Throughput — includes producing, consuming and verification
- Processing Throughput — calculated from the first and last observed verification timestamp and reflects only active processing
Processing Window represents the time between the first and last verification record observed in the verification topic. It excludes application startup, Kafka consumer initialization, rebalance time, and test orchestration overhead. As a result, it approximates the duration of active message processing only.
Processing throughput should be interpreted as an indicator of active processing capacity rather than an end-to-end benchmark.
At first glance, the results may seem surprising.
In several scenarios, increasing the number of pods did not improve end-to-end throughput.
However, before jumping to conclusions, it is important to analyze workload distribution and partition ownership separately from raw throughput numbers.
In all six scenarios every hierarchy key was processed by exactly one pod.
No hierarchy was observed crossing pod boundaries.
Workload distribution remained close to uniform in all scenarios:
- 1 000 hierarchies: approximately 33% / 33% / 33%
- 10 000 hierarchies: near-perfect distribution
- 100 000 hierarchies: near-perfect distribution
Scenario 1
Observed pod distribution:
349 | 318 | 333
One application instance remained idle.
Why did one pod remain idle?
This is expected. Kafka Streams can only create as many active processing tasks as there are partitions. Since the topic contains three partitions, only three pods can actively process data.
Partitions define maximum parallelism.
Scenario 2
Increasing the workload from 1 000 to 10 000 hierarchies improved overall throughput significantly while preserving ownership guarantees.
This is expected because the fixed startup and coordination costs become less significant as the workload grows.
Scenario 3 vs Scenario 4

Comparison (scenario 3 vs scenario 4)
End-to-end throughput remained almost identical, while processing throughput increased significantly in Scenario 4.
The actual processing was distributed more efficiently, but the end-to-end execution time remained dominated by factors outside the processing window.
Adding more pods increased processing throughput, but did not improve end-to-end throughput.
This demonstrates that processing parallelism and end-to-end throughput are not necessarily the same thing.
The experiment was executed on a single-node Kubernetes cluster. In a real multi-node environment, the results could be significantly different.
Scenario 5 and Scenario 6
Increasing the number of pods from three to six did not improve end-to-end throughput in the local single-node Kubernetes environment.
3 pods -> 19083 msg/s
6 pods -> 15773 msg/s
The end-to-end throughput was actually lower despite doubling the number of pods.
The processing throughput increased from 28k to 32k msg/s, but end-to-end throughput decreased.
At this point CPU contention, scheduling overhead, consumer coordination, and local Kubernetes limitations begin to dominate the overall execution time.
More pods do not automatically mean higher throughput.
The experiment demonstrates that adding more pods does not automatically increase throughput. The available hardware resources and deployment topology must also be considered.
Limitations
These experiments were executed on a local single-node Kubernetes cluster running on Docker Desktop.
Therefore the reported throughput numbers should not be treated as production benchmarks.
The goal of the experiment was to observe partition ownership and scaling characteristics rather than absolute performance.
What did we actually prove?
- ownership guarantees were preserved
- partition count defined maximum active parallelism
- more pods did not necessarily improve end-to-end throughput in a single-node environment
Key Findings
✅ Kafka Streams successfully preserved ownership of every order hierarchy across all test scenarios. No hierarchy was observed crossing pod boundaries.
✅ Increasing the number of partitions increased available processing parallelism, while increasing the number of pods beyond the partition count did not provide additional active processing capacity.
✅ Partitions determine the maximum available parallelism of a Kafka Streams application, while overall throughput depends on workload characteristics and infrastructure constraints.
Code & Examples
All examples presented in this article — including topology tests based on TopologyTestDriver — are available in the public repository:
👉 https://github.com/pziobron/stateful-order-fill
The tests are intentionally self-descriptive and serve as executable documentation of the expected behavior.
What next ?
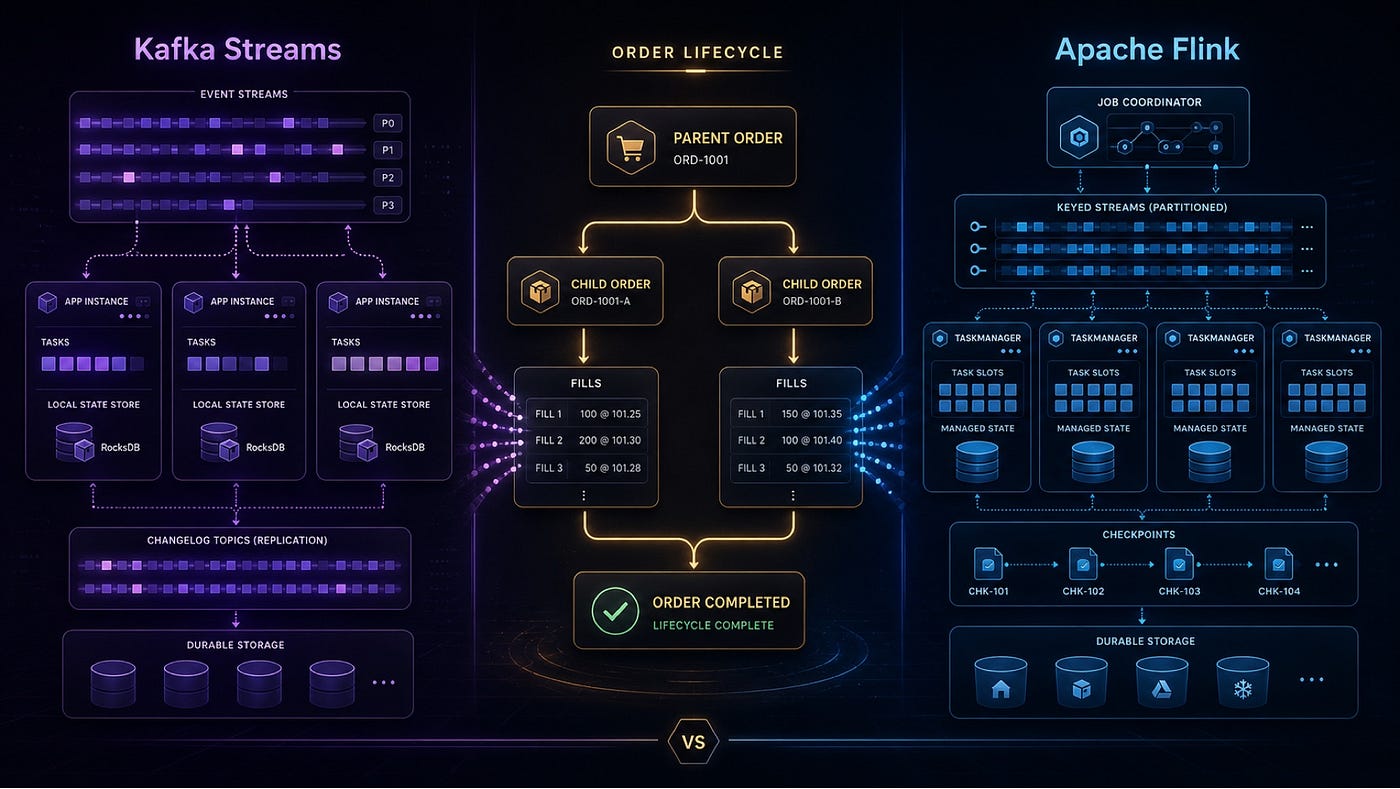
In the next part of the series we will explore Apache Flink and compare its programming model and operational characteristics with Kafka Streams.
This article and the accompanying code are based on a simplified, self-contained proof of concept created for educational purposes.
It does not represent any production system, internal architecture, or proprietary solution of any organization.
메타데이터
- post_id
- 41797f6ed8e4
- slug
- stateful-order-fill-matching-with-kafka-streams-part-4-horizontal-scaling-partitions-and-41797f6ed8e4
- url
- https://medium.com/@pziobron/stateful-order-fill-matching-with-kafka-streams-part-4-horizontal-scaling-partitions-and-41797f6ed8e4
- canonical_url
- https://medium.com/@pziobron/stateful-order-fill-matching-with-kafka-streams-part-4-horizontal-scaling-partitions-and-41797f6ed8e4
- author_url
- https://medium.com/@pziobron
- status
- ok
- fetched_at
- 2026-06-18 00:10:23