Unlocking Data Insights with Rill: A Comprehensive Guide to Streamlined Data Analytics
Harness the Power of Rill for Real-time Data Processing and Analytics
Unlocking Data Insights with Rill: A Comprehensive Guide to Streamlined Data Analytics
Harness the Power of Rill for Real-time Data Processing and Analytics
Image from https://www.shanecmiller.com/rill
Introduction to Rill
In the ever-evolving landscape of data analytics and real-time data processing, having the right tools and technologies at your disposal is crucial. Rill, a powerful and versatile platform, empowers you to process, analyze, and visualize data in real-time with ease. In this comprehensive tutorial, we’ll explore how to leverage Rill to streamline data analytics, using a practical example from the Rill GitHub Analytics repository.
Rill is an open-source platform that simplifies real-time data processing and analytics. It offers a range of features and capabilities, including:
- Real-time Data Processing: Rill allows you to process data as it’s generated, making it ideal for applications requiring up-to-the-second insights.
- Data Transformation: You can transform and enrich data streams using various built-in functions, ensuring your data is in the desired format for analysis.
- Integration with Popular Data Stores: Rill seamlessly integrates with data stores like Elasticsearch, Kafka, and more.
- Scalability: It’s designed to handle high volumes of data, making it suitable for both small-scale and large-scale projects.
Scope of this article
This tutorial will cover a gentle introduction to Rill, its main features and design principles, as well as how easy is to install it locally and start feeling the power of BI-as-code by executing one of the examples from GitHub repo.
We will learn in-depth how Rill’s Sources works, by understanding how Rill’s API ingests sources to the UI platform, leaving Models and Dashboards to be explored with more detail in future articles.
Rill’s design principles
According to the information provided in its GitHub repo, Rill is considered:
…the fastest path from data lake to dashboard. Download Rill to start modeling data and create fast, exploratory dashboards.
- Feels good to use — powered by Sveltekit & DuckDB = conversation-fast, not wait-ten-seconds-for-result-set fast
- Works with your local and remote datasets — imports and exports Parquet and CSV (s3, gcs, https, local)
- No more data analysis “side-quests” — helps you build intuition about your dataset through automatic profiling
- No “run query” button required — responds to each keystroke by re-profiling the resulting dataset
- Radically simple interactive dashboards — thoughtful, opinionated, interactive dashboard defaults to help you quickly derive insights from your data
- Dashboards as code — each step from data to dashboard has versioning, Git sharing, and easy project rehydration
First Steps and Installation
Before we dive into the world of Rill, ensure you have the following prerequisites in place:
- Assuming you are a Windows user, you will need to have WSL2 installed in your system, If you don’t know how to do it, here is a useful how-to guide. If you are a Linux or Mac user, you will not have any problems.
- Make sure you have Rill installed on your system. You can follow the installation instructions provided in the official Rill documentation, but the only thing you will need to do is:
curl -s https://cdn.rilldata.com/install.sh | bashOnce the above command runs successfully in a few seconds, you will receive this output:
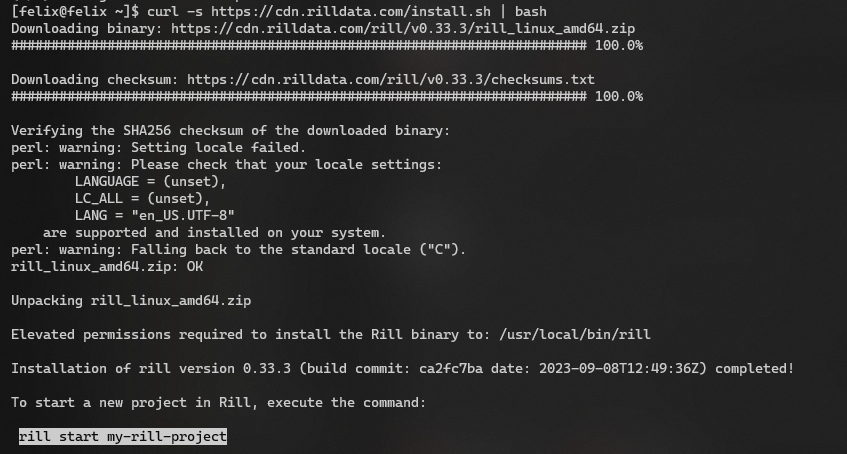
Then you will notice that a directory called .rill was created in your home directory:
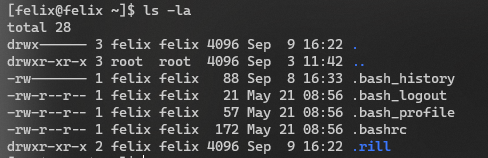
Once you inspect this directory, you will notice that 3 files are created.
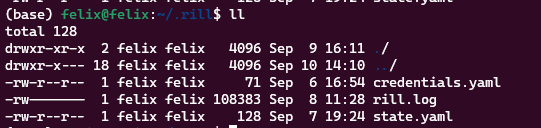
credentials.yamlholds your personal credentials used by the API every time you deploy a Rill project.rill.logstores all the logs generated by every local execution of Rill projects.state.yamlhas basic data of your installation

With the prerequisites covered, let’s embark on our journey with Rill!
Setting Up the Rill Example
The first step to start feeling the power of real-time Analytics and BI-as-code, is to clone a local repo of rill-examples by running the following line in your Terminal:
git clone https://github.com/rilldata/rill-examples.gitI will be guiding you on how to run the Rill App Engagement example repository on your local machine, which contains a practical use case that we’ll explore in this tutorial.
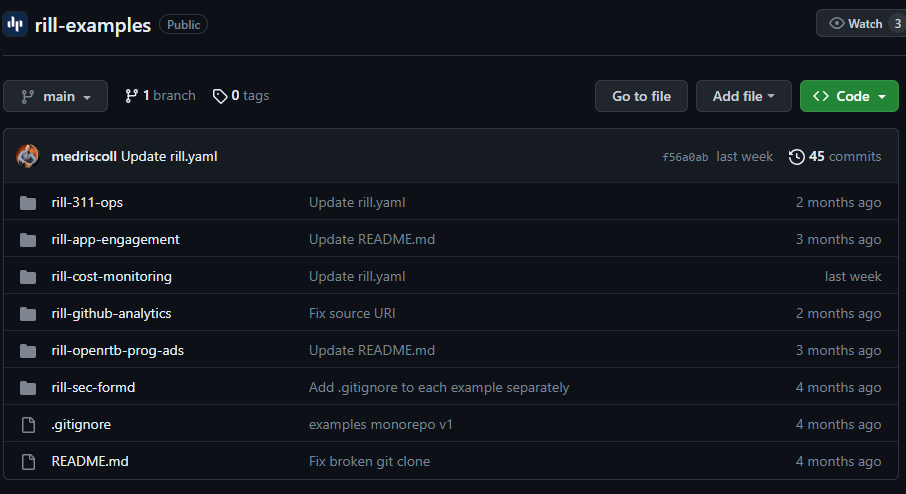
All you will need to do is cd to rill-examples/rill-github-analytics locally:
cd rill-examples/rill-app-engagementOnce you are in that directory, you just need to rill start, then a server will start running in the port 9009
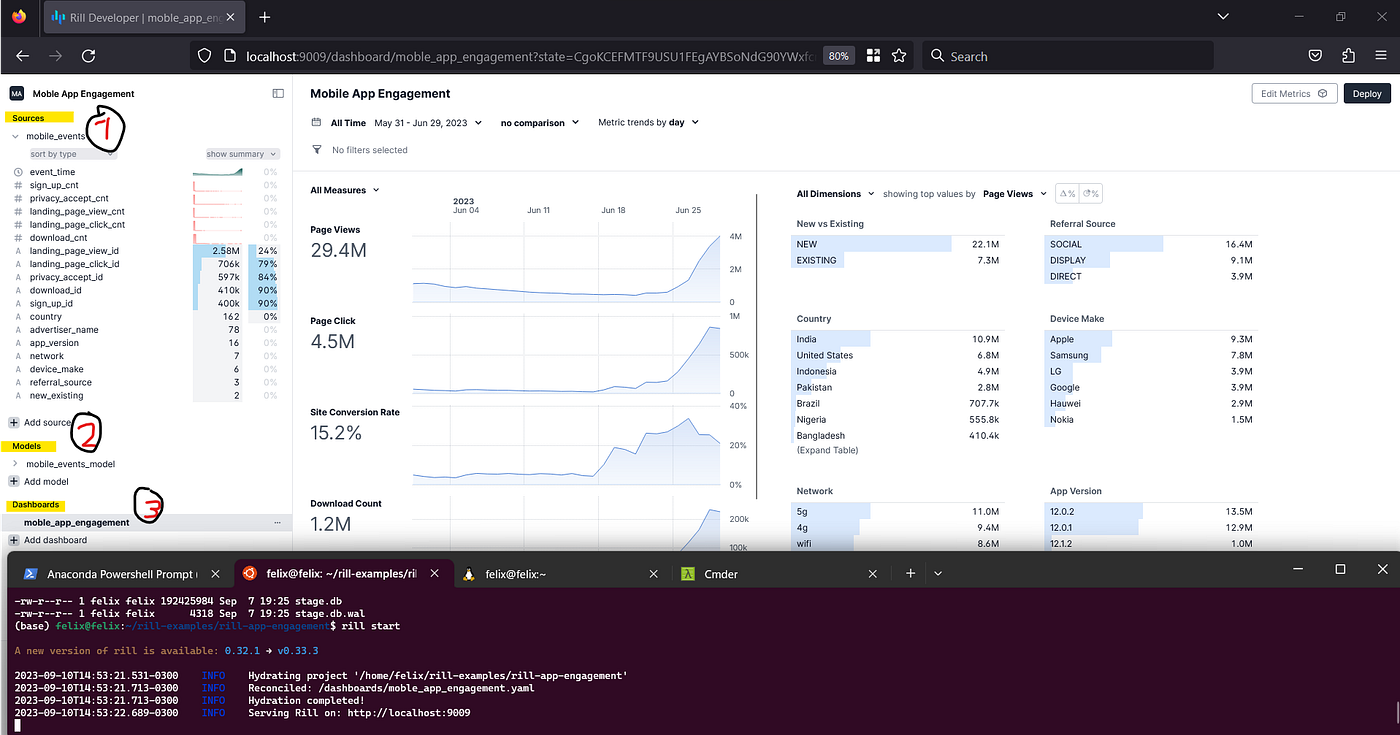
If you quickly inspect what’s inside the .yaml file inside the sources folder, you’ll notice that is performing a request to an endpoint of a file stored in Cloud Storage.

Rill’s main components
The main components of every Rill project are:
- Sources: Once you have added a source to your project by using the UI or the CLI, your code definition will be automatically loaded into the folder named
sources, with a.yamlfile inside. For those more accustomed to setting their infrastructure with code, sources can also be created as artifacts, just by creating asource_name.yamlfile in thesourcesfolder of your Rill project directory with the code above.
type: "s3"
uri: "s3://bucket_name/path/to/bucket/file_name.csv"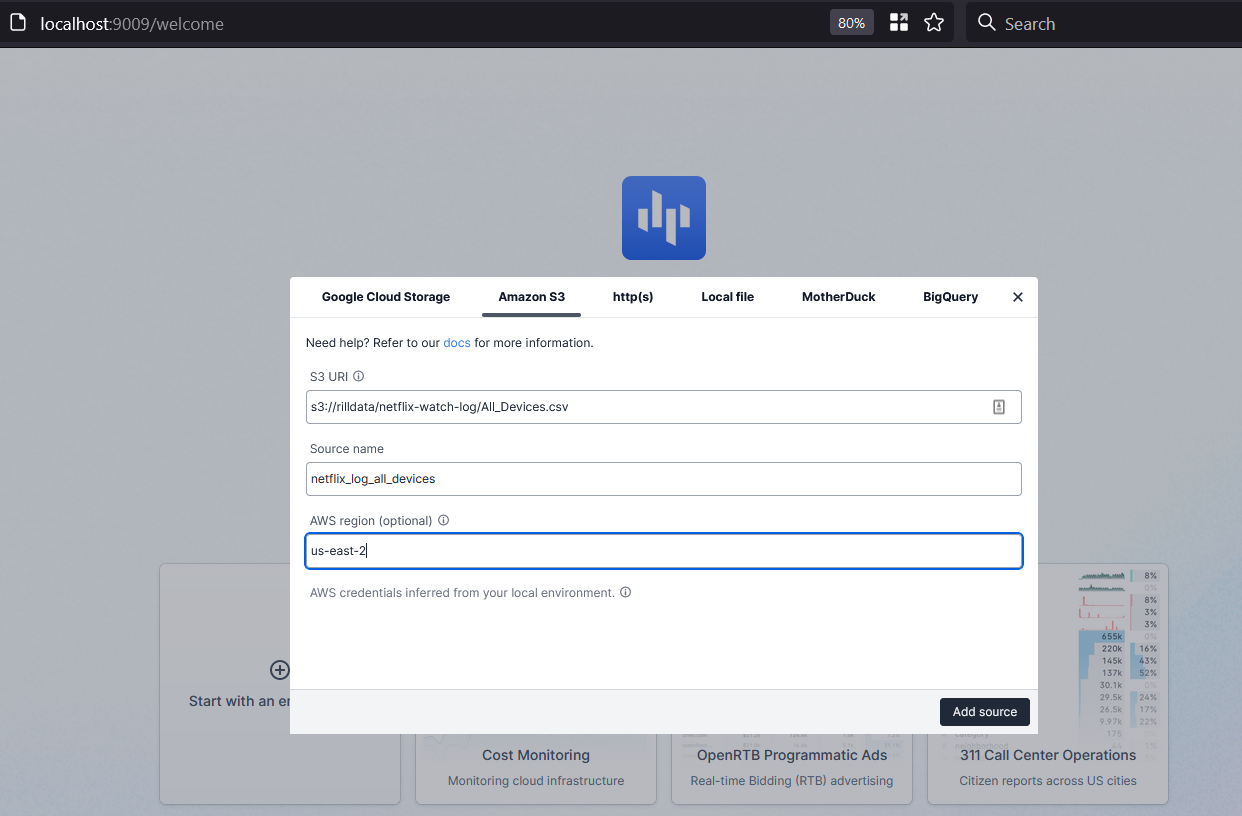
In the screenshot above I have added a Source that points to a file stored in an S3 bucket. Once you have set up all your sources, one of them will look similar to this:
Find the details on how to create Sources in the official documentation.
- Models: In Rill terms, Data models are a series of SQL SELECT statements that work on source data. They are similar to models defined in dbt. They allow you to join, transform, and clean data. These transformations are powered by DuckDB and their dialect of SQL (DuckDB SQL). Please visit DuckDB SQL documentation to learn about how to write your queries.
- Dashboards: In Rill, your dashboards are defined by metric definitions. Metric definitions are composed of:
A model — A data model creates One Big Table that will power the dashboard.
A timeseries — A column from your model that will underlie x-axis data in the line charts. Time will be truncated into different time periods.
Measures — Numerical aggregates of columns from your data model shown on the y-axis of the line charts and the “big number” summaries.
Dimensions — Categorical columns from your data model whose values are shown in leaderboards and allow you to look at segments and filter the data.
Understanding about how Rill manages sources
Rill requires credentials to connect to remote data sources such as private buckets in S3 or GCS.
When running Rill locally, Rill attempts to find existing credentials configured on your computer, so in the case of AWS users, Rill will go to your locally stored credentials in your home directory to the.aws/credentialsfile. If you don’t have configured your AWS credentials locally, you can follow this guide.
When deploying projects to Rill Cloud, you must explicitly provide service account credentials with correct access permissions.
Now let’s understand how Rill computes the data that we see in the UI once we have ingested a project with several sources.
As we saw before, sources are defined in a .yaml file inside the sources folder, we can also be able to see the source definition in the UI when we click the source in the left panel. Some other useful basic statistics about our dataset are automatically generated by Rill, such as the number of unique values for one of the columns, the number of rows and columns in the dataset, as well as the count of values of each element in a series (column).
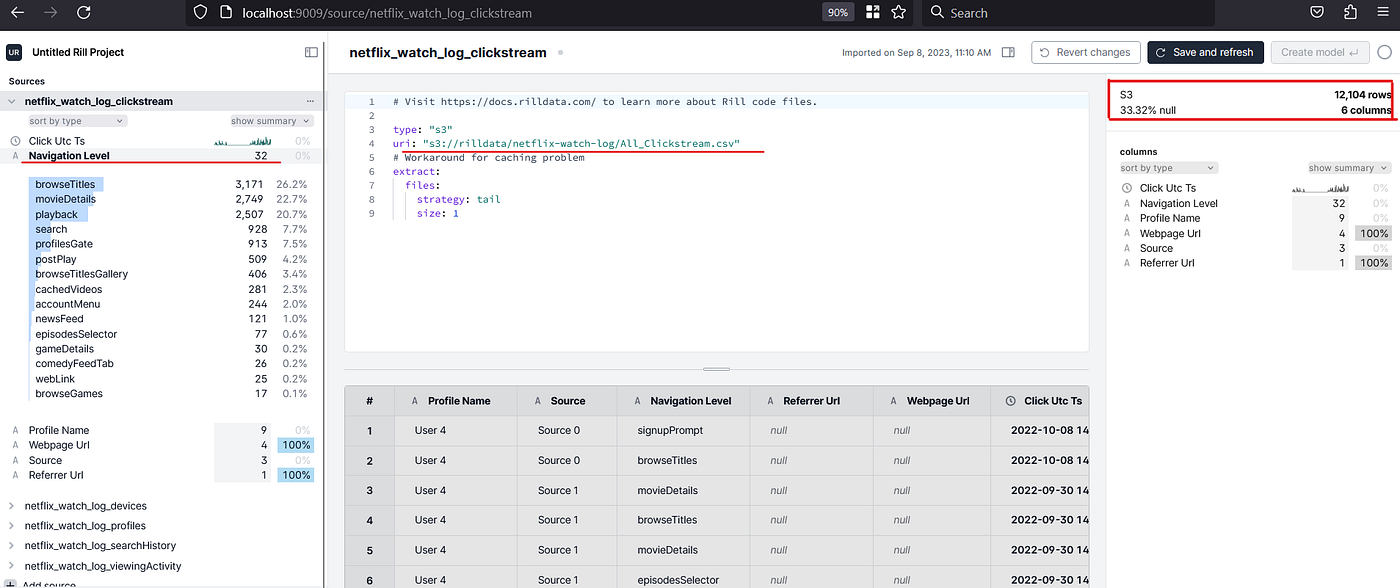
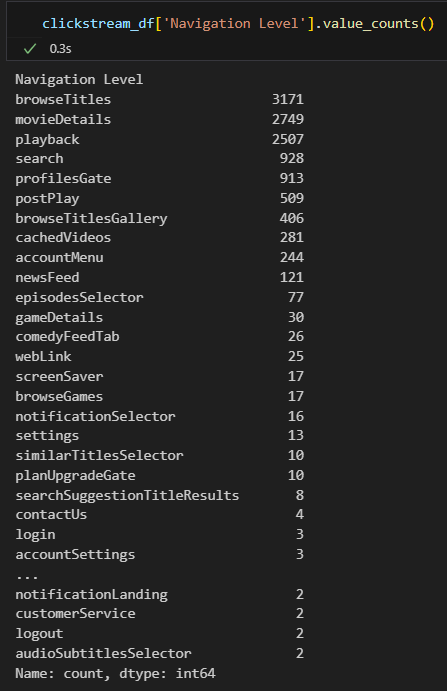
The basic statistics provided by the sources in a Rill Dashboard, are similar to the pandas value_counts() method or the pandas info()function when it’s applied over a DataFrame column, generating the count of unique values for each of the elements on the Series.
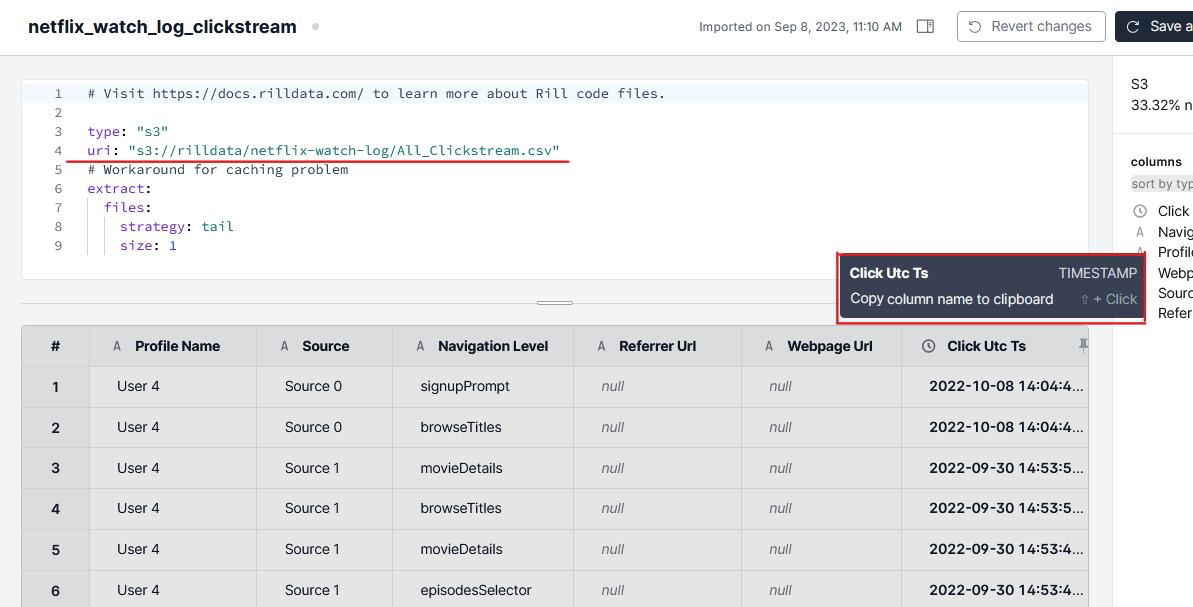
A nice feature of Rill’s data ingestion process, is that it infers the data types of the sources:
Next steps
With the Rill pipeline running, you can analyze the real-time data as it flows through the system. You can customize the analytics and visualizations based on your specific use case and requirements.
Feel free to clone the repo where I uploaded all the analysis and Rill project I explained in this tutorial, and I will be experimenting more with Models and Dashboards for further parts of this tutorial.
Conclusion
In this tutorial, we’ve introduced you to Rill, an impressive platform for real-time data processing and analytics. We’ve explored the Rill GitHub Analytics example, showcasing how to set it up and run a real-time data pipeline for processing GitHub events.
Rill opens up a world of possibilities for real-time data analytics across various domains, from monitoring user interactions on websites to analyzing sensor data in IoT applications. To dive deeper into Rill’s capabilities and explore more use cases, refer to the official Rill documentation and the GitHub repository.
With Rill, you have the tools to harness the power of real-time data for informed decision-making and actionable insights, making it a valuable addition to your data analytics toolkit.
References
“Welcome to Rill | Rill.” docs.rilldata.com
메타데이터
- post_id
- 41d83e06966d
- slug
- unlocking-data-insights-with-rill-a-comprehensive-guide-to-streamlined-data-analytics-41d83e06966d
- url
- https://blog.dataengineerthings.org/unlocking-data-insights-with-rill-a-comprehensive-guide-to-streamlined-data-analytics-41d83e06966d
- canonical_url
- https://blog.dataengineerthings.org/unlocking-data-insights-with-rill-a-comprehensive-guide-to-streamlined-data-analytics-41d83e06966d
- author_url
- https://medium.com/@felixvidalgu
- status
- ok
- fetched_at
- 2026-07-25 06:22:12